
KPI Examples for YouTube
YouTube Key Performance Indicators and Metrics
✔ See different templates & designs ✔ Find & track the right YouTube KPIs to meet your corporate objectives
A YouTube KPI or metric is an evaluative measurement tool used for video content performance on the YouTube social media channel. It is based on defining the right factors needed to establish successful content, essential for a lucrative social media video strategy.
Just like any other social media platform, YouTube collects valuable data on viewers’ behaviors and preferences. Visualizing all of these indicators with the help of modern dashboard software together in a professional YouTube dashboard can present a great advantage over competitors, especially considering the pace at which video content is growing in the past years. Here we will present you with the most valuable YouTube metrics for state-of-the-art KPI tracking in order to extract relevant conclusions to improve your channel’s performance and keep an engaged audience. Getting this level of insight in real-time allows Youtubers to generate content that is targeted and will most likely be successful in the long run.
Here is the complete list of the 13 most important YouTube KPIs and metrics, that we will discuss in this article in every detail:
Total Watch Time: How long have users watched my videos?
Total Amount of Video Views: Which videos are particularly interesting?
Viewer Retention: Are my videos captivating viewers?
Video Engagement: How do viewers react to my videos?
Positive & Negative Comments: What is your viewers’ sentiment?
New & Lost Followers per Video: What impact do single videos have?
Number of Subscribers: How many subscribers have I gained or lost?
Daily Active Users (DAU): How many people are watching daily?
Traffic Source: Where does my traffic come from?
Subscribers’ Demographics: Where do my subscribers come from?
Top 5 Videos by Views: What kind of videos resonates the best?
Revenue Per Mille: How much are you earning from your content?
Playback-based CPM: What is the cost of video playbacks?

Total Watch Time
How long have users watched my videos?Developing the Watch Time – whether aggregated or for individual videos – is one of the most important YouTube KPIs, as it ultimately reflects the level of satisfaction, the primary need of YouTube users: the need to consume great video content. By monitoring the aggregated Watch Time of all published videos on a daily basis, you can quickly and reliably identify trends and outliers. Also, you can do a detailed analysis of individual videos, which will assist you in gaining valuable new insights. All those findings will help you develop best practices and optimize your video marketing strategy on a sustainable level.
Performance IndicatorsThis YouTube KPI assists you in monitoring the quantitative evolution of your video performance. Compare the average Watch Time of different videos to identify internal benchmarks.
Relevant Showcase Dashboard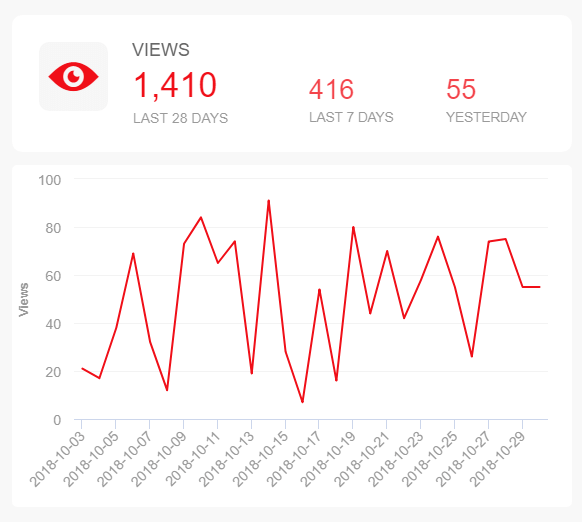
Total Amount of Video Views
Which videos are particularly interesting?In combination with the average Watch Time, the analysis of the actual number of views of a single video is particularly exciting. Such consideration helps you quickly identify your most popular videos. However, if a video has gained a lot of views, but the Watch Time is significantly lower than the average, it indicates that users are not satisfied with it. Potential causes could be, for example, a misleading title, description, or video thumbnail, which has given the users false expectations regarding the content of the video. The Views, together with the Watch Time metric, will provide you with a holistic view of the impression you make on this social media platform.
Performance IndicatorsTake a critical look at your videos – the ones that have the highest and least number of Views in a given time frame, to gain valuable new insights for your YouTube marketing strategy.
Relevant Showcase Dashboard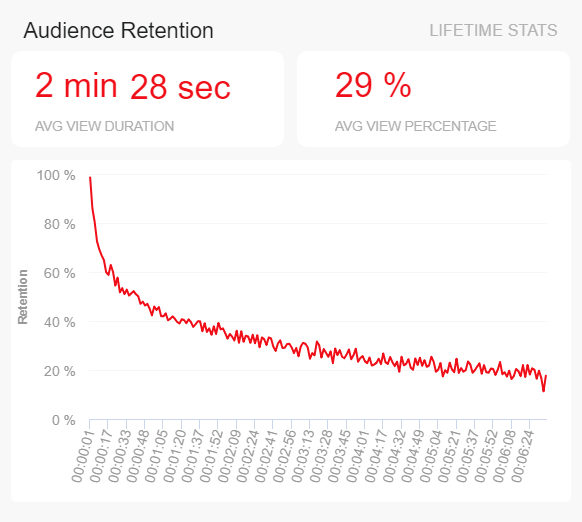
Viewer Retention
Are my videos captivating viewers?Audience Retention is another important YouTube KPI. It can be monitored in a standardized manner, with the already mentioned average Watch Time. In addition, it would make sense to take a close look at the detailed history of individual videos. In our example, it is noticeable that approximately 50% of users have ended the video in the first 30 seconds. Is this process normal compared to other videos? Is the introduction simply too boring? Is the video quality worse than usual? Often, a big percentage of people typically leave long before the video actually ends, so you might want to consider what made them stop watching.
Performance IndicatorsA detailed Audience Retention analysis of your individual videos will help keep your viewers interested in your content, while you will have a chance to identify potential issues.
Relevant Showcase Dashboard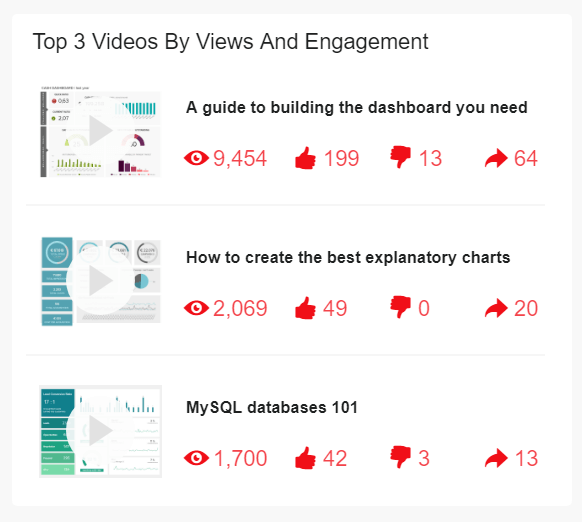
Video Engagement
How do viewers react to my videos?Like other social media channels, Engagement is one of the main focus when analyzing YouTube data. YouTube metrics that perfectly show what kind of Engagement have you received are Likes, Dislikes, Comments, and Shares. It demonstrates if people like your content, and if you target the right audience with the right videos. which helps you, in the end, to become more popular. Dislikes is a distinct feature that can tell you how many people didn’t like what you posted, and although it’s a good Engagement metric, if the number is high, you might want to consider why you gained those negative reactions (or you actually planned to). Analyzing reactions will tell you more about your audience and what relationships you have with them.
Performance IndicatorsDetermine what kind of reactions your videos are attracting, perform an analysis of your metrics and adjust to your audience’s needs.
Relevant Showcase Dashboard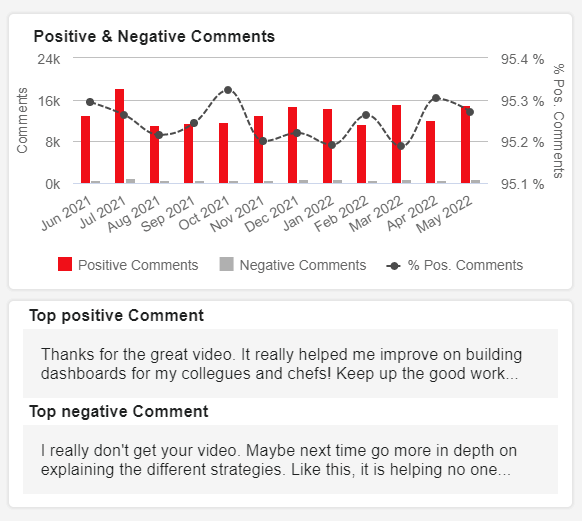
POSITIVE & NEGATIVE COMMENTS
What is your viewers sentiment?Our next YouTube KPI tracks the positive and negative comments on your videos and compares them to each other. It does this by applying a sentiment analysis algorithm that analyzes the tone of different comments to automatically understand the feelings and emotions behind them. This is an invaluable indicator to track as it can also provide valuable insights to improve your content. For instance, in the image above, we can see that the user is providing feedback regarding the structure and approach of the video. This is free advice coming from your viewers and it might be good tips for future content.
Performance IndicatorsDon’t stick only to the bad comments, monitor your positive ones as well and extract content ideas or any other form of valuable feedback.
Relevant Showcase Dashboard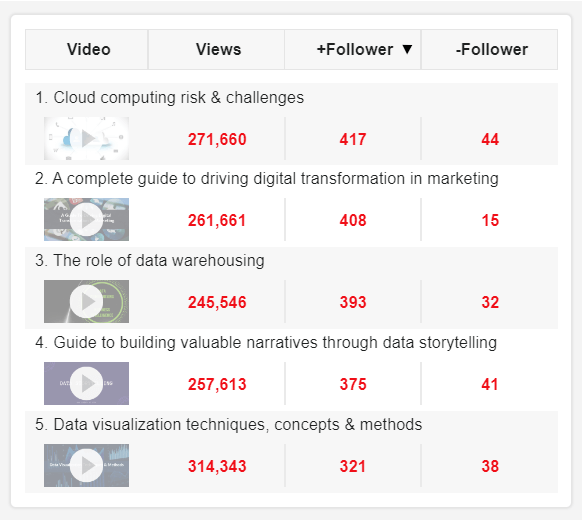
NEW & LOST FOLLOWERS PER VIDEO
How do single videos affect your follower count?This straightforward KPI tracks the number of gained and lost followers (subscriber) per video. Just like any other social media platform, the main goal of a YouTube channel is to build an engaged and loyal community. This can be tracked through various indicators such as interactions, engagement, and of course, followers. Tracking the number of new and lost followers per video can help you understand if you are providing your audience with valuable and interesting content to make them want to subscribe or stay on your channel. An ideal situation would be to steadily grow your following with minimum loss. If this is not the case, then you need to look into your content and reassess your methods.
Performance IndicatorsIdentify the videos with which you have gained or lost the most followers. Try to find insights for your overall content strategy.
Relevant Showcase Dashboard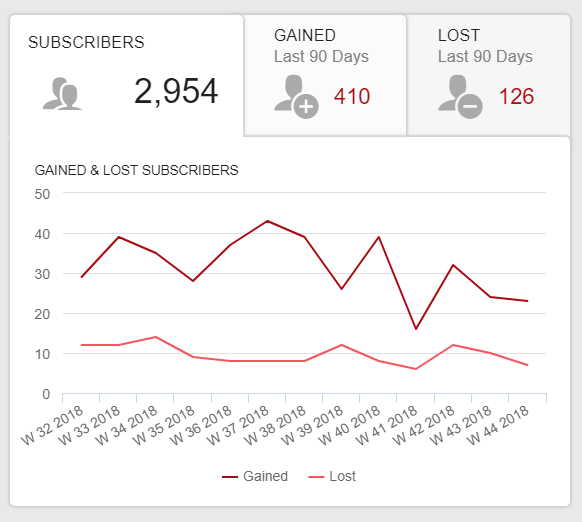
Number of Subscribers
How many subscribers have I gained or lost?This KPI will show you how many people are following your channel regularly. But do keep in mind the platform’s permissions to list subscribers or not. That means that the ones who have made their subscription public will be shown in your analysis. You can get an overview of the total amount of subscribers, gained and lost, in a simple visual, which will determine how your statistics are performing over a set period. Comparing these 2 YouTube KPI examples will help you get an interactive insight, which you can then additionally analyze with other indicators and perform conclusions.
Performance IndicatorsEstablish your goal of how many subscribers you want to expand over a specific period and track how many you have gained and lost. That way you can tailor your content to meet your audience’s needs.
Relevant Showcase Dashboard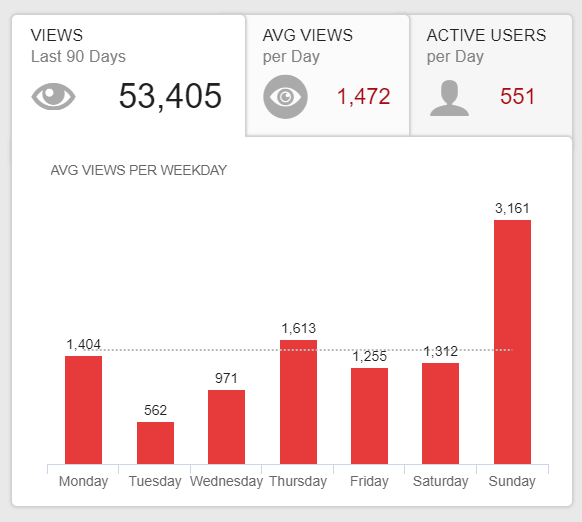
Daily Active Users (DAU)
How many people are watching daily?When you start building your YouTube channel, one of the main points to consider is the Views number you want to achieve per day. Daily Active Users are important to follow since they are your most trustworthy fans. Your goal is, of course, to increase those numbers as DAU is one of the most important numbers you have to track for your YouTube strategy. With datapine, you can see those metrics in a neat overview that will show you, also, how you perform on a specific weekday. You should track those weekdays because that is the way to understand when the best time to post actually is, and reach the best possible result for your channel.
Performance IndicatorsLook for the Average views per day and Active users that will show you how your channel is perceived on a daily level.
Relevant Showcase Dashboard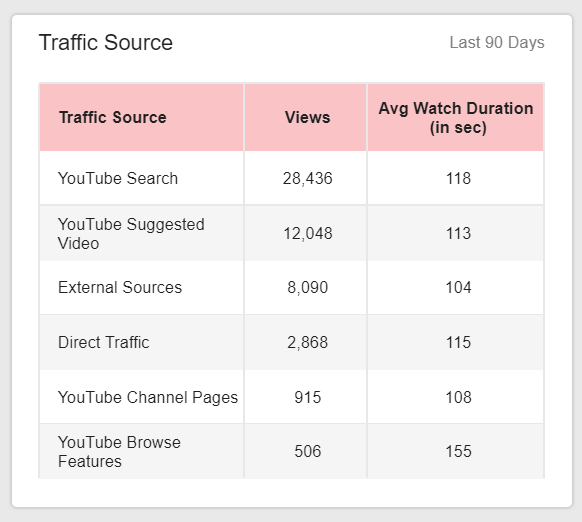
Traffic Source
Where does my traffic come from?In what ways do YouTube users find your content is a great starting point to learn your Traffic sources: YouTube Search, YouTube Suggested Video, External Sources, Direct Traffic, YouTube Channel Pages or YouTube Browse Features. The Average Watch Duration, shown in this example, will tell you more about how well your videos are received. Additionally, it would make sense to tackle deeper into your Traffic since you can find out what was the exact Search query or Social media platform that convinced people to visit your channel. Some sources, like YouTube Search, have a higher click-through-rate than the Home source (from the Browse Features), because the Search viewers have a greater intent to watch.
Performance IndicatorsPerforming an analysis of your Traffic will show you details about the specific sources your channel has gained over a period of time. Use that wisely to analyze additional indicators and increase your YouTube popularity.
Relevant Showcase DashboardBecome a data wizard in less than 1 hour!
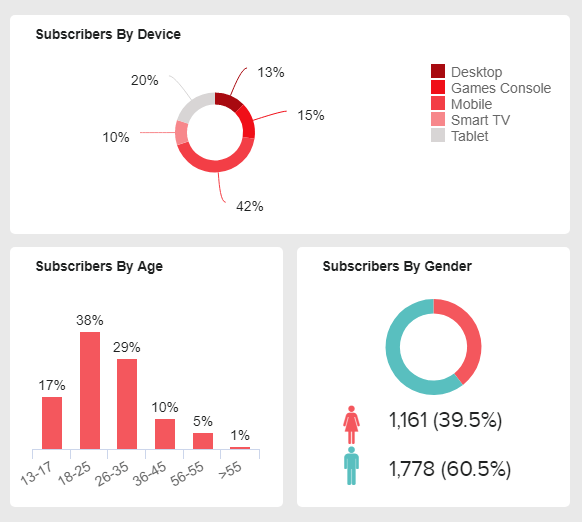
Subscribers’ Demographics
Where do my subscribers come from?Becoming familiar with your YouTube audience is of paramount importance when you analyze your channel and strategy. An important indicator to consider is the Device metric (since you need to think about production costs of modifying videos for other means of broadcasting), Age metric (to consider the differences between Millennials or Seniors, for example), and Gender (to adequately adjust the styling of the video). You can also use these statistics to validate your original target audience (as you usually think of your audience long before you create the first video). If the audience is different than you thought it would be, analyze the reasons. With datapine, it can be done with just a few clicks.
Performance IndicatorsIdentify your audience demographics so that you can tailor your videos specifically to your targets.
Relevant Showcase Dashboard
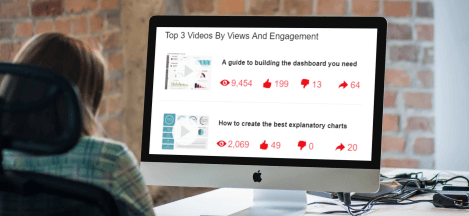
Top 5 Videos by Views
What kind of videos resonates the best?Your Top 5 videos by Views (and Engagement) will tell you where your highest success has been made. By leveraging the data of your most popular videos, you can easily spot what kind of content suits your audience best. That means that the higher the number of Views, Comments, Likes, and Dislikes will show you how to repeat your accomplishments for future video postings. It would make sense to go deeper into the analysis and see the time your video was posted and additionally the demographics, since you want to know which kind of audience reacts the most and when is the best time to post.
Performance IndicatorsDefine the highest number of views and reactions and use these findings for reference when creating your next videos.
Relevant Showcase Dashboard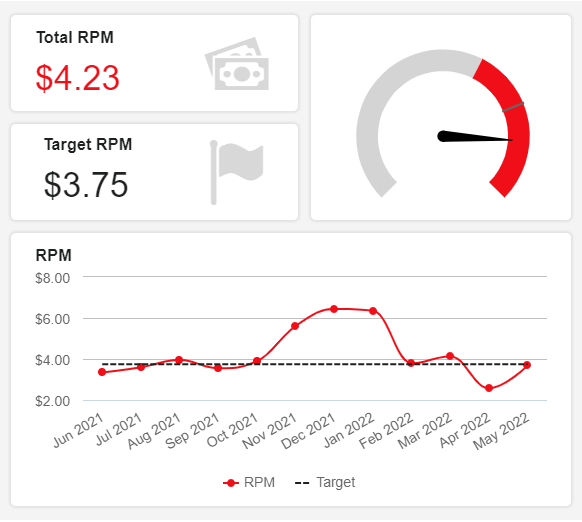
REVENUE PER MILLE (RPM)
How much are you earning from your content?Moving on to a more financial side of things, the RPM is a KPI used by professional channels that monetize their content. It tracks the money you earn per 1.000 video views (including non-monetized ones) after YouTube’s share has been subtracted. Sources considered in the RPM’s calculation include Ads, Channel memberships, YouTube Premium revenue, Super Chat, and Super Stickers. Until a few years ago, Youtubers had to calculate the RPM on their own as the platform only provided CPM data. The difference between these two metrics is that the CPM considers YouTube’s shares, therefore, it will always be higher than your RPM. Additionally, the RPM is considered a creator-focused metric, while the CPM is considered an advertiser-focused metric as it tells the costs of showing an ad on YouTube.
Performance IndicatorsSome ways to increase your RMP include creating quality content, optimizing ad formats and sizes, and ensuring you are targeting the right audience, just to name a few.
Relevant Showcase Dashboard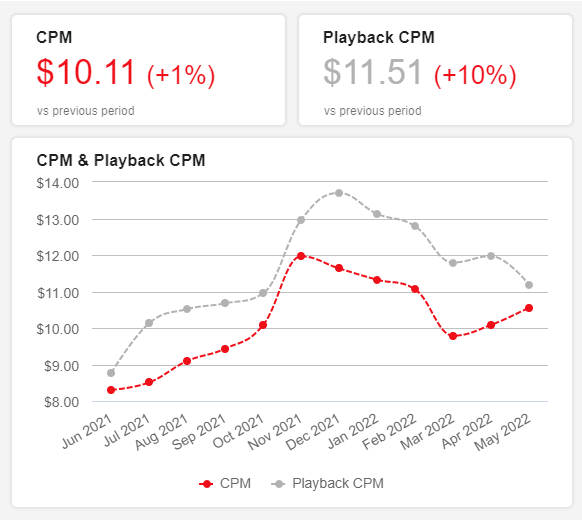
PLAYBACK-BASED CPM
What is the cost of video playbacks?The playback CPM is another financial metric that tracks the cost an advertiser pays for 1.000 video playbacks where an ad is displayed. YouTube playbacks are the number of times a browser or device played a video. The main difference between the playback CPM and the CPM lies in the fact that YouTube videos can include one or more ads. On one hand, the CPM tracks the advertiser costs for 1.000 individual ad impressions, and on the other hand the playback-based CPM tracks the advertiser costs for 1.000 video playbacks that include one or more ads, which is why it is usually higher than the regular CPM. It is important to note that YouTube shares have not been subtracted from this KPI. If you want to understand the exact amount you will earn, you need to look at the RPM.
Performance IndicatorsThe playback-based CPM can be increased by, among other things, a higher average watch time or longer videos, which means that more ads are played out on average.
Relevant Showcase Dashboard


Setup only takes a few minutes. No credit card required!