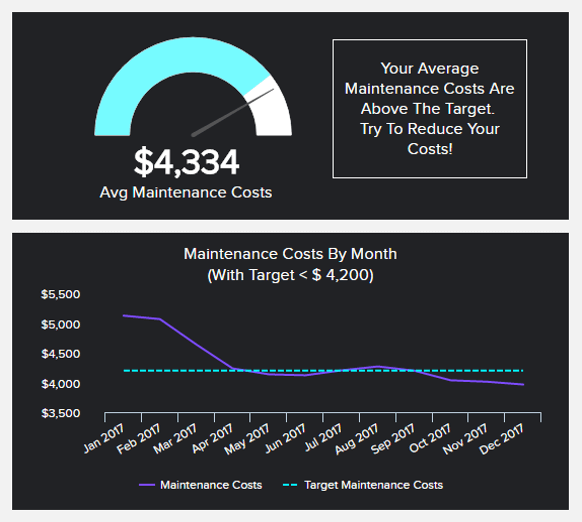
automatic production process in the manufacturing industry

KPI Examples for the Manufacturing Industry

Manufacturing Key Performance Indicators and Metrics

✔ See different templates & designs ✔ Find & track the right manufacturing KPIs to meet your corporate objectives

A manufacturing KPI or metric is a well-defined measurement to monitor, analyze and optimize production processes regarding their quantity, quality as well as different cost aspects. They give manufacturers valuable business insights to meet their organizational goals.

In our detailed overview, we will show you the power of manufacturing metrics that will serve as a roadmap for developing your own manufacturing dashboard. Nowadays, the controlling and optimizing the whole production process, ensuring that the equipment works at an optimal level, and maintenance costs continually decrease, are essential elements of positive growth in the industry. Turning to manufacturing analytics is a certain way that this growth can be achievable by utilizing interactive metrics, and automating many aspects of data management. Creating reports, combining multiple data sources, and consolidating various touchpoints is possible thanks to modern KPI software.

That said, here is the complete list of the top 19 manufacturing KPIs and metrics that every manufacturer needs to know:

Production Volume: Track the quantities that you are able to produce

Production Downtime: Analyze and optimize your maintenance

Production Costs: Monitor the costs implied in the production

Overall Operations Effectiveness (OOE): Evaluate your operational efficiency

Overall Equipment Effectiveness (OEE): Assess the scheduled efficiency

Total Effective Equipment Performance (TEEP): Track overall effectiveness

Capacity Utilization: Maximize the use of your capacities

Throughput: Measure your production capabilities

First Pass Yield: Monitor your production quality

Scrap Rate: Track the amount of failed units

Defect Density: Track the damaged items right away

Rate of Return: Measure how many items are sent back

On-time Delivery: Ensure your products are delivered on time

Right First Time: Understand the performance of your production process

Asset Turnover: Acknowledge your assets in relation to your revenue

Unit Costs: Track and optimize your units costs over time

Return on Assets: See how profitable your business is relative to its assets

Maintenance Costs: Evaluate your equipment costs in the long run

Revenue Per Employee: Measure the success of your workforce

charts and graphs showing the production volume over time

Production Volume

Evaluate your production volume over time

Our first manufacturing KPI example will give you an overview of what your factories are able to produce in a month, a semester or a year. You then have the big picture of what your company is handling and when. Comparing it to previous similar periods with the help of a dashboard is a good indicator of evolution, to stop anomalies, regress or progress. Likewise, measuring which machine makes up for which percentage of the production can give you an idea of their development and importance – no one wants to see a 45%-production machine breaking down without a plan B. Acknowledging that will also help in assessing your assets and what you invest in them (cf. return on asset).

Performance Indicators

A good production volume is one that satisfies demand but does not leave too much inventory in stocks.

Relevant Showcase Dashboard
visual example of the production downtime for a manufacturing company

Production Downtime

Optimize your maintenance regularly

One of the most important manufacturing metrics to track is production downtime. If your machines are not working, the result is money that can’t be made: reducing your downtimes to a minimum must be your goal number one to avoid further lost profit. When downtime happens, it is necessary to report the reasons why it occurred, as it is the only way you can track the problems, assess them, and then acknowledge what needs to be solved. Downtime can also be planned, when the equipment needs maintenance, or during lunch breaks and shifts: that way, you can not only optimize it, but also keep it under control by preventing machines out of service, or inventories running out of stocks taking you by surprise.

Performance Indicators

Try to reduce your downtime as much as you can. Monitoring will help you improve processes, boost profitability, and evaluate the effectiveness of your machines.

Relevant Showcase Dashboard
charts breaking down the production costs of a manufacturing company

Production Costs

Monitor the costs implied in the production

The production cost by product specifies how much each component of your product costs and how much it represents for your finished product. Breaking down this manufacturing metric into the various types of costs will tell you which ones are making the biggest part of your unit and can help you if you want to track different expenses that can be optimized. Tracking these expenses over time is a good thing to know how they evolve and if you manage, at the end of the day, to stay under the target price per unit you set in order to make it profitable.

Performance Indicators

Measure the overall costs per unit your business has over a production cycle, and see if that makes you profitable in regard to the sales price you want to set.

Relevant Showcase Dashboard
VISUALIZE AND TRACK YOUR MANUFACTURING KPIS WITH A FEW CLICKS START MY FREE TRIAL NOW
visualization of an important manufacturing KPI: overall operations effectiveness (OOE)

Overall Operations Effectiveness (OOE)

Evaluate the efficiency of your operations

One of the production metrics that include availability in its calculations as well as standard time and off standard time, the overall operations effectiveness (OOE) looks into total operations time as the maximum value. That means that you need to multiply the performance with quality and availability, where availability equals the actual production time divided by the operating time. To have a clearer picture and avoid manual calculations, you can take a look at our visual example and let modern software instantly visualize the progression over time and compare between different periods. That way, you will eliminate the hassles of static spreadsheets and generate instant insights.

Performance Indicators

Track this metric in order to have a clearer picture of how your manufacturing process is running and improvements over time.

Relevant Showcase Dashboard
chart showing overall equipment effectiveness (OEE) of the last 6 months

Overall Equipment Effectiveness (OEE)

Assess the scheduled efficiency of your equipment

If you need to paint a full picture of quality KPIs in manufacturing, you need to include the overall equipment effectiveness (OEE). This metric includes scheduled time only, hence, if the machine is not scheduled or maintenance is performed, the OEE doesn’t include this time. Essentially, the metric combines performance, quality, and availability, the 3 focal points of calculating the OEE, and ensuring that you’re running your manufacturing facility effectively. It would also make sense to use automating features of intelligent software that will notify you as soon as an anomaly occurs. That way, you can immediately spot issues and act accordingly.

Performance Indicators

Use this metric to evaluate the OEE, whether it’s a single piece or the entire manufacture line.

Relevant Showcase Dashboard
total effective equipment performance (TEEP)

Total Effective Equipment Performance (TEEP)

Monitor the overall efficiency of your equipment

In comparison to the OEE that measures the scheduled production time, the total effective equipment performance (TEEP) includes the total hours that are fully productive, meaning 24h/day, 365days/year. Similar to other metrics focused on effectiveness, this production KPI also considers availability, performance, and quality. In a perfect world, the TEEP amounts to 100%, meaning the plant is always running, at optimal speed, and without faulty products. The goal is to increase the percentage as much as possible, and actually identify the untapped potential that your facility is dealing with. That way, you, as a manufacturer, have the possibility to increase production without investing in new equipment.

Performance Indicators

This metric will help you to evaluate how much of the production process you don’t utilize; hence, it makes sense to track it regularly to reassess your strategies.

Relevant Showcase Dashboard
important manufacturing KPI: capacity utilization

Capacity Utilization

Maximize the use of your capacities

How much of the available capacity in your production line you’re using? This is one of the manufacturing efficiency metrics that will answer this important question. Equipment is expensive, the building where your production is located – expensive, machines that are producing your goods – expensive. The point is to maximize the capacity utilization so that your machines work at an ideal cycle time and determine whether you need to scale your production or understand whether you have issues somewhere in the process. Issues can cause monetary losses, and inefficiencies in your capacity management, where every machine and product counts.

Performance Indicators

Maximize your capacities in order to avoid effects on the effectiveness of your industrial machines and facility. Otherwise, you will face monetary losses in the long run.

Relevant Showcase Dashboard
see rich examples of interactive real-time kpis in datapine view our live manufacturing dashboard
visualized throughput for four different machines

Throughput

Measure your production capabilities

Our next example is the throughput. It can be considered one of the most valuable manufacturing metrics as it measures your machines capabilities to produce during a specified period of time and it is calculated by dividing the number of units produced by the total time of production. The throughput is an indicator that makes sense to be monitored in real-time, as any considerable decrease in the number of units being produced can affect the overall process of manufacture. Therefore, any issues need to be tackled before they bring further consequences. An effective way to increase your throughput is to eliminate or reduce machine downtime and ensure you have trained employees in the right positions.

Performance Indicators

Relying on automation technologies can significantly increase your throughput. The highest this indicator, the further you will be from your competitors.

Relevant Showcase Dashboard
gauge charts illustrating the First Pass Yield (FPY) for different machines

First Pass Yield (FPY)

Monitor the quality of your production

Moving on to another product KPI, we have the first pass yield (FPY). Also known as the throughput yield, this metric tracks the quality and development of your production processes. The FPY is calculated by dividing the number of perfect units (with no reworks or defects) by the total number of produced units entering the same process in a specified time. You should keep your FPY as high as possible, as this means that your production processes and machines are reliable and efficient. In time, this will also lead to a decrease in rework expenses and an increase in profitability.

Performance Indicators

Track your first pass yield in real-time to tackle any issues immediately and ensure production efficiency.

Relevant Showcase Dashboard
line chart showing scrap rate over time

Scrap Rate

Track the amount of failed units

Next on our list of most insightful manufacturing KPIs, we have the scrape rate. This straightforward metric tracks the percentage of materials that never become a finished product. It is calculated by dividing the number of scraped units by the total number of produced units, and it tells companies valuable information about the efficiency of their fabrication processes. That said, its definition might vary depending on the company. Some might consider defective units that can’t be repaired as scrap while others can consider leftover raw materials as scrap. Tracking your scrap rate closely can help you produce excellent goods while lowering the waste of materials as well as reducing unnecessary costs.

Performance Indicators

Monitor this metric closely and in real-time as a high scrape rate can cost your company a lot of money in the long run.

Relevant Showcase Dashboard
chart illustrating the defect density for different products over time

Defect Density

Track the damaged items right away

Evaluating defect density is an important task in the manufacturing environment. This is a key indicator that is easy to gauge. The defect density pinpoints the number of defective products divided by the total number of products produced. A manufacturing metric like this one will let you compare the quality of your different products. It is helpful in identifying areas where problems occur and will let you take the measures to what must be rectified. Working with this metric alongside others like the right first time KPI will lead to increased efficiency in your production process and ultimately, avoid useless expenses that’ll save money.

Performance Indicators

Try to keep your defect density as low as possible and compare it to industry benchmarks.

Relevant Showcase Dashboard
charts showing one of the most important manufacturing KPIs: The Rate of Return

Rate of Return

Measure how many items are sent back

Very similar to its retail counterpart, the rate of return evaluates the percentage of products that are sent back to you. Returns are expenses that could be avoided, as they are products that need to be processed all over again. They may come back to you for any kind of reason: defect, wrong packaging, non-compliance, etc. Analyze these reasons in order to tackle the root cause of the problem, and avoid further returns. Doing so will not only save you money but also earn you a better image in the eyes of your clients, which will see you as more reliable. You can also assess which products are more subjected to returns, to polish your analysis.

Performance Indicators

Try to keep the rate of return as low as possible and assess the reasons for these returns for your different products.

Relevant Showcase Dashboard
VISUALIZE AND TRACK YOUR MANUFACTURING KPIS WITH A FEW CLICKS START MY FREE TRIAL NOW
line chart showing on time delivery of the last 6 months

On-time Delivery

Ensure your products are delivered on time

Our list of most prominent manufacturing KPI examples continues with on-time delivery. This is a straightforward metric that shows the percentage of products delivered on time, and the goal should be 100%. The customers are important, and, if they receive your products on time, satisfaction will increase and the relationship will flourish. On a side note, if your employees manage to fulfill 100% of deliveries on time, it would make sense to reward them and keep their motivation strong. Here it would make sense to keep a realistic production schedule, maintain accurate material inventories, and create a culture focused on quality – your customers will, ultimately, be grateful.

Performance Indicators

The higher the percentage, the better chances you have to increase customer satisfaction. Don’t forget to reward your employees as well.

Relevant Showcase Dashboard
data visualization of the manufacturing KPI 'Right First Time'

Right First Time

Measure your production performance

Having to rework a product is costly and reveals certain inefficiency in your supply chain. With this manufacturing metric, you will know how often you are able to produce something without any defect over the whole production process. After measuring your ratio, the important move is to examine where and when the failure happens, find the root cause of this issue and work on it to avoid similar problems in the future. Comparing it to similar time periods over the years is an interesting analysis to do. Setting a target percentage is also a good incentive to perform better.

Performance Indicators

Right first time = (Number of impeccable products / total products) x 100. Once you have evaluated this ratio, set a target you want to exceed.

Relevant Showcase Dashboard
column chart illustrating the manufacturing metric asset turnover

Asset Turnover

Acknowledge your assets in relation to your revenue

The asset turnover is actually more of a financial than a manufacturing KPI. However, it is highly used in many different industries because of the important insights it provides. It represents the value of your business revenue (or sales) relative to the value of your assets. It is a good efficiency indicator when it comes to assessing if your assets are generating value or not, and is all the more important if you evolve in an asset-heavy industry such as the manufacturing industry. It is interesting to compare this ratio, but it can only be done within the same industry – of course, an online retail company will have a really different one.

Performance Indicators

Asset turnover = revenue / total assets. The higher this ratio the better, as it means that you generate more revenue per dollar of asset.

Relevant Showcase Dashboard
VISUALIZE AND TRACK YOUR MANUFACTURING KPIS WITH A FEW CLICKS

Become a data wizard in less than 1 hour!

Email address required
Password required
data visualization of the unit costs

Unit Costs

Track & optimize your units’ costs over time

This manufacturing KPI evaluates the total costs involved in producing one item, including the fixed costs and the variable ones. This unit cost can also be broken down to show all the expenses (labor, warehousing, machines, material, etc.) and analyze what are the major inputs and how much they represent in the total. Note that sometimes, due to volatile energy costs, for instance, they cannot be measured accurately. Showing them with a trend over time helps in analyzing the evolution and see if your organization manages to stay under the target unit costs fixed, so as to have a profitable product.

Performance Indicators

Identify production processes you can optimize to decrease unit costs over time.

Relevant Showcase Dashboard
chart displaying the return on assets

Return on Assets

Track your company’s capacity to generate profit

Return on asset (ROA) is another manufacturing metric borrowed to sales, as the asset turnover. It shows how profitable your business is relative to your overall assets; that is to say that this indicator measures how efficient you are at using assets to generate profit. Since this KPI tells you what earnings were generated from a capital you have invested, this can be also seen as a return on investment (ROI). It is a good indicator of performance because it tackles both the income statement and the assets a company needs to support its business activities.

Performance Indicators

Return on asset = net income / total assets. Once again, the higher this percentage, the better for your company. Benchmark to other businesses in your industry.

Relevant Showcase Dashboard
gauge and line charts showing the important manufacturing metric maintenance costs

Maintenance Costs

Evaluate how much your equipment costs

After assessing your assets, how much they produce, and the revenue you get from them you cannot let them wither, therefore maintenance is required. That’s why measuring this manufacturing KPI is critical to know which machine needs more work than others, where the resources should be focused, and what kind of preventative measures can be implemented to optimize that maintenance for the future. Set a target cost for correct maintenance that leaves enough money aside for other investments, and try to reach it. Compare your preventive and corrective costs, as the latter should be inferior to the former, if done well.

Performance Indicators

Try to optimize maintenance costs over time and adjust your target accordingly.

Relevant Showcase Dashboard
average revenue per employee for this month, last month and YTD

Revenue Per Employee

Measure the success of your workforce

Calculated by dividing the company’s revenue by the current number of employees, this KPI for manufacturing gives a strong signal for evaluating the efficiency and productivity levels – the higher the amount, the greater the productivity. In essence, it shows the success of a manufacturing company and it’s connected to the financial department since it directly includes costs. This KPI in manufacturing is usually monitored by C-level management, as it depicts a clear picture of whether the business is growing or needs additional strategic evaluation and optimization. Keep in mind the revenue will change according to geographies, subsidies, and the level of automation that is incorporated into the plant. Cheaper labor costs mean less automation since more human-based workforce can take over the machines.

Performance Indicators

Ensure your revenue per employee is steadily growing in order to ensure the whole company is on its path to sustainable development.

Relevant Showcase Dashboard
VISUALIZE AND TRACK YOUR MANUFACTURING METRICS WITH A FEW CLICKS START MY FREE TRIAL NOW


VISUALIZE AND TRACK ALL YOUR BUSINESS KPIS IN ONE CENTRAL PLACE

Setup only takes a few minutes. No credit card required!

Email address required
Password required