
KPI Examples for Salesforce
Salesforce Key Performance Indicators and Metrics
✔ See different templates & designs ✔ Find & track the right Salesforce KPIs to close more deals
A Salesforce KPI is a measurable performance metric used to monitor, analyze, and optimize the customer relationship management (CRM), including all relevant sales processes. Among other things, Salesforce metrics help the sales team to prioritize resources and leads.
Salesforce is a SaaS CRM tool that allows businesses to plan and optimize their sales processes as well as their customer relationships in the most efficient way. As with any other management tool, Salesforce provides businesses with valuable sales-based data that can be further utilized in professional salesforce reports. Here we will present you with a list of Salesforce metrics that will guide you through the most critical areas of your customer relations management in order to track, analyze, and optimize your performance with the help of modern dashboard software. By using these KPIs together in a professional Salesforce dashboard you will not only be increasing your revenues, but also your engagement and customer loyalty thanks to optimized strategies based on data and not simple intuition.
Here is the complete list of the most important Salesforce KPIs and metrics, that we will discuss in this article in every detail:
Lead Response Time: How long does the lead processing take?
Follow-Up Contact Rate: Have leads been processed consistently?
Open Pipeline Value: How is the current open pipeline value composed?
Open Pipeline by Product Package: What is the open value by product package?
Pipeline Value Forecast: What is your predicted sales value?
Average Contract Value: What is the Average Contract Value?
Annual Contractual Value: What is the annual value of your contracts?
Average Sales Cycle Length: How long does it take to close a lead?
Sales Activity: What do the sales employees spend their time on?
Outbound-Calls: Which weekdays are the most promising?
Outbound-Calls Contact Rate: Which sales representatives perform best?
Number of Demos: How many calls you have to make for a product demo?
Total Amount of Inbound Leads: How many inbound leads do you receive?
Lead-to-Opportunity Ratio: How valuable is your average lead quality?
Opportunity-to-Win Ratio: How often do you close qualified leads?
Lead Conversion Rate: How many leads are required for one new deal?

Lead Response Time
How long does the lead processing take?Our first Salesforce KPI is the average lead response time. Depending on the type of the lead and the specific scenario, the optimal response time can vary greatly. Whereas, for example, there is no reason to not react as quickly as possible to a request for an offer or a product presentation, this is a controversial topic when downloading a white paper or creating a free trial version of a software. When should I react? Under what circumstances is a telephone contact useful? If you have answered these questions for yourself, you should test different strategies and determine the desired lead response time.
Performance IndicatorsTest the different contact possibilities and various response times and analyze the effects. Then define clear goals for your target lead response time and monitor them on an aggregated basis, and for individual sales representatives.
Relevant Showcase Dashboard
Follow-Up Contact Rate
Have leads been processed consistently?Our second Salesforce metric – follow-up contact rate – shows you the average number of contact attempts per lead made by sales reps. For this metric, it's also difficult to give a general recommendation about how many contact attempts you're going to make after simply annoying potential customers and the likelihood of closing a deal is more or less zero. However, it makes sense to analyze the individual follow-up contact rates more precisely and to determine specific best practices for the sales team. For example, it would be interesting to examine the percentage of contracts concluded after the third contact attempt, or whether a fourth contact attempt makes sense at all.
Performance IndicatorsE-mails and calls are the standard methods for contacting new leads. Try to agree on a uniform strategy within the team in order not to irritate the leads on the one hand, and on the other, to use available human resources as effectively as possible.
Relevant Showcase Dashboard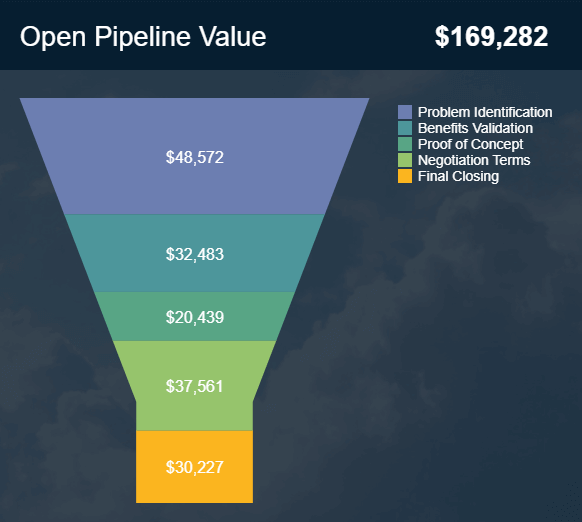
Open Pipeline Value
How is the current open pipeline value composed?Our next Salesforce KPI is the open pipeline value which tracks the current monetary open value of the prospects on each stage of your sales pipeline. The aim of this metric is to give an overview of the actual value of each of your pipeline stages in order to understand if your revenue goals will be met in the expected time. You should make sure to constantly monitor the performance of all stages since each of them plays a fundamental role to achieve your sales goals. For example, if you see that benefits validation stage of your pipeline is underperforming it means you will eventually have trouble in your final stages, therefore you need to immediately take action and work harder to make sure you get more leads into that stage.
Performance IndicatorsThe goal should be to have sufficient leads or open value at all stages at all times.
Relevant Showcase Dashboard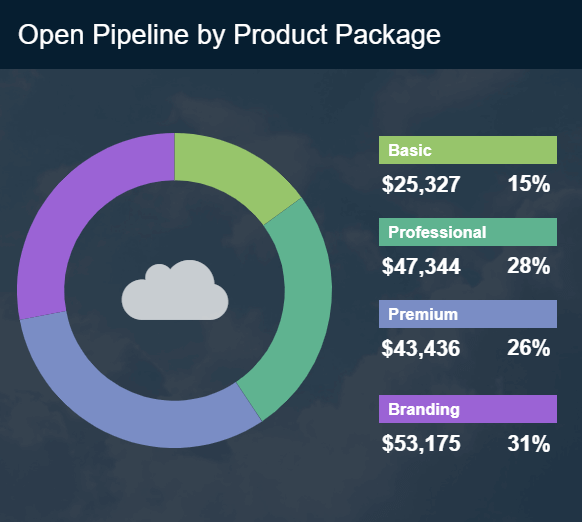
OPEN PIPELINE BY PRODUCT PACKAGE
What is the open pipeline value by product package?This Salesforce KPI is another scenario in which you can track the open pipeline value as it tells you the monetary value of the potential clients for each type of product or service offered by a company. In this example we see that this is a SaaS business that offers different product packages, but it can also be analyzed by product categories, different services, countries, or markets depending on what you are trying to extract from the analysis. This information is useful as it can help you understand where to locate your resources depending on your goals. Is it more convenient to work on closing more small deals or is it better to focus on less but bigger contracts?
Performance IndicatorsTrack this pipeline KPI alongside your open sales pipeline value to understand in which stages and packages you should locate your resources.
Relevant Showcase Dashboard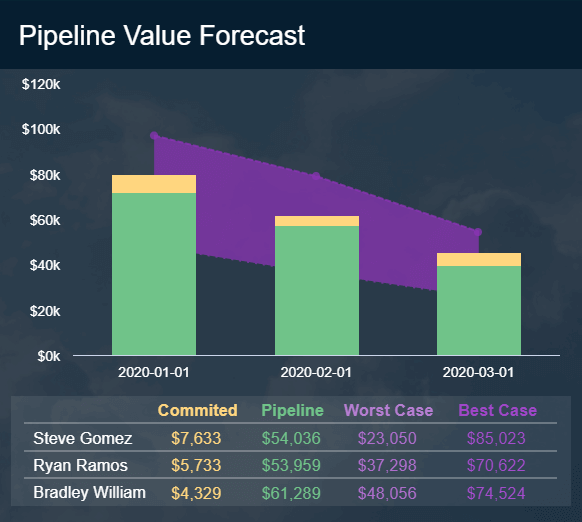
PIPELINE VALUE FORECAST
What is your predicted sales value?The pipeline value forecast is a sales pipeline KPI that provides valuable information regarding the future of your sales as well as the performance of your sales reps. This KPI is calculated by taking historical performance data and using it to forecast the development of your sales in the next months. The predictions also consider your committed deals, which can also be old clients upgrading their contracts, and your pipeline prospects value. This is displayed alongside a best- and worst-case scenario for the performance of each of those months and the performance of each sales representative. By looking at this Salesforce KPI you can understand in advanced if you are going to meet your goals or not. If your forecast predicts an underperformance, you can star immediately planning measures to avoid it.
Performance IndicatorsUse advanced analysis technology such as modern machine learning and AI to predict your pipeline value. This, together with your committed and fixed values, will help you plan your sales activities in the most efficient way.
Relevant Showcase Dashboard
Contract Value
What is the Average Contract Value?Our fourth Salesforce KPI is the average contract value, which is relevant to sales performance in many ways: What is the average contract value of various products or packages? What is the threshold that the average contract value for certain products or services must not exceed in order to cover the costs incurred and generate profit in the long term? Are there significant differences in the average contract value from individual salespeople? Which lead source has the highest average contract value? For which products are there above-average discounts? These are just a few interesting questions that can provide you with valuable insights in order to sustainably increase the average contract value.
Performance IndicatorsEnsure that no products or services from individual sales employees are sold below value by defining clear prices and transparent guidelines for discounts.
Relevant Showcase Dashboard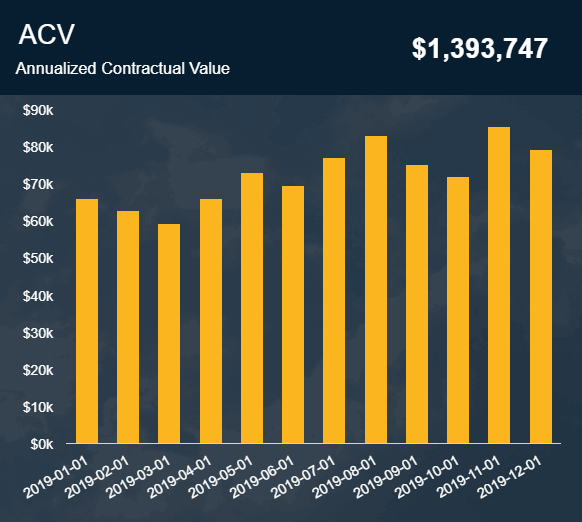
ANNUAL CONTRACTUAL VALUE (ACV)
What is the annual contract value of your contracts?The annualized contract value is one of the sales pipeline metrics that is mostly used in SaaS businesses as it can tell the health of a subscription-based company. To put it simply, the ACV (bookings) tracks the total monetary value of all your contracts in one year. It is important to differentiate the ACV from the ARR (annual recurring revenue) as they include distinct factors in their calculations. While the ACV includes all revenues from a contract such as one-time fees and monthly or yearly fees, the ARR only includes the recurring revenue from the contracts, excluding one-time fees.
Performance IndicatorsBy default, some sales managers define ACV as the average value of your annual contracts, and they call the annual total ACV bookings. However, the average ACV is important to understand how many contracts you need to reach your target annual sales.
Relevant Showcase Dashboard
Sales Cycle Length
How long does it take to close a lead?For each product or service, you should develop an individual sales cycle, one that can usually be divided into 4 to 5 main stages. We have provided you with an example on the right. In order to better understand the average sales cycle length and the individual influencing factors on these, it makes sense to aggregate the length of these main phases on the one hand, and analyze them for individual employees on the other. Maybe you invest too much time and effort in insufficiently qualified leads in the first stages? What influence does the average order value have on the average sales cycle length? What can you learn from the best salespeople who have a significantly shorter sales cycle?
Performance IndicatorsAnalyze all potential influencing parameters on the individual sales cycle phases in more detail, in order to shorten your average sales cycle length in the long run.
Relevant Showcase Dashboard
Sales Activities
What do the sales employees spend their time on?Basically, the main task of a sales employee is to conclude contracts and generate new sales, because, in the end, they are very often remunerated on a performance-related basis. However, it is often unclear what most of the time is spent on. We have shown you a possible distribution of relevant sales activities with our visual KPI example on the right: 31% telephone calls, 25% preparations, 24% e-mails, 16% lead research and 4% other activities. Ultimately, it should be ensured that sales staff spend most of their time on closing deals and sales-related tasks.
Performance IndicatorsEven if tracking all sales activities is tedious, you should analyze the current status of your team in detail. This helps you to identify any ineffective processes or task assignments and to develop solution strategies.
Relevant Showcase Dashboard
Number of Outbound Calls
Which weekdays are the most promising?Our next 3 Salesforce Key Performance Indicators are used to monitor and analyze outbound calls and telephone cold calls. One of the biggest challenges for the sales department in telephone cold calling is to reach new interesting contacts and then arrange the first appointment. Therefore, you should first monitor the number of calls and then analyze the contact rate for the individual weekdays. For instance, in B2B sales it is often the case that the days Tuesday, Wednesday and Thursday are particularly promising. Accordingly, you should make the most outbound calls on these days and take this into account in your daily goal planning.
Performance IndicatorsSet clear quantitative targets for the number of outbound calls to be made on a daily, weekly and monthly basis. Consider potential influencing factors such as the day of the week or the local time.
Relevant Showcase Dashboard
Outbound Calls Contact Rate
Which sales representatives perform best?As already mentioned, the outbound call contact rate can be influenced by numerous factors, such as the respective weekday, the local time, local holidays, the displayed phone number, but of course also by the behavior of the sales employee. We have illustrated this in our visual KPI example: here the average contact rate is 15.1 %, with the lowest contact rate being 13.8 % and the highest contact rate 18.3 %. There are also significant differences in the number of calls made (569 vs. 1156 calls). With the help of interactive business dashboards, you can monitor all aspects of outbound calls, and analyze the underlying causes in case of target deviations.
Performance IndicatorsSet yourself a realistic goal regarding your outbound calls contact rate. However, this can vary greatly depending on the country and product. Discuss best practices with your "most successful" employees throughout the team and then implement them.
Relevant Showcase DashboardBecome a data wizard in less than 1 hour!
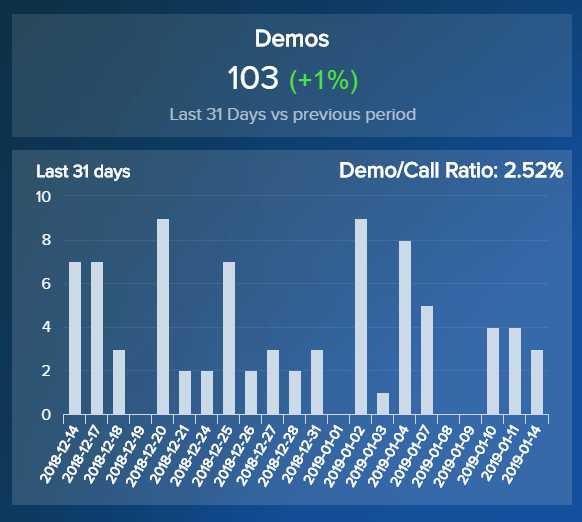
Number of Demos
How many calls you have to make for a demo?Once the sales representatives have reached the desired contact person, they would naturally like to arrange an appointment for a product demo or company presentation. However, you shouldn't expect too much when it comes to cold calling. As a rule, with 100 calls you will at best be able to arrange 2-3 appointments successfully, because first of all, you will be able to reach a maximum of 15 to 20 % of the desired contact partners and then realistically arrange an appointment with about every tenth. Of course, these values can vary slightly depending on the industry and the product or service offered, but it would be absolutely utopian to assume, that you could arrange 30 appointments with 100 outbound calls.
Performance IndicatorsIt makes sense to consider together the last 3 outbound KPIs discussed. For example, it does not make sense to increase the contact rate through questionable measures if this does not result in more demos being arranged.
Relevant Showcase Dashboard
Number of Inbound Leads
How many inbound leads do you receive per day?The following Salesforce metrics focus on inbound lead generation. In business practice, it has been found that inbound leads can often generate high-quality leads at a lower cost. However, to effectively plan your sales team's workload, you first need the average number of inbound leads per day/week/month. However, in the rarest of cases, it makes sense to transfer all inbound leads directly to sales without qualifying them further. More importantly, they have to be transferred to the so-called SQLs (Sales-Qualified-Leads). In this stage, lead-nurturing also plays a significant role, as inbound leads are often at the beginning of the customer journey.
Performance IndicatorsWhen planning resources for inbound lead management, effective communication between the marketing and sales departments is of key importance, as too many or too few inbound leads will ultimately under – or overburden sales.
Relevant Showcase Dashboard
Lead-to-Opportunity Ratio
How valuable is your average lead quality?You can monitor the lead quality of inbound leads using the lead-to-opportunity ratio. This reflects the relationship between SQLs (qualified leads) and all inbound leads received (initially unqualified leads). Of course, this ratio is strongly influenced by the selected lead qualification strategy. As a rule, you should use criteria that are as objective as possible, and develop an automated or even artificially intelligent lead scoring model in the long run to avoid the influence of subjective factors. Many companies still work with the BANT method, which is no longer unquestionable.
Performance IndicatorsTest and compare different lead qualification methods. Avoid subjective criteria in the scoring model so that you can use the lead-to-opportunity ratio to evaluate lead quality in the long run.
Relevant Showcase Dashboard
Opportunity-to-Win Ratio
How often do you close qualified leads?This Salesforce KPI shows how often salespeople successfully close a contract with an already qualified lead (SQL or opportunity). This also reflects the quality of the selected lead qualification. Here, however, it is often a trade-off between a too taut qualification of the leads at the beginning of the funnel – which could lead to the exclusion of some potential customers – and a too loose qualification, which could lead to a lack of prioritization and, possibly, to a waste of valuable human resources. If you use a standardized lead qualification, based on objective criteria, and the opportunity-to-win ratio for individual sales reps is very different, you should analyze the underlying causes.
Performance IndicatorsThe higher the opportunity-to-win ratio, the more effectively salespeople use their existing resources for qualified leads. A very low opportunity-to-win ratio could be due to poor or incorrect lead qualification.
Relevant Showcase Dashboard
Lead Conversion Ratio
How many leads are required for one new deal?The lead conversion rate indicates what percentage of all (unqualified) leads can be converted into paying customers. Of course, this is the main business objective, which is why this figure is also the most important of the last 3 KPIs discussed. But as is well known, many roads lead to Rome and so is the case with the lead conversion rate. Test and analyze different lead qualification methods and different sales measures to increase your lead conversion rate in the long run. Also, compare the approach of individual salespeople, especially if you identify significant differences as in our example.
Performance IndicatorsThe higher the lead conversion rate, the more effective is your overall lead management and, usually, also the quality of incoming leads. You can also use this metric to determine the number of leads you need to achieve your sales goals.
Relevant Showcase Dashboard


Setup only takes a few minutes. No credit card required!