
Top 16 Marketing KPI examples
Marketing Key Performance Indicators and Metrics
✔ See different templates & designs ✔ Find & track the right marketing KPIs to meet your corporate objectives
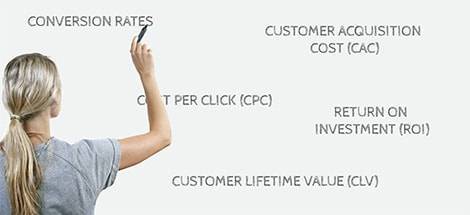
A Marketing KPI (key performance indicator) is a measurable value used by organizations to evaluate the impact of marketing activities while helping professionals to monitor the success of different marketing channels to determine efficient budget spending strategies.
In this article, we will present a detailed overview of the top marketing KPIs, no matter if you’re a junior manager or CMO. Nowadays, the selection of the right metrics to measure the marketing strategy controls the basis of modern performance marketing where analysis, optimization, and monitoring capabilities are in the heart of every profitable and sustainable development. In order to succeed, professionals need tools that will make their processes easier, faster, and more effective. That’s why the industry is turning to marketing BI solutions that optimize processes and improves marketing data management mechanisms. That said, the visualizations below were created with datapine’s modern KPI software that will enable you to answer specific marketing questions and create compelling marketing dashboards in order to increase your performance across the board.
Here is the complete list of the top 16 marketing KPIs and metrics, that every marketer should know:
Cost per Acquisition: Are your customer acquisition costs viable?
Cost per Lead: How much should you spend per lead?
Sales Target & Growth: Is your sales growing and reaching its targets?
Average Order Value: What is the average shopping cart value?
ROI: How efficiently are you spending your marketing dollars?
Customer Lifetime Value: Are new customers profitable in the long-run?
Website-Traffic-to-Lead Ratio: How does your website convert?
Lead-to-MQL Ratio: How does the marketing qualify your generated leads?
MQL-to-SQL Ratio: Which requirements has the sales team for your leads?
Goal Conversion Rate: How well are you hitting your business objectives?
Average Time to Conversion: How fast your visitors convert?
Landing Page Conversion Rate: What pages and content are performing best?
Cost per Click: Are you getting the most bang for your buck?
Bounce Rate: Do your visitors find what they are looking for?
Engagement Rate: How well do users respond to your content?
Click Through Rate: Are your ads and content resulting in attention?
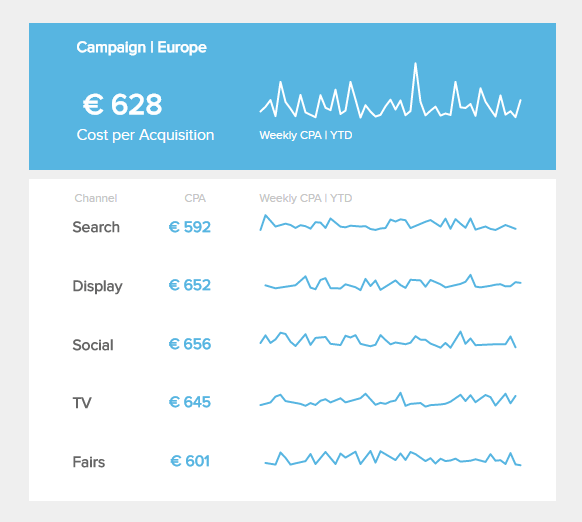
Cost Per Acquisition (CPA)
Are your customer acquisition costs viable?Cost per acquisition is an online advertising pricing model, where advertisers pay a stated price for acquiring a new customer. It is also often used in affiliate marketing and has the advantage of being even more performance-based than the CPC pricing model. This is because you only pay for new customers as opposed to website visitors. CPA is often used to compare the customer acquisition costs (CAC) of the different online marketing channels. To calculate CAC, you divide the total costs of all acquisitions by the number of new customers in a certain time period. With this marketing KPI, you can compare how viable each channel is for acquiring new customers and create comprehensive marketing reports.
Performance IndicatorsCompare your cost per acquisitions through different marketing channels and calculate how much you are willing to spend for one new customer.
Relevant Showcase Dashboard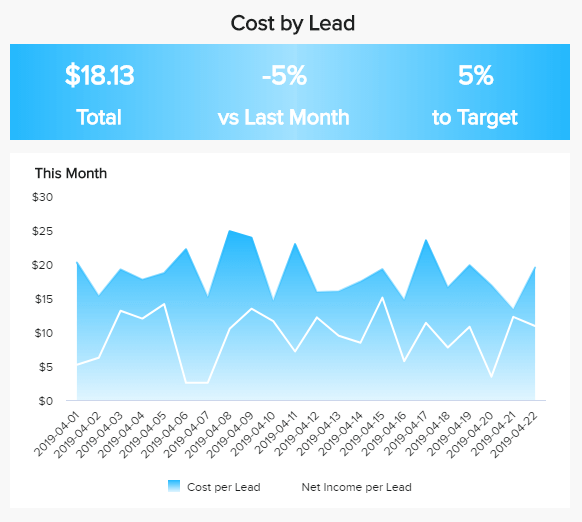
COST PER LEAD (CPL)
How much should you spend per lead?A lead is a potential customer that has interacted with your company through your marketing activities. The cost per lead (CPL) is one of our marketing KPI examples, that is inevitable for efficient performance marketing. It is calculated with the total costs of a specific campaign divided by the number of leads generated. The figure you get helps you to identify where you should focus your marketing efforts since you can compare the CPL for different channels or campaigns. This can be automated by using professional marketing analytics software. It also makes sense to track the CPL over time to see when was the lowest with the biggest revenue or net income – that would mean your strategies at these times were effective.
Performance IndicatorsMake sure you compare the total cost per lead with the net income per lead to be able to identify your most profitable marketing activities.
Relevant Showcase Dashboard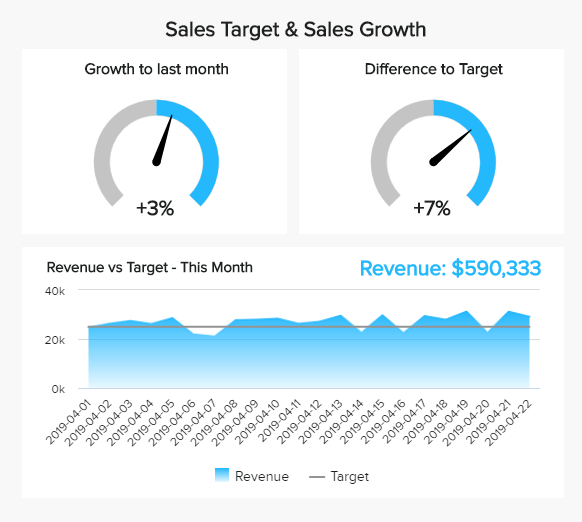
Sales Target & Growth
Do you outperform your sales targets?Sales target and growth is a real high-level marketing KPI that is influenced by the whole business strategy. However, your marketing activities have a major influence on your sales and, therefore, you should set ambitious sales targets and monitor them in detail, because at the end of the day the goal of your marketing activities is to sell more and make the business more successful and profitable, not just gaining more social media followers. Thanks to modern marketing dashboards you can unify your marketing and sales data within one central place of access and increase your overall marketing effectiveness. In our visual marketing KPI template on the right, we show the development of the revenue per day and the gauge charts compare the performance to last months as well as to the set target.
Performance IndicatorsSet realistic sales targets and track them on a monthly basis to ensure stable growth and viable revenue. Compare your results with the previous periods.
Relevant Showcase Dashboard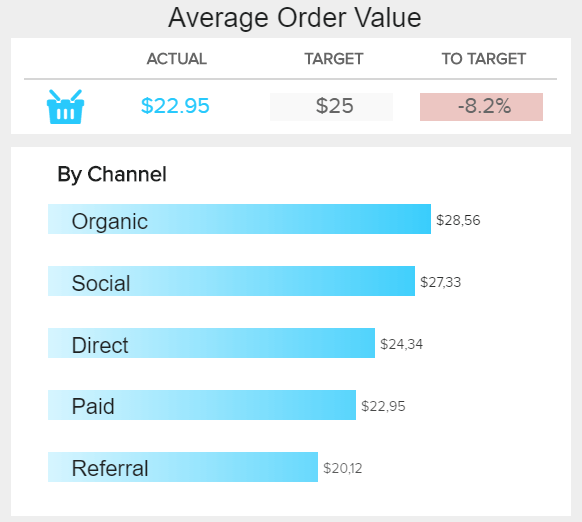
AVERAGE ORDER VALUE
What is the average shopping cart value?This is one of the marketing analytics KPIs important for e-commerce companies. To calculate the average order value (AOV) or the average shopping cart value, you need to divide the total revenue by the number of orders placed. Correspondingly, e-commerce companies are always interested in increasing the average order value, as this will still lead to sales growth with a constant number of orders. There are numerous measures to increase the shopping cart value, for example, placing relevant up- as well as cross-selling offers, optimizing the shipping cost limit, offering vouchers or discounts depending on the value of goods, to name just a few. The average order value can also vary for different marketing channels, which we have illustrated in our visual example.
Performance IndicatorsTest and analyze different methods to increase the average order value, for example the ones mentioned above or dynamic pricing.
Relevant Showcase Dashboard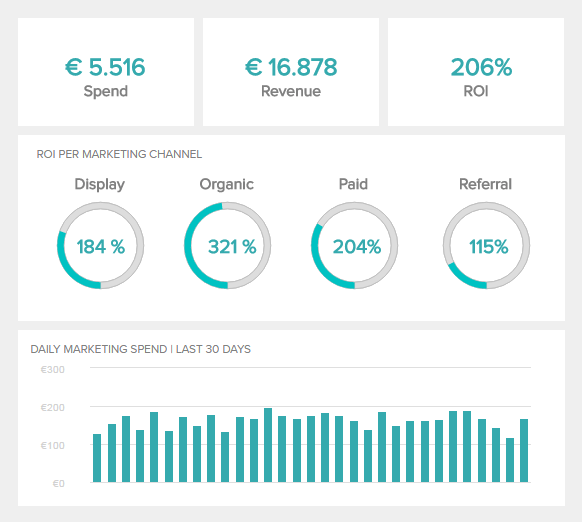
Return on Investment (ROI)
How efficiently are you spending your budget?The return on investment (ROI) is the holy grail of all of our marketing KPI templates listed. It’s most often to compare the efficiency of an investment or to compare many investments. To calculate the ROI, you divide the profit/benefit of the investment by the total costs of the specific investment and display this ratio in a percentage. For example, if you did an e-mail marketing campaign, which cost you 8000$ and you made 10000$ revenue out of this campaign your ROI would 25%. For online marketers, this KPI is especially useful to compare the ROIs of different marketing channels or campaigns to spend their marketing budget on the channels/campaigns, which have the highest ROI.
Performance IndicatorsThe higher the ROI the better. A high ROI displays that you spend your marketing budget effectively. Identify with this marketing metric the worst and best performing online marketing campaigns.
Relevant Showcase Dashboard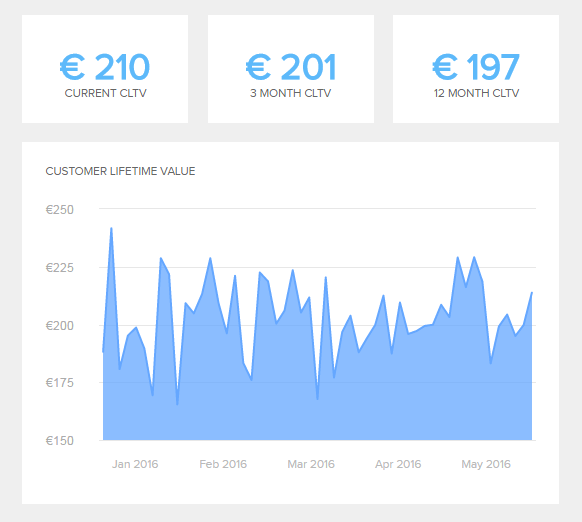
Customer LifeTime Value (CLTV)
Are your new customers profitable in the long-run?The CLTV is one of the most important marketing KPIs, because with this KPI you can control how much money you are willing to spend for a new customer (CPA). You can calculate it by subtracting the cost per acquisition (CPA) from the average revenue per acquisition, which refers to the total amount of money you actually made from one new customer. For example, if you spent on average 80$ for a new customer and they produce on average 130$ of revenue over there whole lifetime, your CLTV or profit per acquisition would be 50$. These marketing metrics are really useful when you compare different marketing campaigns and channels to identify your most profitable online marketing activities and determine where your marketing dollars should go in the future.
Performance IndicatorsThe higher your CLTV the better. It ultimately helps you to identify ineffective marketing activities where you spent more money on a customer than he is worth it.
Relevant Showcase Dashboard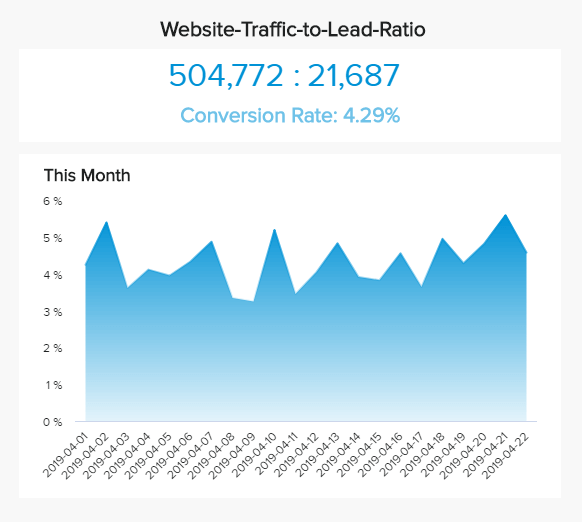
Website-Traffic-to-Lead Ratio
How many of your website visitors convert?This marketing KPI example focuses on the relation of the total amount of website visitors that have turned into actual leads. It is extremely useful when you have to determine the quality of the traffic and especially important in businesses that use their website as a dominant business tool (such as SaaS or e-commerce). To calculate your website-traffic-to-lead ratio, divide the total number of visitors with the number of leads generated in a specific time period. For example, if you had 100000 visitors and gained 5000 leads, your conversion rate will be 5%. The goal is to increase the conversion rate as much as possible but sustain the lowest cost per lead.
Performance IndicatorsIf your conversion rates decrease over time, combine this metric with other KPIs for marketing such as website performance indicators to identify potential bottlenecks.
Relevant Showcase Dashboard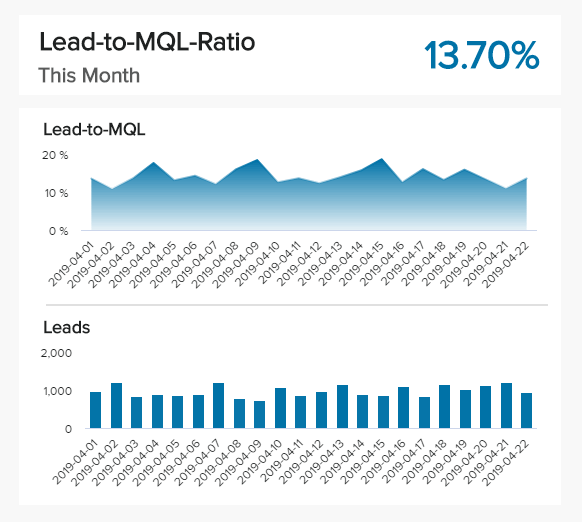
Lead-to-MQL Ratio
How does your marketing qualify leads?The amount of total leads is just the first relevant marketing KPI within your sales funnel. The next step is to look at your lead-to-MQL ratio. Marketing qualified leads (MQLs) are promising contacts, that have a higher possibility to become a customer in comparison to all your incoming (unqualified) leads. But what makes a lead qualified for the marketing department? For a B2B company, this might be a lead that downloads a whitepaper and inserts valid contact information such as a business email address, an existing company, and a valid telephone number. All of this qualifies the lead, as sales are actually able to make contact. The best lead qualification is really dependent on your business model and you should test and analyze diverse ways of qualifying your MQLs.
Performance IndicatorsAllow only certain lead qualification to trigger the MQL status. Monitor and analyze your MQLs over time and determine what kind of prospects convert best.
Relevant Showcase Dashboard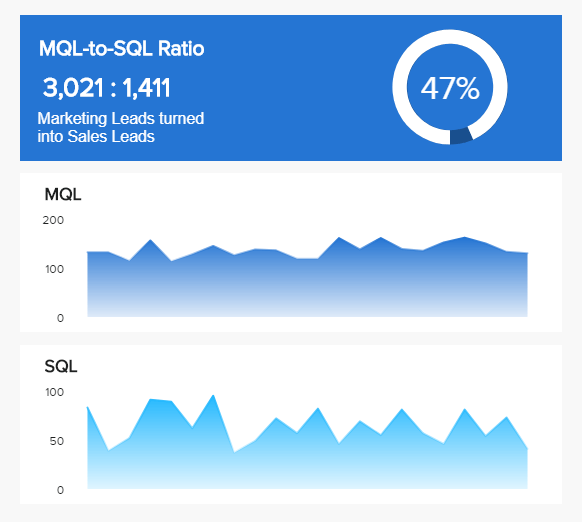
MQL-to-SQL Ratio
Which lead requirements your sales team has?One of the most important marketing KPIs, MQL-to-SQL, connects the marketing and sales departments and requires them to work together. This ratio expresses the percentage of marketing qualified leads (MQLs) that get converted to sales qualified leads (SQLs), which are ready for a sales’ follow up. A SQL is a contact that has developed into a real prospective buyer through its own activities and with the support of lead nurturing of the marketing. It is also important to look at this metric alongside with the average sales cycle length to be able to understand the timeframe necessary to convert MQLs to SQLs. Don't expect it happens always within a few days as different contacts are in various stages of their buying journey.
Performance IndicatorsMonitor and analyze your whole lead funnel in detail to find the best way to qualify your leads to MQLs and SQLs to spend your resources on your most promising leads and increase your sales.
Relevant Showcase Dashboard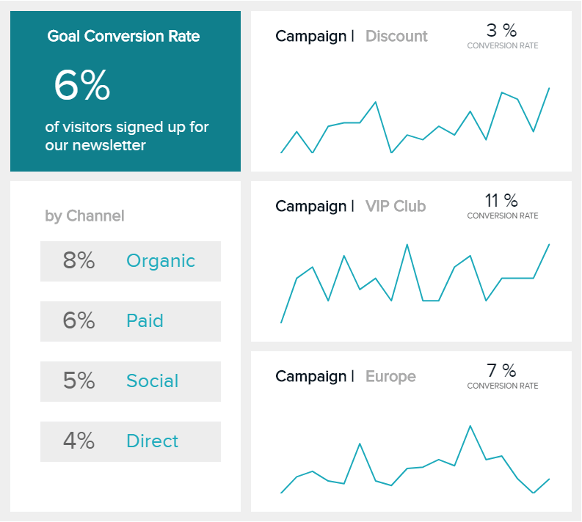
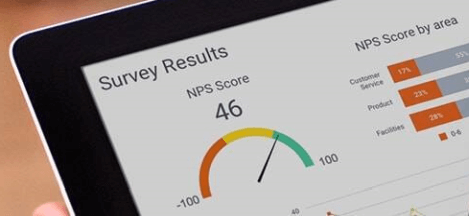
Goal Conversion Rates
How well are you hitting your business objectives?A conversion is a desired action made by a visitor and this varies from business to business. Different parts of your website should have different conversion goals, and this matters when you track how well you are hitting your objectives. One goal of your blog might be to sign up readers to your newsletter, another could be to measure the latest white paper downloads and in turn how this could lead to free trial sign-ups. Start by defining your individual goals, and then begin to track the conversion rate of each channel. Compare conversions to bounce rate to session duration to get an understanding of what works best. High conversion rates usually correlate to lower bounce rates and more pages per session as well as higher average session durations.
Performance IndicatorsDefine specific targets for different conversions and compare these for marketing channels/campaigns to identify the channels with the highest goal conversion rates.
Relevant Showcase Dashboard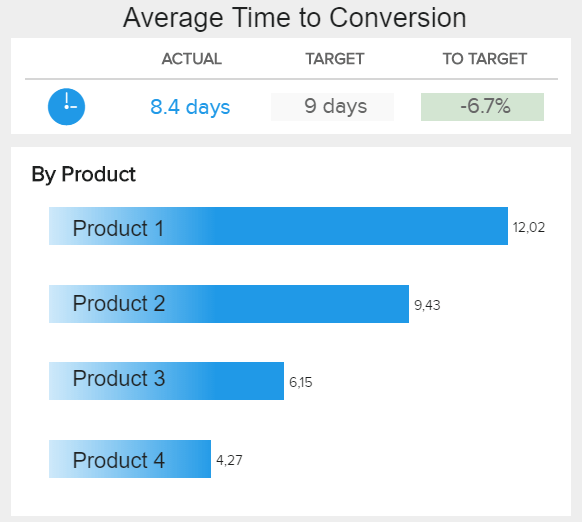
AVERAGE TIME TO CONVERSION
How fast your visitors convert?The average conversion time indicates the time span between the first contact of a visitor and the execution of the target action (conversion). If the target action is a purchase, the conversion time corresponds to the length of the sales cycle. This marketing indicator is particularly valuable in the B2B area, but also for extensive buying decisions in the B2C area, since in contrast to limited, habitual or impulsive purchasing decisions - the involvement of the buyer is very high. As indicated in our visual example, considering various products or marketing channels, for example, can provide valuable new insights.
Performance IndicatorsFirst determine your average conversion time and then look at it for different conversion types, products, marketing channels, and campaigns. The next step is to test different actions to reduce it.
Relevant Showcase Dashboard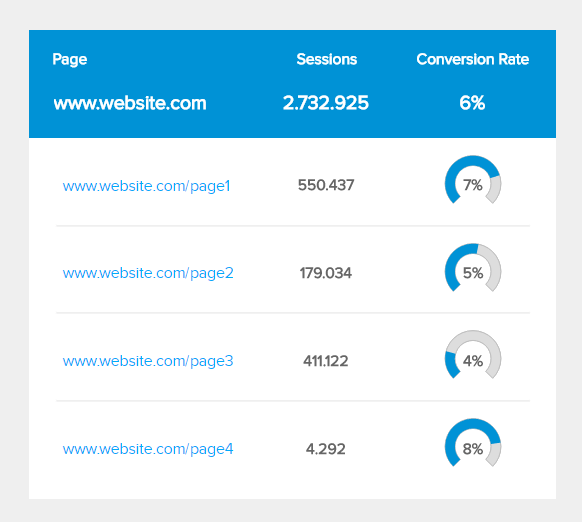
Landing Page Conversion Rates
What pages and content are performing best?It’s critical to know how successful each individual page of your website is, and to replicate that success elsewhere. For instance, are you receiving more sign-ups from your white paper or from your blog? How do the pages look and feel, more importantly, how does the content vary? It makes sense to have a top ten best and worst performing pages report. By tracking this marketing KPI and what works and what doesn’t, you’ll be able to optimize your content strategy. It’s important to mention that this kind of comparison works best when the goals of your pages are the same. In this scenario, you can also A/B test different designs, languages and call-to-actions to make sure you’re getting the highest conversion rates.
Performance IndicatorsCompare similar pages on your site and experiment to find out how you can reach the best conversion rate. Understand the conversion rate of pages with the same goals and be mindful of your industry’s benchmark.
Relevant Showcase DashboardBecome a data wizard in less than 1 hour!
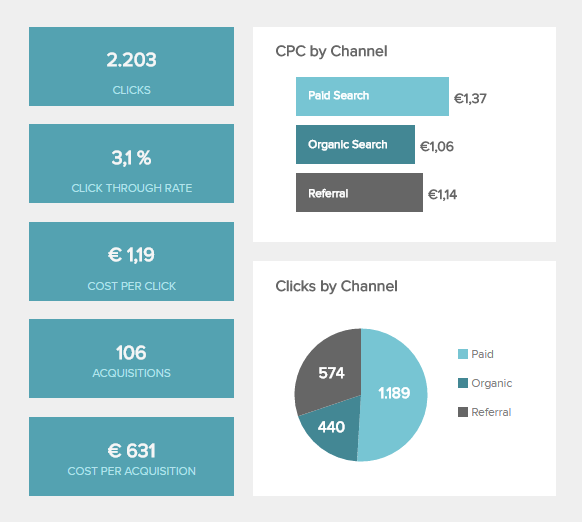
Cost Per Click (CPC)
Are you getting the most bang for your buck?Cost per click (CPC) is the most common pricing model when it comes to online advertising, and is standard with Google AdWords, Yahoo Search Marketing or Yandex Direct. In this model you pay a fixed click price each time someone clicks on your ad. CPC is also common when it comes to affiliate marketing, which is a type of performance-based marketing in which a business rewards affiliates for each visitor or customer brought by the affiliate’s own marketing efforts. CPC is more popular than other models like cost per thousand (CPM), where you pay a fixed price for 1000 impressions, since you aren’t aware of how many clicks will result out from those impressions and therefore the CPC is harder to predict.
Performance IndicatorsCPC is important to track, and the goal should be to decrease the CPC steadily over time, which mostly should result in lower costs for acquisition.
Relevant Showcase Dashboard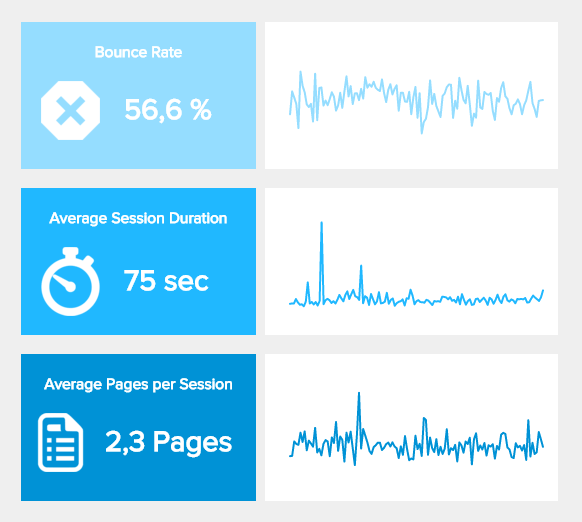
Bounce Rate
Do your visitors find what they are looking for?The bounce rate, average session duration and average pages per session are important marketing KPIs to measure whether your visitors found what they were looking for. What you don’t want is for them to backtrack and click on the back button after arriving on your page. It comes down to if your visitors stay on your site or if they “bounce.” Your bounce rate is the percentage of visitors who leave the site from their entry page without viewing another page. Using the bounce rate and how long visitors stay on average on your website (average session duration), you can understand what your audience is searching for and whether you are providing the right content. An important question to ask, is do your call-to-actions match your content?
Performance IndicatorsIf you understand what drives your visitors to stay on your site, you can improve the “quality” of your website traffic. The goal is to decrease your bounce rate steadily over time while increasing average session duration and pages per session.
Relevant Showcase Dashboard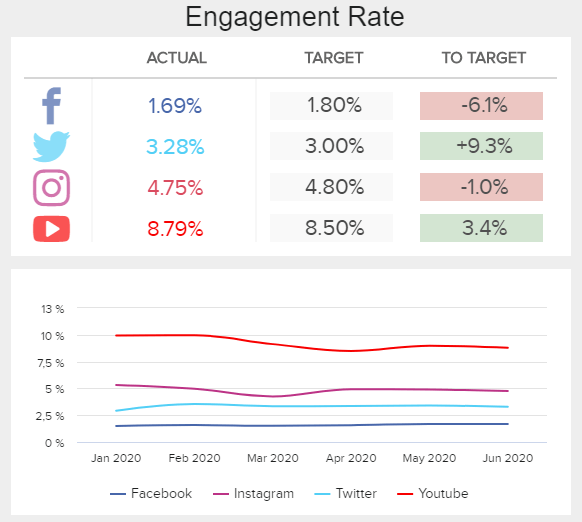
ENGAGEMENT RATE
How well do users respond to your content?The user engagement rate is a key success factor for social media campaigns. In practical analyses, social media platforms and managers often define engagement differently. In essence, engagements include all potentially possible reactions to shared content (like, share, comment, click, etc.). However, since a comment is much more valuable than a like, marketers often weight the engagements in their calculations. To calculate the engagement rate, you divide the number of (weighted) reactions by the number of impressions or views. The goal is to achieve the highest possible engagement rate, as this has a positive effect on the organic reach of the respective posts. Furthermore, the engagement rate is also a crucial factor in influencers’ pricing rates.
Performance IndicatorsThis is one of the marketing campaign KPIs that increases the organic reach for unpaid as well as paid advertising. Test different content types against each other.
Relevant Showcase Dashboard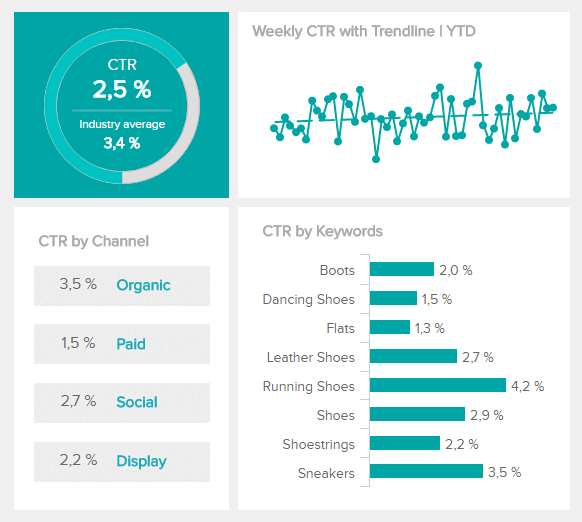
Click Through Rate (CTR)
Are your ads and content resulting in attention?Click through rate (CTR) is the marketing KPI to start with when measuring the success of many different online marketing activities, like Google AdWords, Facebook advertisement or your organic rankings in Google. CTR refers to the ratio of clicks to the total number of impressions (how often your advertisement or content shows up). When it comes to paid advertising, for example on Google AdWords or Facebook, it is important to optimize the CTR as it influences your quality and relevance score, in turn, this impacts your cost per click (CPC). Additionally, the CTR of your organic rankings within the search-engine-result-pages (SERPs) are an important ranking factor as well. CTR is a marker to track the success of your email marketing campaigns, too.
Performance IndicatorsFind the average CTR for your industry and use it as a benchmark. For paid advertising, compare the CTR of different ads for the same keyword phrases and for organic CTR’s compare different titles and meta descriptions to improve your CTR steadily.
Relevant Showcase Dashboard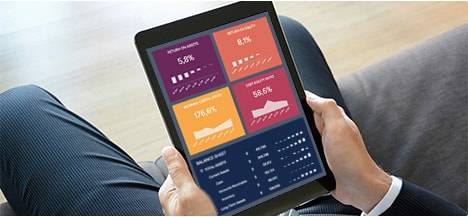


Setup only takes a few minutes. No credit card required!