
Top 20 Sales KPI examples
Sales Key Performance Indicators and Metrics
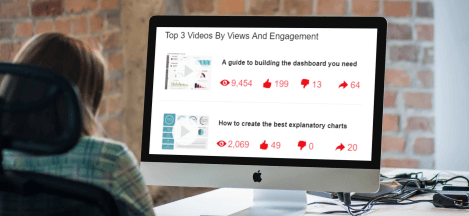
✔ See different templates & designs ✔ Find & track the right sales KPIs to meet your corporate objectives
A Sales KPI or metric is a performance measurement that is used by sales teams and by the top management to track the effectiveness of relevant sales activities within a company. These measures help in optimizing your sales performance, sales funnel and sales cycle length.
In this overview, we will show you the most critical KPI examples for sales that will enable you to manage your sales more effectively and optimize as well as analyze every single sales process in detail. In order to make a complete picture of your sales development and data, we suggest you create a professional sales dashboard that will centralize your KPIs in an interactive form and enable you to dig even deeper. That way, you will be able to control your sales activities, identify potential bottlenecks, and optimize your sales BI processes more effectively. Besides, online reporting software such as datapine will ensure your reports are automated, easily sharable, and deliver up-to-date KPI data.
Here is the complete list of the top 20 sales KPIs and metrics that every sales rep and manager should know:
Sales Growth: Is your business growing steadily?
Sales Target: Are you on track regarding the sales targets?
Customer Acquisition Cost: How much does a new customer cost?
Average Revenue per Unit: What is your average revenue per user?
Customer Lifetime Value: How much do you expect to earn per customer?
Customer Churn Rate: How many customers do you lose?
Average Sales Cycle Length: How do you shorten your sales cycle?
Lead-to-Opportunity Ratio: How about your lead quality?
Opportunity-to-Win Ratio: How many qualified leads result in closing a deal?
Lead Conversion Ratio: Is your conversion ratio stable?
Number of Sales Opportunities: What is your potential purchase volume?
Sales Opportunity Score: Do you prioritize your sales opportunities?
Average Purchase Value: Is your average purchase value sustainable?
Sales Volume by Country: Which are your target countries?
Revenue & Profit per Product: Which are your most profitable products?
Revenue per Sales Rep: How much revenue do your sales rep bring?
Profit Margin per Sales Rep: Is your sales team profitable as expected?
NPS per Sales Rep: Are sales reps offering a good service?
Upsell & Cross-Sell Rates: How do you increase your revenue and ROI?
Incremental Sales by Campaign: Which campaign brings you the best results?
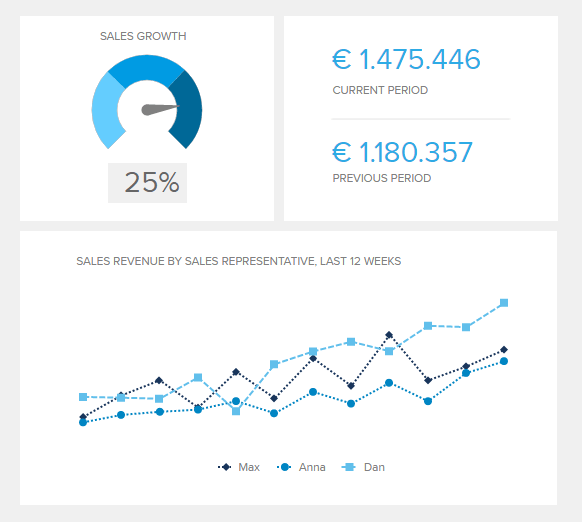
Sales Growth
Is your business growing steadily?It's a fact that by tracking the growth of your sales, you also track the growth of your company. It goes without saying that it's important to be mindful of this sales KPI. Follow the performance of your sales reps, their target industry, and their area through professional KPI dashboards. Let's say your team focuses on many verticals and only one of them proves to bring significant returns. This could be a sign to reassess the vertical distribution in your team. You won't leave money on the table and you'll have higher returns. Be flexible and analyze your sales KPIs, and you'll bring more sales revenue to your business and, consequently, profits.
Performance IndicatorsA positive sales growth over a specific period of time indicates that you are on track with your sales goals to grow your business.
Relevant Showcase Dashboard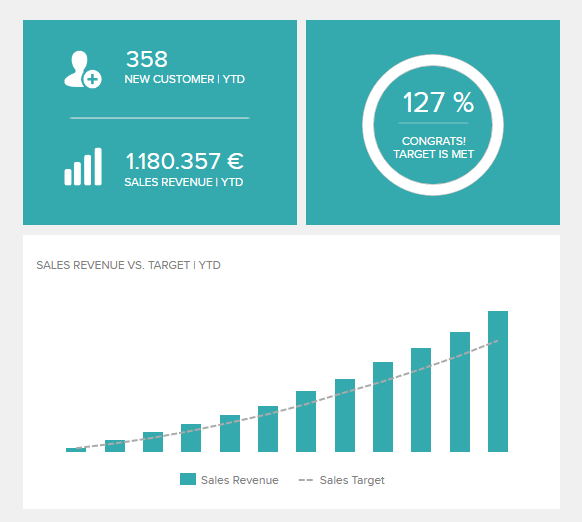
Sales Target
Are you on track regarding the sales targets?One of your top priorities should be to understand if you are on track to reach your planned goals. By implementing automated sales reports, you can answer questions such as: Is your actual revenue better or worse than your forecasted one? When you first planned your goals, what did you base them on? Is your baseline included in your charts? This information will help you expect deal activities, results and, in case inconsistencies arise, you’ll better recognize outliers versus trends. This metric lets you know whether your team is doing what they should, if they need help or if the whole strategy should be changed or adjusted. It's crucial for forecasting, and it lets you know if other factors can impact your bottom line.
Performance IndicatorsIn a good assessment of your actual revenue versus your forecasted one, the goal should be to outperform your forecasted amount.
Relevant Showcase Dashboard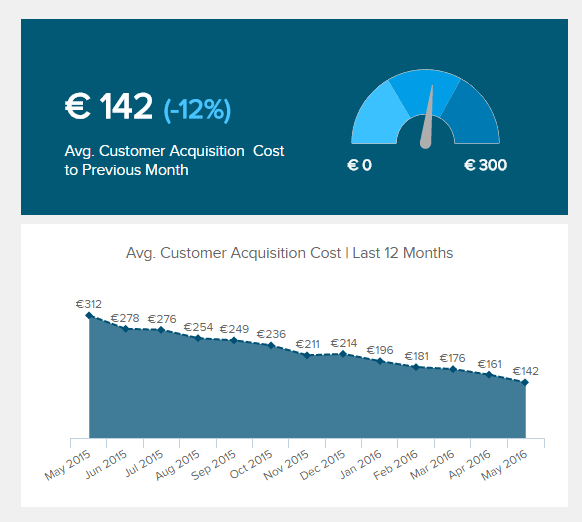
Customer Acquisition Cost
How much does a new customer cost?When we mention customer acquisition cost (CAC), we are referring to all costs incurred in signing up a customer. Different costs are associated depending on your line of business, for instance, if you’re an online marketer, you’ll include the costs of all your campaigns. In a traditional SaaS business, it might mean everything from all your staff’s salaries, to all marketing and sales costs. It is recommended to recover your CAC in less than one year of your customer’s subscription. If this isn’t the case, you’ll burn through all your capital before you can depend on your monthly recurring revenue.
Performance IndicatorsThe goal is to increase customer lifetime value and average revenue per unit or user/account, while cutting CAC, to maintain a profitable business.
Relevant Showcase Dashboard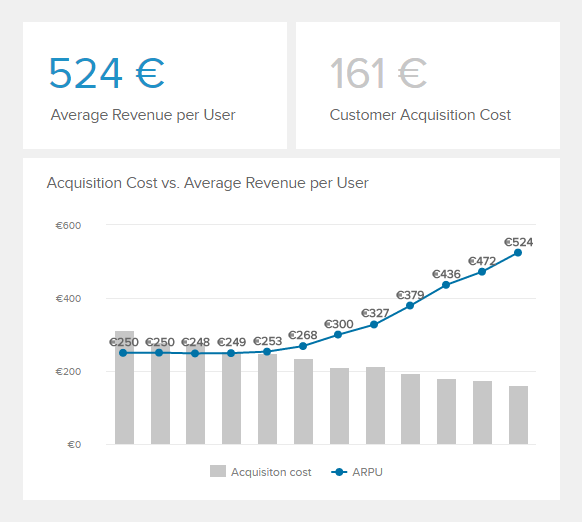
AVERAGE REVENUE PER UNIT (ARPU)
What is your average revenue per user?ARPU stands for average revenue per unit, the unit part of the acronym can also stand for user, account or any other paying customer. This sales KPI indicates the average customer’s revenue from all your sales. It's a simple calculation, you take your total monthly (recurring) revenue and divide it by the total amount of customers you have in your roster. This might seem obvious to some and it’s worth pointing out that if your ARPU is higher in comparison to your acquisition costs, you might run into trouble. Your customer acquisition costs should always be lower, otherwise, you’re not making any profits from your revenues.
Performance IndicatorsIf your ARPU is rising you should be on track. This usually means that you are signing bigger customers, or signing customers with bigger plans.
Relevant Showcase Dashboard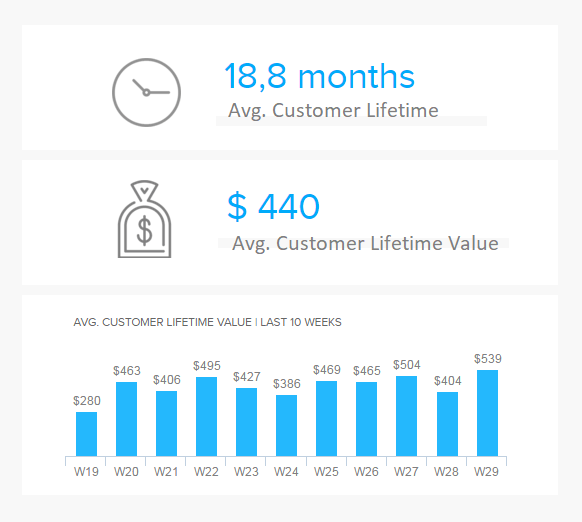
Customer Lifetime Value (CLV)
How much do you expect to earn per customer?Our next sales KPI example refers to your customer lifetime value (CLV) which is important to track because the longer you keep having paying customers, the more you’ll make. To calculate this sales metric, you need to distract your CAC from the total amount of revenue that you expect to get from a new customer over the lifetime of the relationship. If your ARPU and CLV are rising, it signals that on average you are getting more revenue from each customer, for longer and that’s exactly what you should be aiming for. CLV enables you to understand how much you can allow for your CAC to still be profitable; a healthy ratio is key.
Performance IndicatorsAs long as customer lifetime value and ARPU are growing, you’re in the green and your CAC is appropriate.
Relevant Showcase Dashboard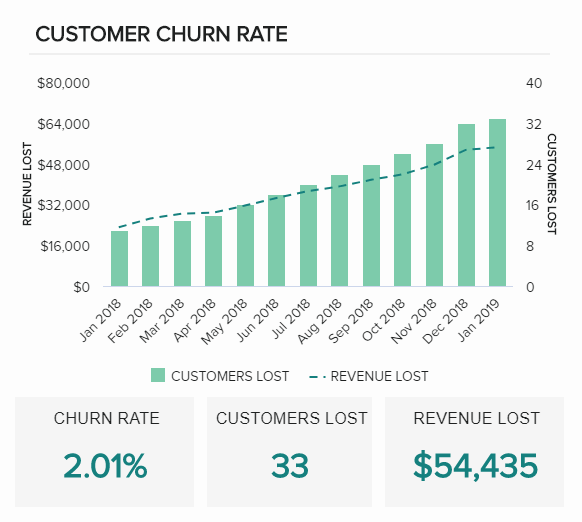
Customer Churn Rate
How many customers do you lose?One of our sales KPI examples is especially important for businesses with monthly recurring revenue such as SaaS businesses. The customer churn rate expresses the number of customers who stopped using your company’s products or services in a defined timeframe and gives you a realistic overview of your customer retention strategies and what kind of trends you cope with. To calculate the exact churn rate, divide the total number of customers you had at the beginning of the month by the total number of customers lost. You can also automate these calculations by using professional software that can trigger alarms if any sales anomalies occur. Your goal should be to keep the churn rate as low as possible.
Performance IndicatorsThe higher the churn rate, the more customers and revenue you will lose. It should be on top of your priorities when it comes to developing retention strategies.
Relevant Showcase Dashboard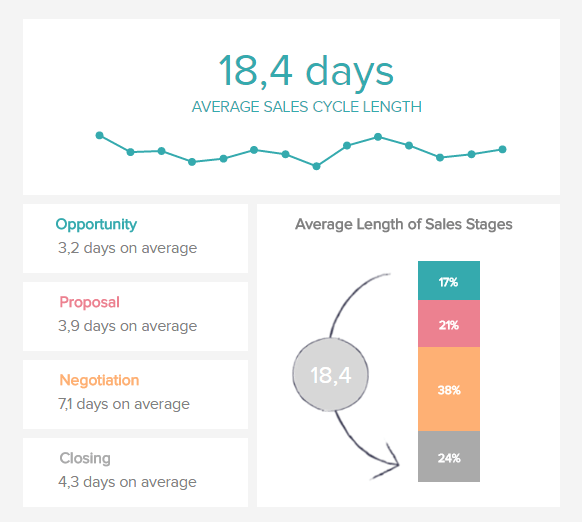
Average Sales Cycle Length
How do you shorten your sales cycle?If it's realistic to shorten your sales cycle in your industry, you first need to understand how you can optimize your current sales cycle. We recommend you analyze the cycles for individual reps at the different stages of the cycle. A quick comparison can show how effective a rep is in comparison to others in your company. The shorter the time each lead spends in each stage of the funnel, the better. This can also serve as a way to track an individual rep’s progress over time. We show this on a sales KPI template that can alert you on when your staff could need extra training and goal setting.
Performance IndicatorsOnce you have a sales cycle length baseline, the goal should be to decrease that number, resulting in more sales in a shorter period of time.
Relevant Showcase Dashboard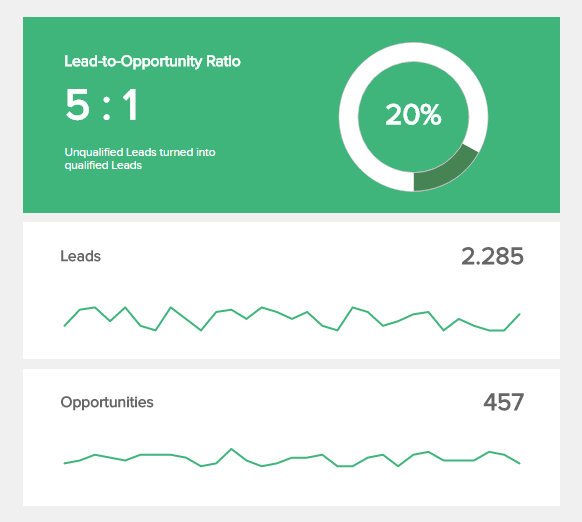
Lead-to-Opportunity Ratio
How about your lead quality?For the most part, every new lead is an unqualified lead at the beginning. Conversely, a qualified lead refers to a lead that meets qualification requirements. Although this varies among sales organizations, a qualified lead is most often an opportunity. A common tactic sales managers use to determine if leads are qualified is the BANT method. It stands for leads with Budget, Authority, Need and Timeline requirements. The goal of this process is to measure if your lead can become a customer. The lead-to-opportunity ratio lets you understand the number of leads you need to stay on track with your revenue goals. Once you’ve established a baseline ratio, you’ll know how many leads you need to create your target growth, and you’ll have revenue that is predictable.
Performance IndicatorsYour lead-to-opportunity ratio is the first part of the sales funnel to be examined. By looking at what is working and what isn’t you have a better idea of where quality leads are sourced from, and can guide the marketing and sales team better.
Relevant Showcase Dashboard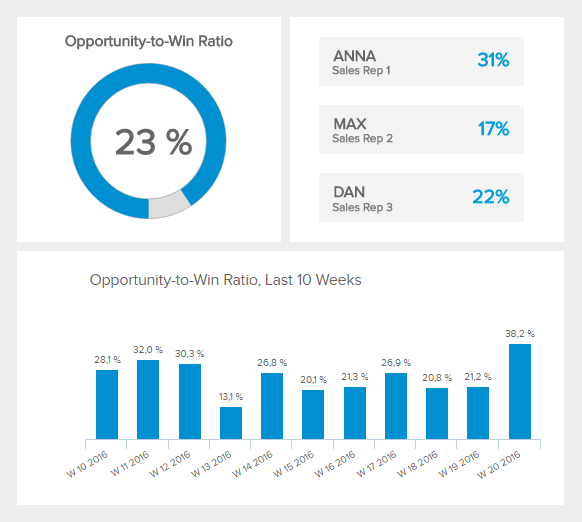
Opportunity-to-Win Ratio
How many qualified leads result in closing a deal?This sales KPI tells us how effectively a sales team or sales manager closes accounts. Whereas tracking leads to opportunities gives you an idea of how interests turn into a discussion, this metric measures how discussions turn into money in your business. Sales reps will refer to this as a win, hence the opportunity to win. Some reps are amazing at sparking a discussion but might lack the right skills and motivation to close accounts. Sales metrics like these can help you identify and train them to close more deals. Looking at each rep’s opportunity-to-win ratio can enable you to identify areas of improvement and act accordingly.
Performance IndicatorsThe closer the ratio of opportunity-to-win, the more effective your salespeople are at the later stage of the pipeline. If your team isn't closing a minimum of 15% of your qualified leads, you might need to rethink your qualifications process.
Relevant Showcase Dashboard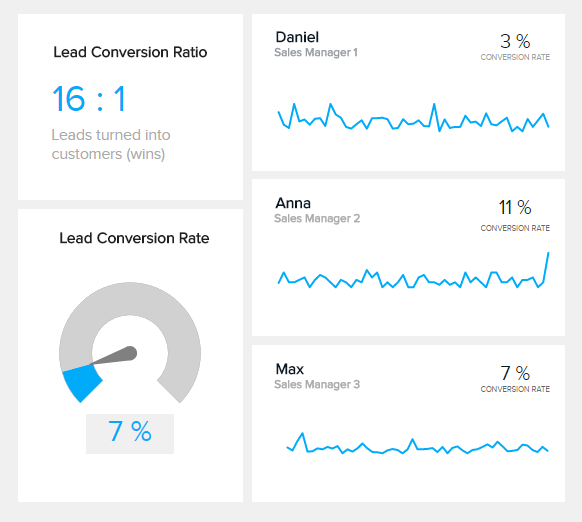
Lead Conversion Ratio
Is your conversion ratio stable?One of the most important KPIs for sales is the magic number, the lead conversion ratio – ostensibly the number of interested people that turn into paying customers. Some businesses have a 1 percent conversion rate and others might even reach 10 percent, and either could be succeeding in their field. Once you have a baseline, you’ll know how many leads you need to convert your current rate of customers. When you understand the ratio of your conversions and your average sales cycle, you'll know how many leads you need to keep your team running full steam. You'll also know how many reps you need at any given point.
Performance IndicatorsIf your lead conversion rate is on target, you know that your sales pipeline is in good shape. A low lead conversion rate alerts you to weaknesses in your sales pipeline. Find benchmarks for your specific industry and use them as a target.
Relevant Showcase DashboardBecome a data wizard in less than 1 hour!
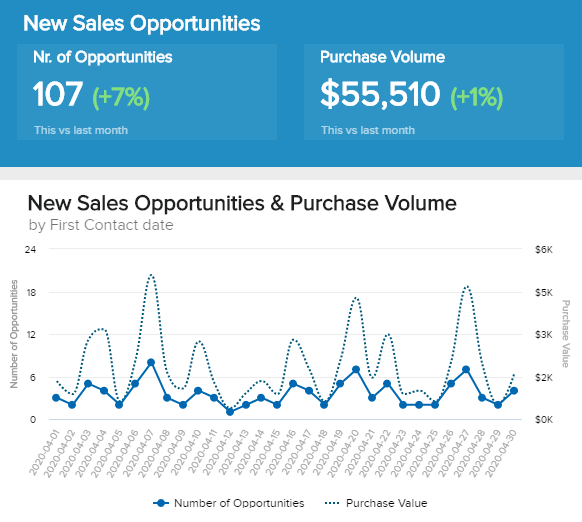
Number of Sales Opportunities
What is your potential purchase volume?The number of current and new sales opportunities plays a decisive role in sales management. To properly optimize and increase the value of your sales metrics, the number of opportunities should be high on your list. While the number of unqualified leads is an important metric in marketing, only valid qualified leads are really critical for sales. For example, leads with incorrect contact information have no real value for sales. In addition to detailed time monitoring of the number of new sales opportunities, e.g. daily, the potential purchase volume of these open opportunities is also an interesting KPI that you can see in our visual example. Furthermore, you will find trend indicators that compare the current performance with the previous month.
Performance IndicatorsMonitor the number of (new) sales opportunities and their potential purchase value. This allows you to identify bottlenecks in your sales funnel at an early stage.
Relevant Showcase Dashboard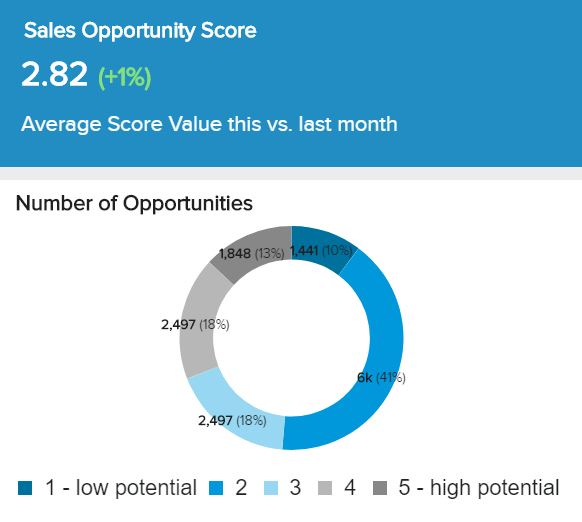
Sales Opportunity Score
Do you prioritize your sales opportunities?First of all, every single sales opportunity needs to meet your minimum lead requirements. However, there are of course still different classifications in terms of potential and actual sales opportunities. This is where scoring models come into play, a KPI for sales that helps you assign a standardized value to your sales opportunities, for example, a value from 1 to 5, as shown in our example. Such a score is used to further prioritize your opportunities in order to make the best use of your sales resources. It ensures that particularly profitable sales opportunities are handled promptly but also with high priority. Modern scoring models can assign the appropriate values based on the most important, underlying influencing factors completely or partially automatically. In practice, this process is still sometimes carried out manually.
Performance IndicatorsAdequate opportunity scoring enables you to achieve your sales targets even in highly competitive markets so this metric should be monitored regularly.
Relevant Showcase Dashboard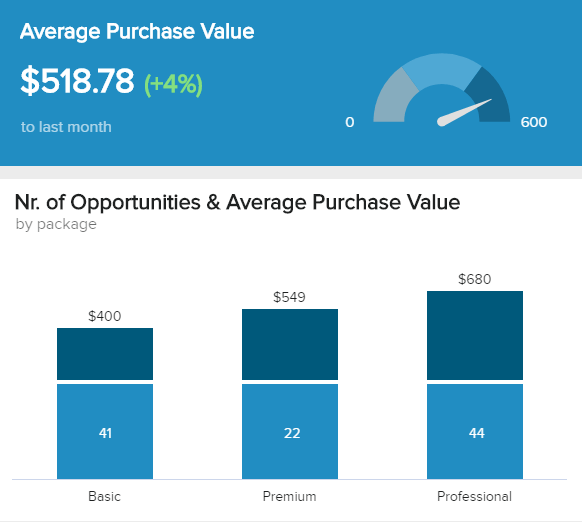
Average Purchase Value
Is your average purchase value sustainable?The average purchase value is one of the sales performance metrics that you can use when developing a sales growth strategy, revenue projections, and forecasting. It shows the average sales value of each transaction and, in our example, you can see 3 different packages or categories: basic, premium, and professional. It’s interesting to compare the average purchase value with the number of opportunities since you can immediately see how they correlate. Besides, this is one of our sales KPI examples that can tell you if you need to offer more incentives to your customers in order to increase your chance to sell higher-end products or services.
Performance IndicatorsCompare your average purchase value with your past performance in order to understand if the metrics increased or not and look into it together with the number of opportunities.
Relevant Showcase Dashboard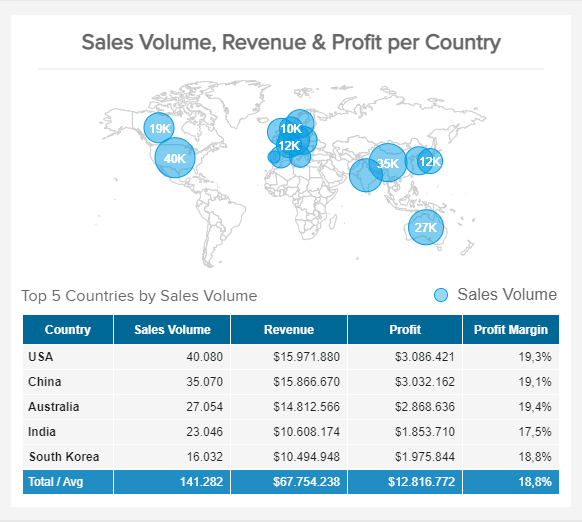
Sales Volume by Country
Which are your target countries?As its name suggests, this straightforward metric tracks the volume of sales per country. This data is complemented with other insights such as the revenue, profit, and profit margin of each region to understand how each of them influences the overall profitability of the business. Naturally, you want to focus your efforts on the countries that are bringing more profit to the business. If you notice an unexpected decrease in sales, you can take a look at the development of each region and spot where the issue is. That said, tracking this indicator can also lead you to spot other countries that you are not targeting and have uncovered potential.
Performance IndicatorsCompare the sales volume per country with the top products sold to understand where to focus your efforts.
Relevant Showcase Dashboard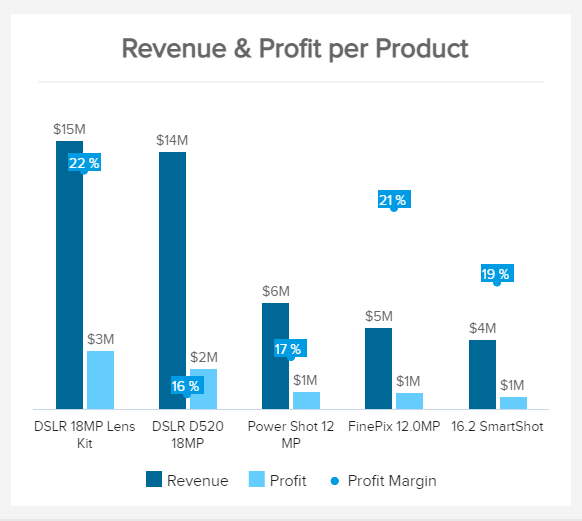
Revenue & Profit by Product
Which are your most profitable products?Another valuable KPI for sales, the revenue and profit by product allows you to assess the development of your products and identify which ones are bringing more profit. Your best-selling items or the ones with the highest revenue are not necessarily the most profitable ones. As seen in the example, the DSLR D520 18MP is the product with the second highest revenue but it is also the one with the lowest profit margin. This could be due to expensive production processes or other cost-related factors. Extracting this type of conclusion can lead c-level executives to make important strategic decisions to increase sales and the overall profitability of the company. These initiatives include allocating marketing and monetary resources to bring more exposure to profitable products or reducing inventory of less profitable items to focus on better-performing ones.
Performance IndicatorsMonitor this indicator regularly to evaluate which products are meeting profitability expectations and which ones are not, and implement strategic measures.
Relevant Showcase Dashboard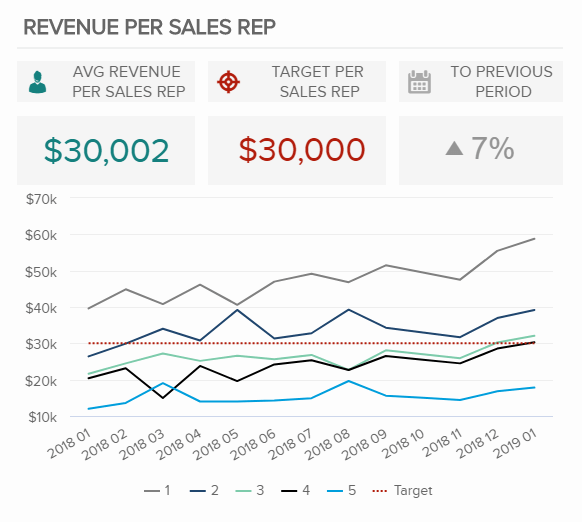
Revenue per Sales Rep
How much revenue do your sales reps bring?KPIs for sales must include stats about sales reps. You need to know how your team is performing and what kind of targets they need to reach, and this sales KPI will help you to do just that. It would be wise to compare these stats with the previous period to get a more detailed overview of your team’s results are growing or not. Set ambitious, but realistic goals. You can then analyze the exact revenue a sales rep is bringing, and depict these results over time. The target line will show you the average which you can adjust based on your overall sales goals.
Performance IndicatorsIdentify which of your sales rep is bringing the best results and compare them with other representatives to be able to improve your team’s performance.
Relevant Showcase Dashboard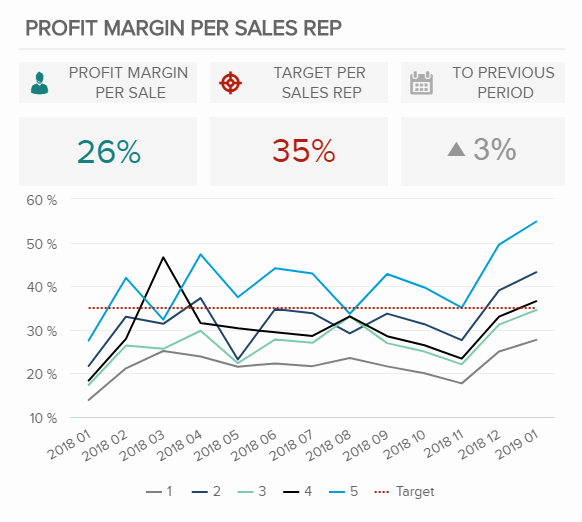
Profit Margin per Sales Rep
Is your sales team profitable as expected?Profit margin is one of the KPIs for sales that expounds on the profitability of the sales reps. This KPI is useful when management needs to determine whether to offer promotions or bonuses for each representative, or to determine the amount of the commission, for example. On the other hand, sales reps can use the margin to identify where to allocate their time and resources to be able to deliver the best possible results. It would make sense to compare the results between representatives and set realistic targets that each can outperform while bringing the best value and buck for the department or company.
Performance IndicatorsCompare your results over time and identify each sales reps’ strengths. See if the targets are met or your sales strategy needs additional adjustments.
Relevant Showcase Dashboard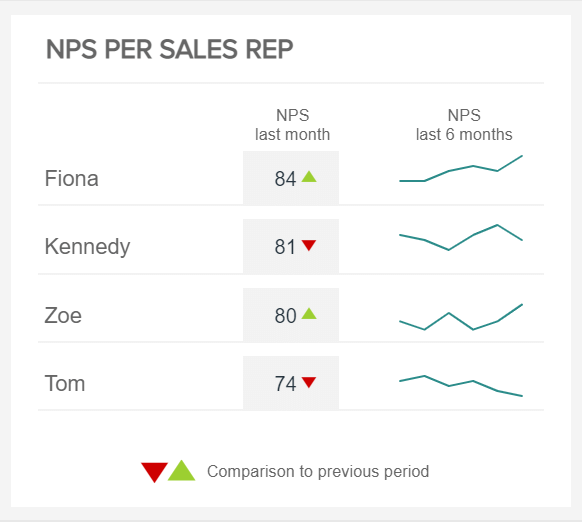
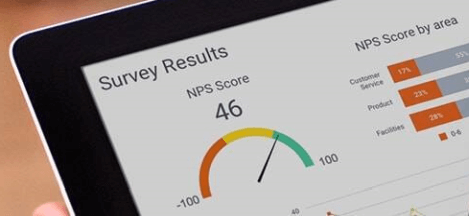
NPS per Sales Rep
Are sales reps offering a good service?The NPS or net promoter score by sales representative is a metric that shows how satisfied your customers are with the service provided by your reps. Naturally, you want to keep this score as high as possible as it not only influences the reputation of your business but also your income. Customers are highly influenced by the way salespeople interact with them at the time of making a purchase, if they answer questions accurately or show a willingness to help, then the probability that the customer ends up buying the product or service is higher. In the example above, we can see that Tom’s NPS has been steadily decreasing for the past 6 months. This is something that you want to monitor, even his NPS is still quite high.
Performance IndicatorsGiving your sales rep incentives to motivate them to do a good job as well as training them on how to treat customers is a great way to keep a high NPS.
Relevant Showcase Dashboard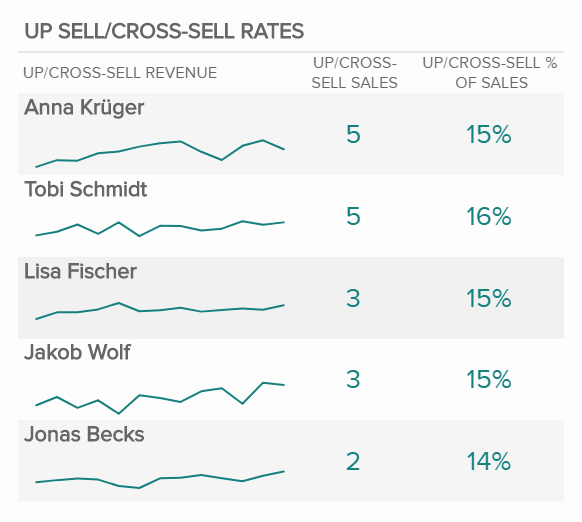
Upsell & Cross-Sell Rates
How do you increase your revenue and ROI?By implementing effective upselling and cross-selling tactics in your sales department, you stand a greater chance to increase your return on investment (ROI) and revenue in the long-run. It is far easier and cheaper to sell and, therefore, generate more revenue from existing clients and customers, than to acquire new ones. With upselling tactics, you encourage your customer to buy a more expensive upgrade or package of your product or service while cross-selling concentrates on purchasing an additional related product or service, for example. It also improves your customer service since your relevant suggestions for additional products and/or services can increase customer loyalty and customer satisfaction, too.
Performance IndicatorsCompare your upselling and cross-selling rates by the sales reps and see which one of them is the most successful. Implement their tactics to the whole sales department.
Relevant Showcase Dashboard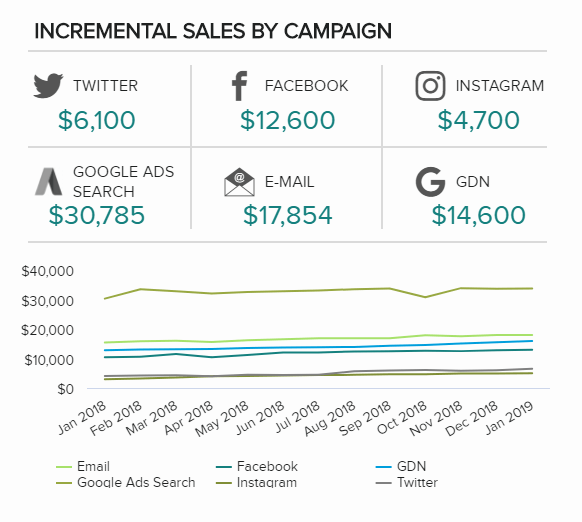
Incremental Sales by Campaign
Which campaign brings you the best results?Incremental sales by a campaign is another important metric as it shows the number of sales generated by each marketing activity you have performed, whether through social media or e-mail. You can calculate your incremental sales by subtracting your baseline sales from your new sales generated. That means if you have your current sales of 75000$, and new sales of 95000$, your incremental sales will be a total of 20000$, resulting in your marketing campaigns. If you track this sales KPI on a regular basis, you will be able to determine which campaigns bring you the best possible results and develop further strategies with these new facts.
Performance IndicatorsIdentify your best campaigns that have brought to you the highest number of incremental sales, and monitor the results over time.
Relevant Showcase Dashboard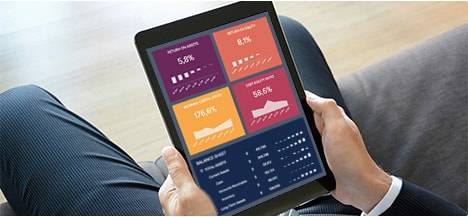


Setup only takes a few minutes. No credit card required!