
KPIs for Customer Service managers
Customer Service Key Performance Indicators and Metrics
✔ See different templates & designs ✔ Track the right support KPIs for a great customer experience
A customer service KPI or metric is a performance measurement that is used by customer service teams and by the customer support management to monitor, visualize, analyze and optimize customer relations by taking advantage of an advanced 360-degree customer view.
In this article, you will find a detailed rundown of the essential customer service KPIs, critical for agents, managers, and leaders in companies that deal with customers on a daily basis. By effectively utilizing these metrics, and creating a professional customer service KPI dashboard, you will have the opportunity to improve your productivity, monitor vast amounts of data easily, and create efficient processes across the board. With the help of customer analytics software, you will find all important information on a single screen, and get ready to tackle basic and deep analysis of vital customer information and create an interactive and comprehensive customer service report.
Here is the complete list of the top 18 customer service KPIs and metrics that modern professionals need to know:
Average Response Time: Measure the time your customers are on hold
First Call Resolution: Avoid customers calling back for the same issue
Average Resolution Time: Monitor the time it takes to solve an issue
Cost Per Resolution: Track the costs of solving issues
Customer Churn: Ensure your customers keep doing business with you
Top Support Agents: Find out who is your star agent in the team
Number of Issues: Monitor the number and nature of issues over time
Total & Solved Tickets By Channel: Keep track of ticket’s status
Abandon Rate: Learn how many customers leave without a solution
Customer Satisfaction: Get insights on what your clients' think about you
Net Promoter Score: Evaluate the power of your referrals
Customer Effort Score: Get valuable feedback on the customer experience
Customer Retention: Evaluate how many customers are coming back
Net Retention Rate: Calculate how much business growth you generate
Service Level: See if you deliver the services as you committed to
Support Costs vs Revenue: Monitor support costs in percentage of revenue
Revenue Churn: Track how much revenue you’ve lost from existing customers
MRR Growth Rate: Keep an eye on your recurring revenue at all times
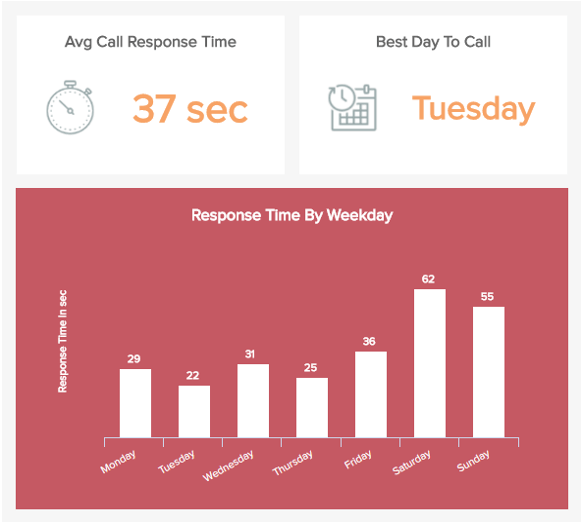
Average Response Time
Measure the time your customers are on holdThe average response time measures the time between the moment a customer calls and the moment an agent responds to it. This is an important one among the various KPIs for customer service to consider when evaluating your capabilities, as it is a main factor of complaints by customers. By responding quickly enough to your customers, you can respect their time and give them a good impression of your brand – which is important as when they call, it is likely that they already have a problem. Keep in mind that in general, a third of callers hang up after one minute on hold, and two third have quit the line after three minutes: these missed calls have a price, both financial and in terms of image and reputation.
Performance IndicatorsTo keep the response time as low as possible, you must have enough agents available for your predicted demand: tracking the number of daily, weekly or monthly calls are other support metrics to measure.
Relevant Showcase Dashboard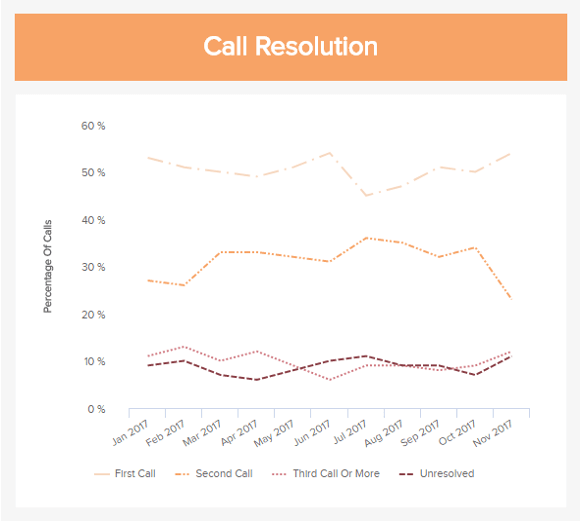
First Call Resolution (FCR)
Avoid customers calling back for the same issueThe first call resolution rate is one of the most important customer service performance metrics to track. It measures the efficiency of your team to resolve an issue on the first call. It is an indicator used to know how good your agents are at understanding and addressing a problem without needing to transfer or return the call. There are several ways to optimize this customer service KPI, starting with training your agents in their communication skills. Providing them scripts and customer surveys, and putting a clear process in place are also best practices you should consider if you want to increase your first call resolution rate. Implementing a knowledge base gathering all the customers’ issues and how they got addressed is also a good thing to do in the long run. Even if that requires a little bit of time to write, you will be rewarded with plenty of time saved in the future.
Performance IndicatorsA good FCR rate will probably increase the average handle time (AHT), but it shouldn’t be an issue – in the end, a long customer interaction that achieves FCR means lower AHT than multiple contacts with a frustrated customer.
Relevant Showcase Dashboard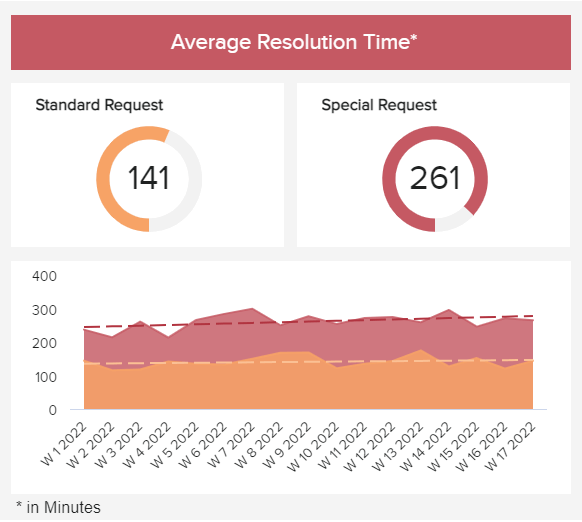
Average Resolution Time
Monitor the time it takes to solve an issueFollowing on the same line as the previous example, the average resolution time tracks the minutes it takes your agents to solve an issue. In this case, it is divided by standard and special requests and tracked on a weekly basis. It is a valuable practice to monitor these two separately as standard requests usually take less time to be resolved than special ones. This is due to the fact that businesses usually have processes in place for common customer issues. The graph also includes trend lines for both types of requests so you can easily understand when a value is higher than it is supposed to be and can dig deeper into the reasons.
Performance IndicatorsDig deeper into weeks with high resolution times and identify roadblocks such as a lack of agent training or not enough staff to cover demand.
Relevant Showcase Dashboard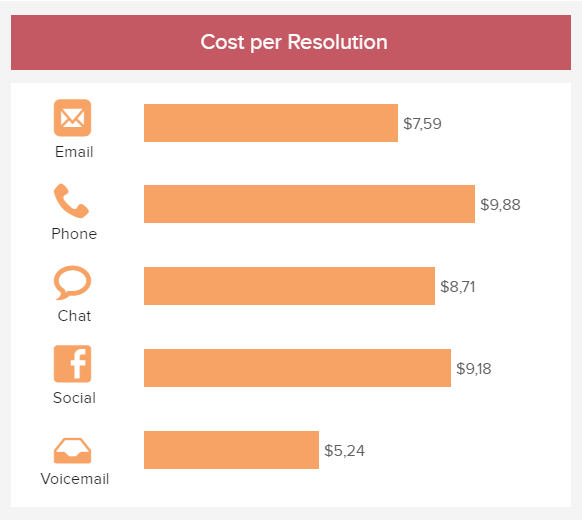
Cost per Resolution
Track the costs of solving customer’s issuesAs its name suggests, this customer service KPI tracks the costs of resolving an issue by different communication channels. Calculations of this indicator can include a variety of factors such as employee wages, license fees for software, equipment and technology expenses, and agent’s training just to name a few. While most of the examples on this list are conditioned by the quality of service provided by the team, this indicator is more straightforward and can help you make the most out of the resources you have available. An ideal situation would be to have low costs and high satisfaction rates for all your communication channels; however, this is not always the case. Monitoring this measurement closely can help you paint an accurate picture of your situation and find improvement opportunities to ensure you remain profitable.
Performance IndicatorsCompare this KPI to others such as the agent utilization or the ticket handle time to extract deeper conclusions about costs and how to lower them.
Relevant Showcase Dashboard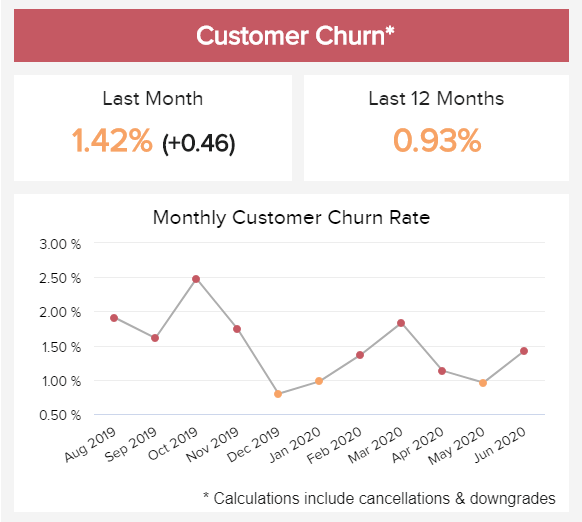
CUSTOMER CHURN
Ensure you retain your customersCustomer churn or attrition is one of the most important customer service KPIs and needs continuous attention and meticulous analysis since you need to evaluate the reasons why customers stopped using your product or service, especially in SaaS businesses. The goal is to keep the churn rate minimal, but it happens in every company so you don’t need to panic immediately. In our example, we have visualized the monthly customer churn rate over the course of almost a year and, in this case, calculations include cancellations and downgrades. You can instantaneously spot which months performed best and which ones encountered issues. We can see that October is showing particularly higher churn rates and this information enables us to dig deeper and discover why.
Performance IndicatorsMonitor the customer churn over time and see what causes higher rates in order to improve the results in the future.
Relevant Showcase Dashboard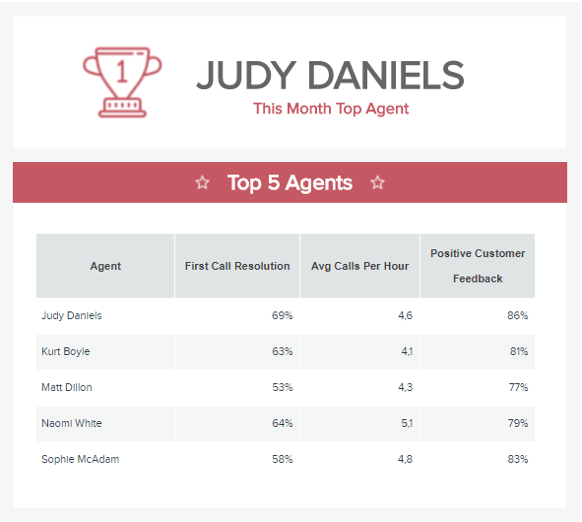
Top Support Agents
Find out who is your star agent on the teamAssessing the progress of your agents is important to know how they are working. You can review various customer service metrics to evaluate their productivity and success like their first call resolution rate, the average number of calls they handle in one hour, and a customer satisfaction survey on the quality of their support. That will help you know who might be the most capable to become a manager and who might need more training. However, when it comes to quality metrics, there is a lot of randomness and variance. That said, be careful not to jump to conclusions: an agent can get unlucky and will have to deal with a lot of irritated customers who might be upset for unrelated reasons, but still rate the agent negatively. It happens, hence, you need to prepare yourself.
Performance IndicatorsBefore taking any decision, track these support metrics over several months. A few days are too short to have an accurate ranking.
Relevant Showcase Dashboard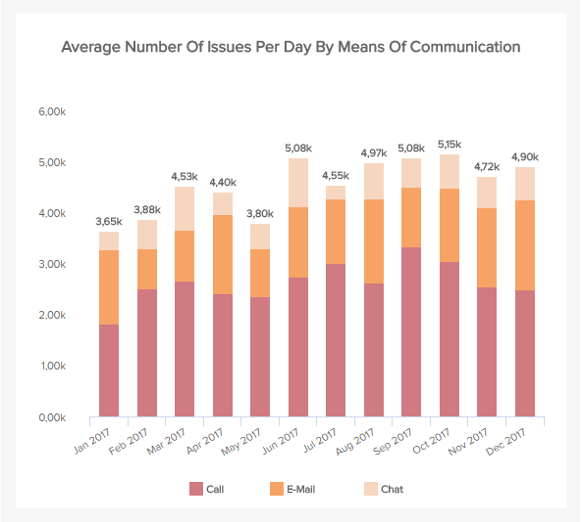
Number of Issues
Monitor the number and nature of issues over timeIn order to know your staffing needs and plan ahead, it is a good thing to measure the volume of calls, requests, and issues your service team receives over time. That way you are aware of the rush periods when your service team might be overwhelmed and you can adjust the staff, avoiding at the same time having stressed employees and unsatisfied customers that have to be on hold for too long. By breaking down this customer service KPI into the different communication channels, you have a better idea of how your customers like to reach you and which ones are the most popular: you know where to assign a bigger number of agents.
Performance IndicatorsNo matter how great your company is, it is still bound to have issues. If you are able to solve them quickly and in a satisfying manner, it is a sign of good service.
Relevant Showcase Dashboard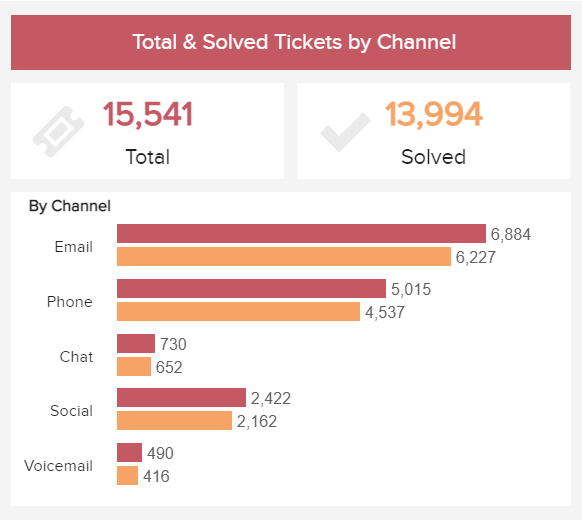
Total & Solved Tickets By Channel
Keep track of tickets statusFollowing in the same line as the number of issues, the total and solved tickets by channel help you extract deeper conclusions about customer preferences and agents’ capacity. Once you have the total number of tickets you are receiving, it is only natural to compare it with the solved ones as this will help you understand the efficiency of your support processes. If you are constantly receiving more issues than the ones you are able to solve, then it means you need to dig deeper into the reasons. Does your staff need more training? Do you need to hire more agents to cover demand? Is a particular channel having issues?
Performance IndicatorsTracking this metric on a weekly basis and for the different communication channels will help you stay on top of any issues or anomalies as soon as they occur.
Relevant Showcase Dashboard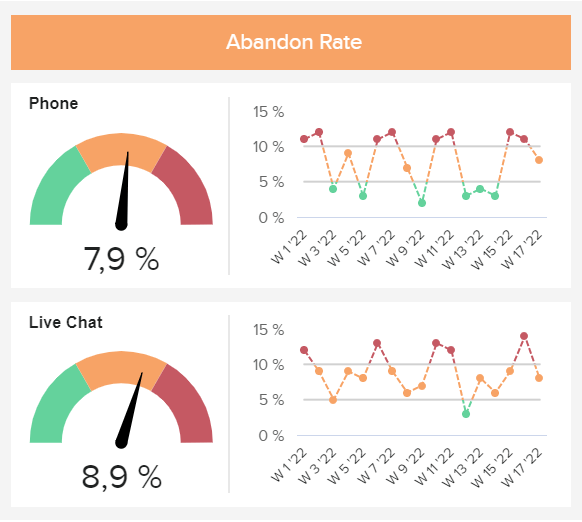
Abandon Rate
Learn how many customers leave without a solutionAs its name suggests, the abandon rate tracks the percentage of clients that leave a call or other form of communication before they can speak to an agent. This KPI can be used to measure the ability of the support department in answering requests in due time. If your company has a high abandonment rate, it can mean long queue times or complicated entry processes, which can lead to poor customer satisfaction rates in the long run. To avoid this, you can track this rate on a weekly basis and dig deeper into the weeks where it was higher. This way, you will be able to spot inefficiencies and stop them on the spot.
Performance IndicatorsA healthy abandonment rate is anything between 2 and 5%. Monitor this KPI closely for your different support channels to keep it from going up.
Relevant Showcase Dashboard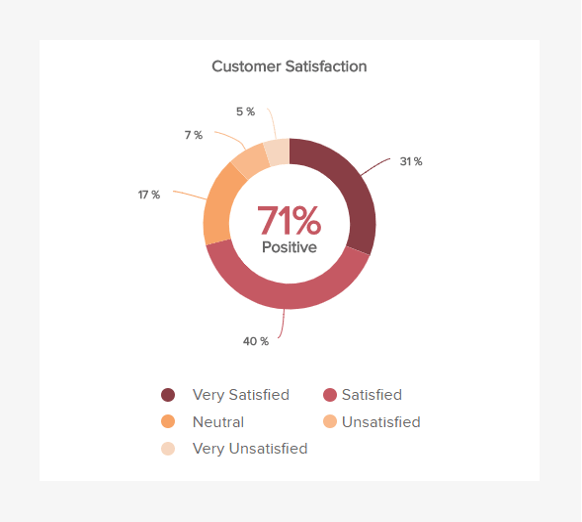
Customer Satisfaction
Get insights on what your clients' think about youThe most important of all the customer service performance metrics is naturally what every organization aims at: a satisfied customer. It is important track this customer satisfaction KPI as you might not be aware of certain problems your customer base is facing repeatedly, and that may give them a bad impression of your services – and we well know that a happy customer recommends you on average to three friends, while an unhappy customer tells Google. To avoid being on the front page with the lowest star-rating, regularly conduct satisfaction surveys: at the end of a call, via email, or directly on your app… There are a lot of ways to ask and measure how customers feel about your brand and services, and one of them is with the help of the customer satisfaction score.
Performance IndicatorsThe higher this score, the better of course. Implementing a writing-box can also be a good way to receive qualitative feedback that helps you know what is working.
Relevant Showcase Dashboard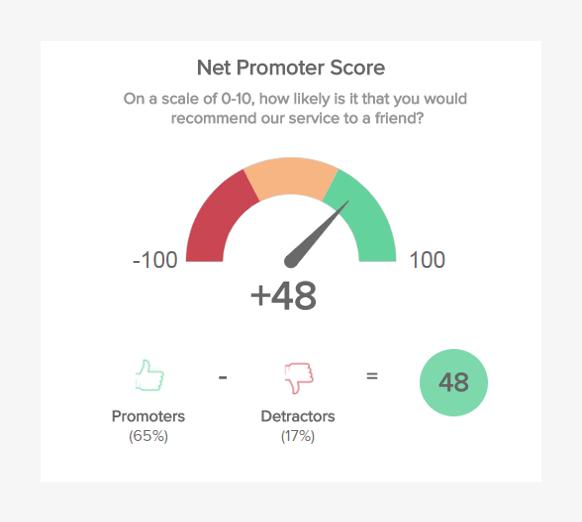
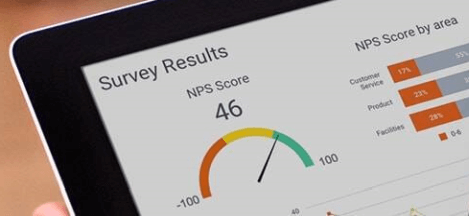
Net Promoter Score (NPS)
Evaluate the power of your referralsCustomer KPIs also include inquiries such as how likely are you to recommend us to a friend or colleague? This is the one question you should ask your customers in order to measure your NPS. Put the responses in three groups: 0-6 are detractors, 7-8 are passives and 9-10 are promoters. Then, calculate the following equation: NPS = % of promoters - % of detractors. Finally, compare your NPS to one of your competitors – if they are much higher, you should figure out how you could improve your services, but if they are lower, you are doing fine. Find a comparison scale specific to your sector or industry to see how you rank. Use the data you have to understand where you are failing or succeeding and try to improve your services thanks to the feedback you earned with your customer satisfaction survey.
Performance IndicatorsThe NPS isn’t just a good loyalty metric, it is also correlated with increased business growth: don’t miss that opportunity to drive your company up. Apple is an international benchmark with an NPS of 75.
Relevant Showcase Dashboard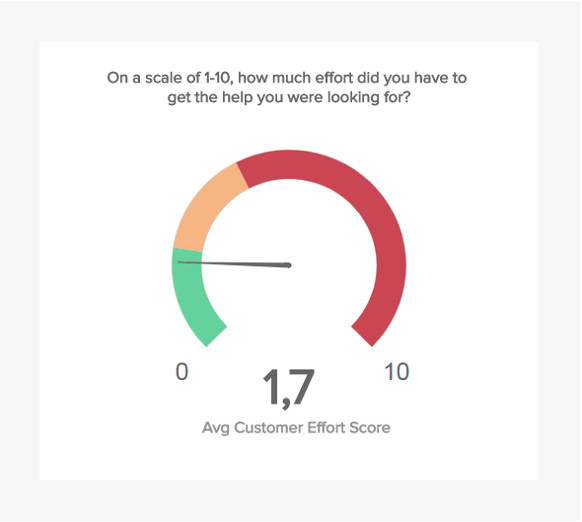
Customer Effort Score
Get valuable feedback on the customer experienceAnother of the important customer support metrics, especially for Software-as-a-Service (SaaS) companies, is the customer effort score. Knowing how easy it was for your clients to get what they wanted from your company is a good indicator on their experience. You need to keep that score low, otherwise you will have frustrated customers complaining about how difficult it is to use your services, usually on social media or rating platforms; and they might well end up terminating their partnership with you to go for a competitor with a more user-friendly approach. The question to ask depends on what you are providing, but should be similar to the following: “On a scale of 1-10, how much effort did you put while using our product/finding what you were looking for?”
Performance IndicatorsJust like the net promoter score, the customer effort score is directly linked to satisfaction rates and business growth, hence the need to lower this figure as much as you can.
Relevant Showcase Dashboard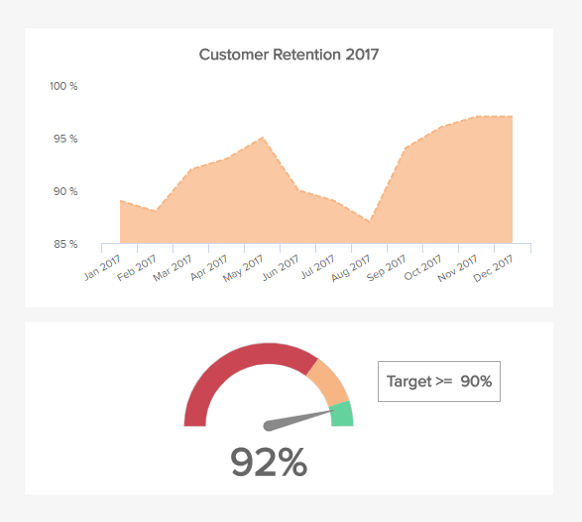
Customer Retention
Evaluate how many customers are coming backCustomer loyalty plays a fundamental role in a business’ success. It is usually measured by dividing the number of customers doing repeated business/purchases by the total number of customers. It is an important metric as it is well known that retaining a customer is less expensive than acquiring a new one. By maximizing this customer service KPI, you can reduce costs, or assign them to other channels that will grow your business. There is no specific value as it varies according to your business model and sector – a car dealership can still grow even if customer retention is low, while an online retail store should try to have a high rate to be sustainable in the long run.
Performance IndicatorsA growing retention rate is what every company should aim for, and that’s why it should be amongst the main support metrics to measure. A general positive brand image and high satisfaction score will directly increase your customer retention.
Relevant Showcase DashboardBecome a data wizard in less than 1 hour!
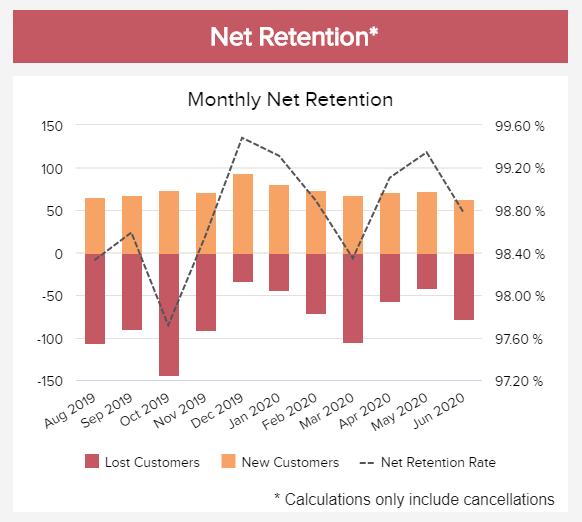
NET RETENTION
Calculate how much business growth you generateThe net retention KPI for customer service goes deeper into evaluating your business growth by monitoring the number of lost and new customers, and calculating the product or service cancellations only. That way, you will have a clear picture of how well your retaining efforts and strategies work, and if there is a reason to adjust. In our example, we can see that October has brought a higher number of lost customers while December had quite a positive increase. The goal is, of course, to maintain net retention of 100% or more but, in practice, results can differ. It would make sense to compare your results over time to see if you generate positive or negative growth. That way, you will have a deeper understanding of your customers’ fluctuations and, in that case, you can easily brainstorm ideas to increase the net retention rate.
Performance IndicatorsMonitor the this indicator over time and try to achieve 100% or more. If you fail, don’t panic but analyze deeper to identify bottlenecks.
Relevant Showcase Dashboard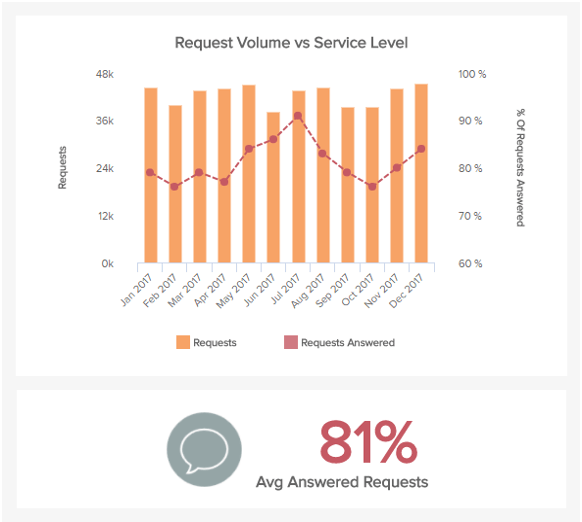
Service Level
Deliver the services as you committed toThe service level calculates your capacity to complete the standards set in the service level agreement provided to your customers. It is an ensemble of services agreed upon as a standard that your company is committed to maintaining. For instance, you stated to answer 70% of the email requests you receive within 1 business day. Monitoring these customer service metrics is important for you to know if you are performing well in comparison to this predefined goal. It does not really matter which specific metrics you chose, but it is essential to respect these agreements. Not evaluating them might let you out of track and some problems might also go unnoticed, delaying the moment you are aware of them and start fixing what has to be.
Performance IndicatorsFor your service level, you can track as many KPIs for customer service as you wish – but what you should aim for is to honor the services you agreed upon and even exceed the targets.
Relevant Showcase Dashboard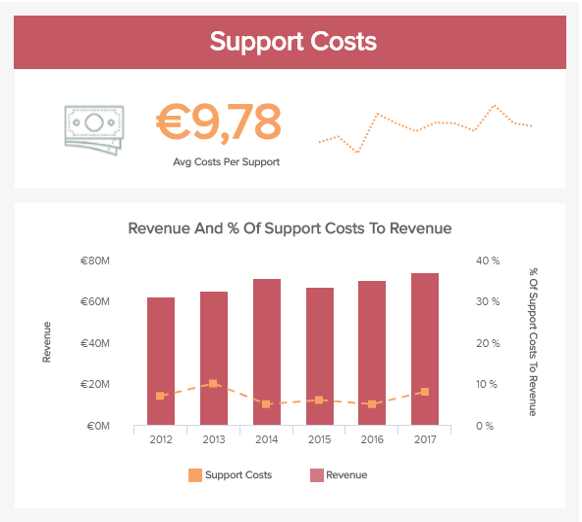
Support Costs vs Revenue
Find out how much are the support costs in percentage of your total revenueThe next example is another important support metrics. Comparing the support costs in relation to your revenue will help you to evaluate how much your customer service represents compared to your total revenue. One goal of every organization is to provide the highest quality at the lowest possible costs, so it is normal to have it tracked. To have another perspective, you can divide the total support costs by the number of issues, and you will have an idea of how much a single support costs to your company. It is inevitable to have customer support costs but managing to keep them low means that your agents are well trained, efficient and that the staffing schedule is well adjusted to the needs: overstaff might be a good thing in certain circumstances (rush hours/days), but that increases operational costs.
Performance IndicatorsMeasure this customer service KPI over time and see how your trend line is. If at some point they reach an unusually high percentage, it might be good to dig deeper.
Relevant Showcase Dashboard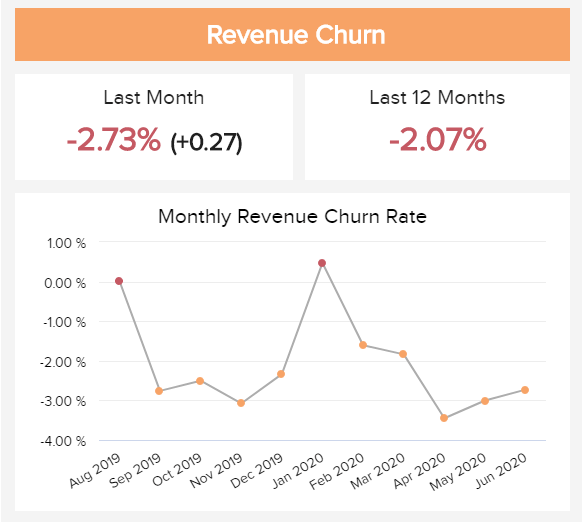
REVENUE CHURN RATE
Monitor how much revenue you’ve lostOne of the revenue-focused customer support KPIs, the revenue churn rate will tell you the exact percentage of how much revenue you’ve lost from existing customers, be it from an order cancellation, downgrade, or ending the business relationship. Particularly important In SaaS companies, the revenue churn rate will show the overall health of your client-business relationship, meaning your support team has a critical task to ensure that clients don’t have substantial issues using your product or service. That may lead to downgrades and cancellations, which should be avoided as much as possible. In our example, we can see that January brought a higher churn rate, which could mean that clients have canceled their yearly contracts and it affected the company.
Performance IndicatorsMonitor the revenue churn not just as a bigger picture, but also on an individual (customer) level so that you can identify reasons for churn and improve in the future.
Relevant Showcase Dashboard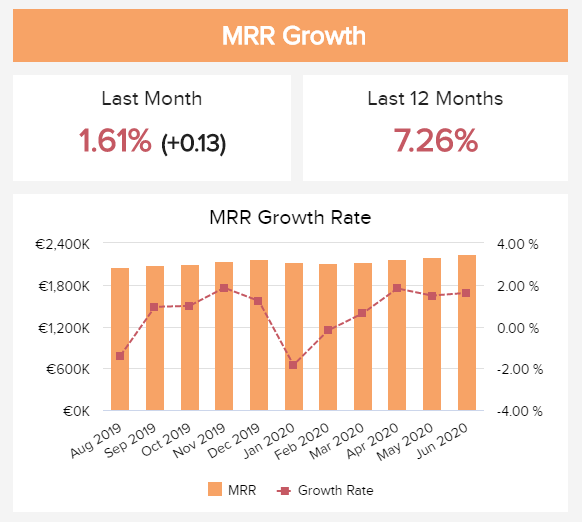
MRR GROWTH RATE
Keep an eye on your MRR at all timesTo effectively calculate the MRR growth, you should consider all aspects of the monthly recurring revenue: new, churn, expansion, and net new MRR. To make your life easier, online data visualization can certainly help. As you can see in the visual example, calculations are done automatically and the chart shows the growth rate for a longer period of time with an interesting lower point in January. As mentioned, the year has ended and the reasons behind these results could simply be customers that have decided not to prolong the contract due to budget cuts, e.g. The goal is, of course, to grow the business, but if you see that some months haven’t performed quite well, it makes sense to investigate why and avoid such scenarios in the future.
Performance IndicatorsCompare your MRR over a course of a longer period of time in order to identify how sustainable is your current business model and how fast are you growing.
Relevant Showcase Dashboard


Setup only takes a few minutes. No credit card required!