
26 KPIs that every HR manager should use
Human Resources Key Performance Indicators and Metrics
✔ See different templates & designs ✔ Find & track the right HR KPIs to meet your corporate objectives
An HR key performance indicator or metric is a measurable value that helps in tracking pre-defined organizational goals of human resources management. HR departments use KPIs to optimize recruiting processes, employee engagement, turnover rates, training costs, etc.
Expectations for HR professionals are continuously increasing and, in this article, we will look at the most important KPIs for HR to develop modern and effective management processes. Professional HR analytics software will provide you with all the necessary tools to extract valuable insights from existing HR data, and gain new, invaluable information. This includes a dynamic, interactive HR dashboard that consolidates all relevant metrics in a central location, without the necessity for advanced technical knowledge. Besides, you can automate each KPI and utilize modern online reporting tools such as datapine in order to share up-to-date and relevant HR data throughout your team.
Here is the complete list of the top 26 human resources KPIs and metrics that every HR professional and manager should know:
Absenteeism Rate: Evaluate the engagement of your employees
Overtime Hours: Monitor your employees' workload in detail
Training Costs: Analyze the investments in your employees
Salary Cost By Department: Breakdown your total salary costs
Salary Cost Development By Department: See department salary-revenue ratios
Salary Cost Development By Country: Analyze salary-revenue ratios per country
Employee Productivity: Track the overall effectiveness of your workforce
Talent Satisfaction: Ensure your employees are satisfied in the long run
Manager Feedback Score: See if employees are satisfied with their managers
Cost per Hire: Analyze what it takes to find the perfect fit
Recruiting Conversion Rate: Find the best recruitment method
Time to Fill: Monitor how long you need to find a new employee
Headcount Development: Monitor vacancies and new hires
Average Job Tenure: Analyze how long employees stay in the company
Talent Rating: Assess the quality of your employees
Employee Turnover Rate: See how your retention efforts work
Talent Turnover Rate: Evaluate how many talents you continually change
Turnover Rate By Group: Monitor if your diversity groups are satisfied
Dismissal Rate: Find out if you’re recruiting the right employees
Female to Male Ratio: Understand the gender diversity in your company
Gender Diversity by Role: Track gender share in managerial positions
Gender Ratio By Department: Track gender share across departments
Ethnicity Diversity: Discover how diverse your departments are
Recruitment Breakdown By Ethnicity: Ensure a diverse recruitment process
Part-Time Employees: Watch the evolution of part-time workers over time
Average Time Stay: See how long your employees stay in your company
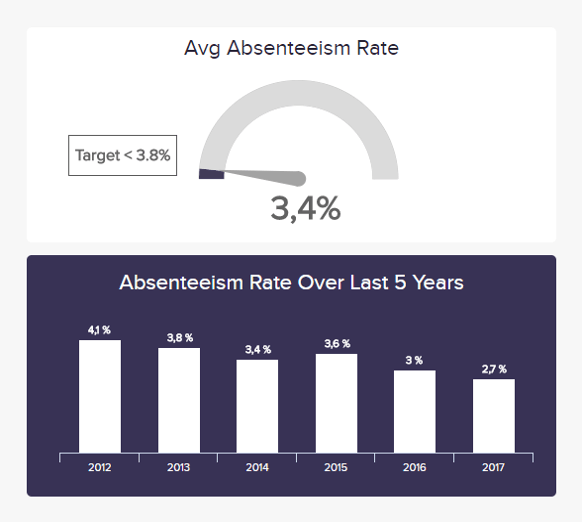
Absenteeism Rate
How engaged are your employees?The first of our HR metrics measures the average absenteeism rate as a percentage of the total working days among the entire workforce. It is a highly important employee engagement KPI as it illustrates the employee’s motivation and engagement in his work and, more generally, in the organization. Studies have shown in the past that workers with low motivation and engagement are much more likely to call in sick or skip some days of work. Therefore, it is important to watch this metric over time and to reduce it, because it will inevitably impact your business: be it the company atmosphere or the overall productivity, in the end your finances and the general well-being of the business will be at risk.
Performance IndicatorsIf your find your absenteeism rate of the past month(s) higher than the historical rate, investigate and find the reasons: is it specific to one department or a company-wide issue? Why? Then implement an appropriate strategy to remediate the situation.
Relevant Showcase Dashboard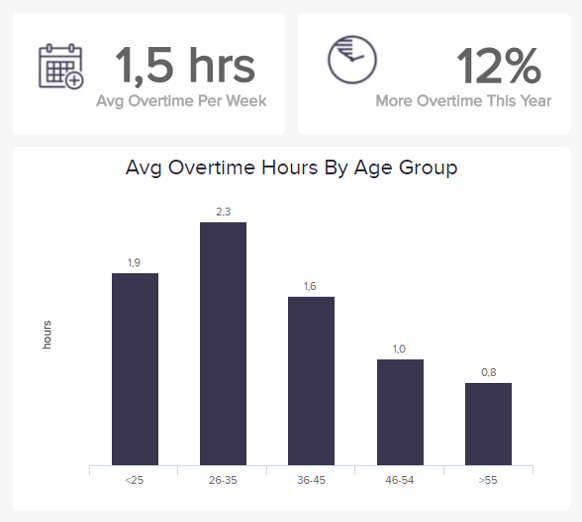
Overtime Hours
How do you monitor your employees' workload?Overtime hours are a great indicator on many levels, but have to be interpreted differently depending on the context. A sudden rise in overtime hours might translate into a temporarily higher volume of orders or economic growth. They can show the dedication of your workforce as well as flaws in work processes, or an understaffed workforce that has to deal with high pressure. This will directly impact another of the HR metrics we have seen previously: the absenteeism rate. Indeed, if people do not mind working overtime every now and then, an amount of overtime hours that goes through the roof and a permanent high workload will decrease both motivation and employees’ satisfaction, which may result in an increasing absenteeism rate.
Performance IndicatorsThe reasons for a permanently high overtime should be investigated at an internal level, as it also can confine the potential growth of a business when it results in missing orders or projects.
Relevant Showcase Dashboard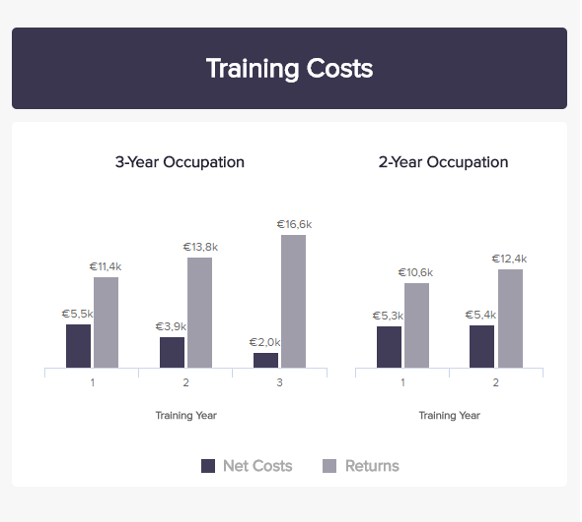
Trainings Costs
Do you invest in your employees?Here is a Human Resources KPI example used when you want to measure how much you have invested in onboarding new hires and upgrading one’s education. It is a helpful metric to track employees’ development costs, and make smarter decisions when it comes to developing their skills set after they have been hired. However, training costs should not be limited to new hires – more and more workers today wish they had a better job development and wish for a continuous learning in their position. Investing in an employee for him/her to develop his/her already acquired skills, or new ones, is an option often too little considered by HR management. Often enough, the return on training costs is greater than the initial investment.
Performance IndicatorsImplementing a little knowledge test and evaluating the scores of workers can help you see if the training provided was effective.
Relevant Showcase Dashboard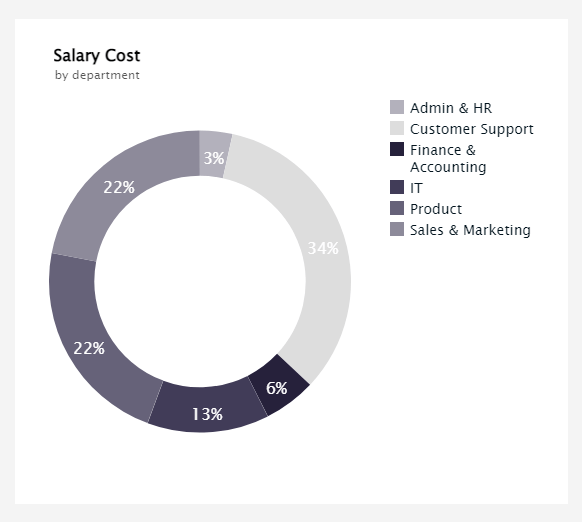
SALARY COST BY DEPARTMENT
How much does each department cost you?Our following HR KPI is from the financial side and it tracks the percentage of salary costs by department. According to the U.S. Bureau of Labor Statistics, salaries account for around 70% of a business’s employee-related expenses, making it a fundamental KPI to track to ensure these costs are justified and managed correctly. Monitoring salary costs enables HR managers and decision-makers to plan for future financial strategies, budgeting, and expansion to other markets, not only from a departmental perspective but also for the organization as a whole. The costs included in the calculation of this metric might vary from business to business but they most commonly consider base salary, taxes, office space, equipment used, average sick days or vacation, and other health benefits, among others.
Performance IndicatorsGet an overview where most of your salary costs are coming from and take a deeper look into the development of them as well as their impact on the revenue.
Relevant Showcase Dashboard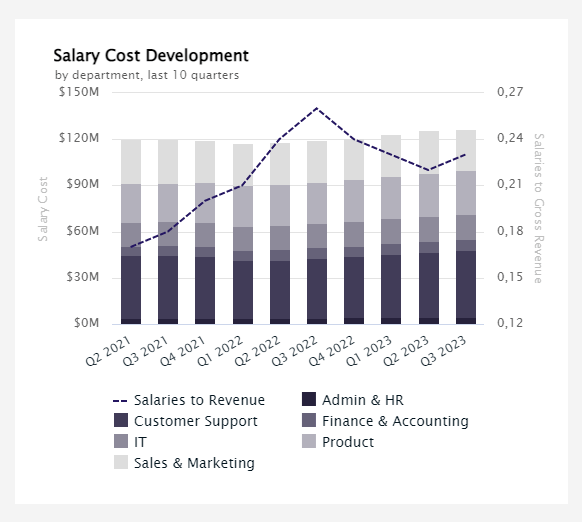
SALARY COST DEVELOPMENT
How are the salaries developing by department?Moving on to another example from the financial side of human resources, we have the salary cost development by department. It essentially takes the salary costs for each department and compares them to a ratio of the business’s revenue. Through this, decision-makers can understand what percentage of gross revenue salary-related costs account for, but also assess if they are being efficient at using their workforce to generate returns for the company. It is recommended to track this indicator over time and compare various periods to identify different trends and implement strategies to boost employee efficiency. For instance, by implementing training instances or performing a survey to find pain points in employee productivity, you can provide your workforce with the necessary tools to boost their efficiency and make the business more profitable in the process.
Performance IndicatorsThe average salary costs to revenue ratio changes from industry to industry. Identify your industry ratio and use it as a progress benchmark.
Relevant Showcase Dashboard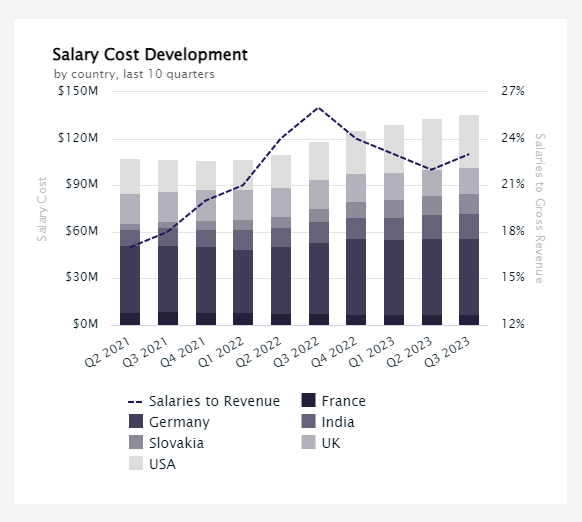
SALARY COSTS BY COUNTRY
How are the salary costs developing by country?Employee salaries are probably one of the biggest costs for an organization, and lowering them is almost impossible as it can directly affect the morale and productivity of your entire workforce. After all, they are the beating heart of the company and the main driver of profitability; therefore, finding a balance between salary expenses and revenue is a must. Our next template tracks salary cost development, this time by country. It is a KPI that is particularly valuable for a big corporation that employs people across the world as they can extract valuable conclusions to ensure the company remains profitable. That said, unlike the cost development by department we discussed previously, tracking salary costs by country is a bit more complicated. The costs will likely differ from country to country not only because of the average locally salary levels but also because of different tax regulations and other factors which should be considered in your calculations and analysis of this KPI.
Performance IndicatorsCompare your salary-to-revenue ratio by country to previous periods to evaluate if the company is on the right track.
Relevant Showcase Dashboard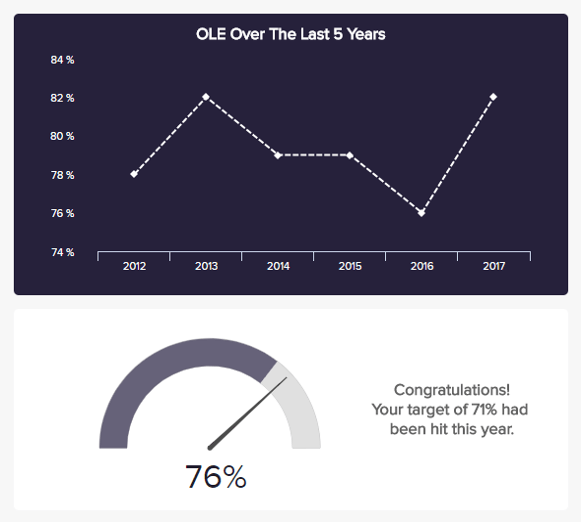
Employee Productivity
Do you measure the effectiveness of employees?The Overall Labor Effectiveness is a very interesting and complete HR KPI that takes several dimensions into account when measured thoroughly. It is usually calculated by dividing the total sales by the number of employees. But for a deeper analysis, it is good to consider the components that have an effect on the productive output: availability, i.e. the amount of time where employees are actually working; the performance, or the amount of product delivered; and finally, the quality, or the number of perfect/saleable products produced during that time. It is more of a manufacturing-oriented approach that can nonetheless be applied to other sectors. Beyond reviewing workforce performance, productivity measurements can help them understand how much they have done and how well they did it, and adjust their ways of working when needed.
Performance IndicatorsThe higher this ratio, the better it is for the organization. Measuring productivity accurately, can ensure greater profit but also increase employee motivation and recognition.
Relevant Showcase Dashboard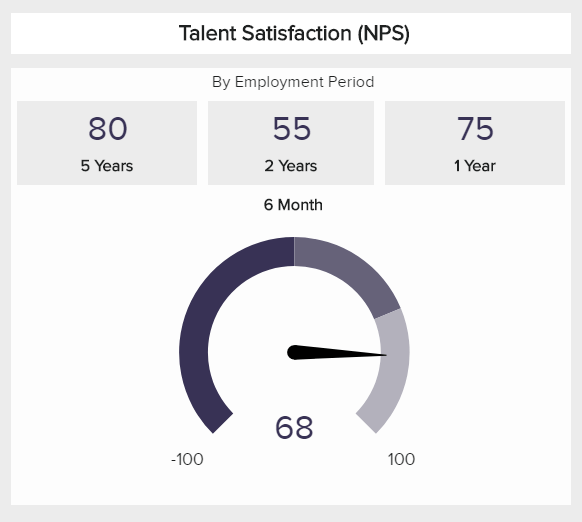
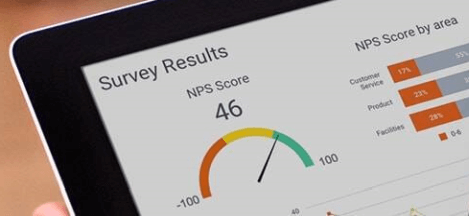
Talent Satisfaction
How satisfied are your employees?This is one of our HR KPI examples that shouldn’t be neglected in times of shortage of skilled workers and the associated "war for talents." Especially for young professionals, not only aspects such as salary and other financial benefits play a vital role in employment choice, but also a good work-life balance, flexible working time models, occasional work in the home office and a sustainable and social corporate culture. You should meet these requirements, especially in order to retain highly sought-after specialists in the long term. In order to quantitatively evaluate your measures in this regard, you should regularly conduct employee satisfaction surveys. For example, you could use the net promoter score (NPS), which we have illustrated on the left.
Performance IndicatorsUse this metric to evaluate the quality of your recruitment and employee retention strategy. It makes sense to look at employees or specialists according to the length of employment and departments/teams.
Relevant Showcase Dashboard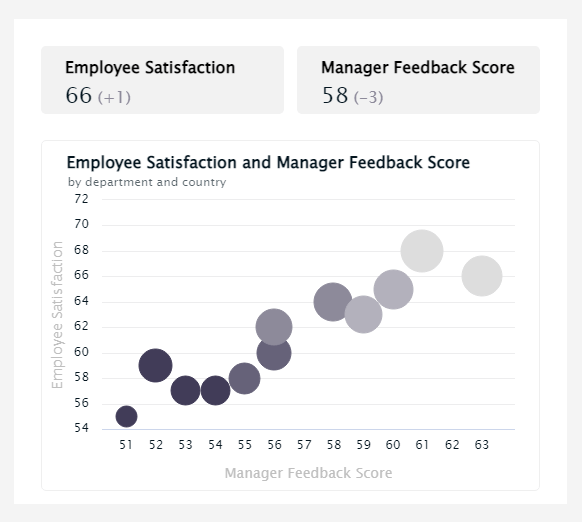
MANAGER FEEDBACK SCORE
Are employees satisfied with their managers?Next in our list of professional human resources metrics, we present the employee satisfaction and its correlations to the manager feedback. It essentially mixes employee satisfaction and manager feedback scores to see how managers influence the workforce’s satisfaction level. It is a fundamental metric to track as it helps the human resources department spot areas where employees feel uncomfortable with their superior and fix it to prevent them from leaving the company. After all, as the saying goes, people don’t quit bad jobs, they quit bad bosses. In fact, research shows that 57% of unhappy employees quit because of their managers. Proving how important it is to build a trusting and encouraging employee-manager relationship.
Performance IndicatorsTake a deeper look into low manager feedback scores to find the reasons behind them and come up with effective solutions.
Relevant Showcase Dashboard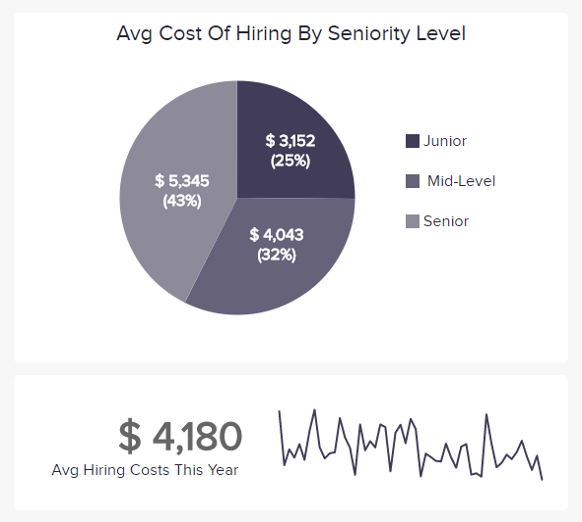
Cost Per Hire
What does it take to find the perfect fit?Here we have a pretty straightforward HR KPI, that measures the amount of resources you invest for each new employee you need. It covers all the costs from recruiting (advertisement/marketing, referral incentives, time cost of recruiter reviewing and selecting CVs, then conducting interviews) to training (time cost of manager/instructor, materials, and time cost of a new employee). These costs pile up rather quickly and heavily on a company’s budget, this is why hiring shouldn’t be taken lightly – but without employees, work cannot be done and business cannot be run. And this is in the end, the bottom line of every business: investing in talents that will bring even more value back. So even if the investment might make the finance department frown, the potential of talent acquisition is always worth it.
Performance IndicatorsMeasure the cost per hire according to the recruitment source, and see which is the most or least expensive. This shouldn’t be a unique reason to decide whether the source is a good one or not, as the turnover rate (how long people stay in the company) is important, too.
Relevant Showcase Dashboard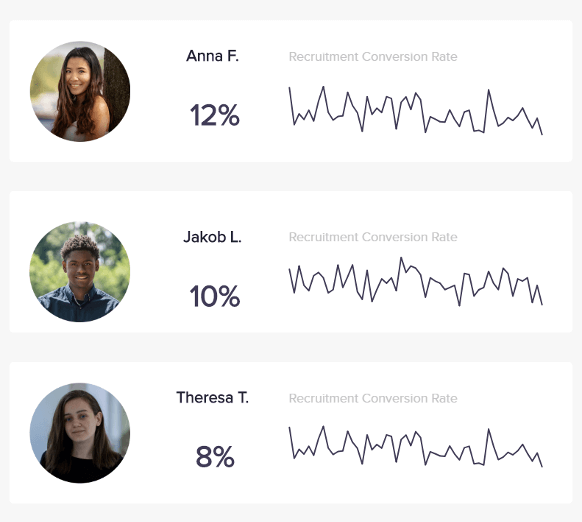
Recruiting Conversion Rate
How do you find the best recruitment method?The Recruiter Conversion rate is more of an HR performance metric, as it focuses on the HR executives more than on the regular workers. This KPI measures the ratio of the total number of applicants, that are actually turned into hired employees at the end of the process. There is no particular already-set ratio for efficient recruitment. It depends on your company, region, and sector. But this is a metric you can use to take a closer look at all involved steps and compare different recruitment methods you have implemented in order to choose which is the most efficient one, while still taking other indicators into account (like the retention rate 90 days after hiring). The main goal is to find the source that gives the best candidates at the lowest cost.
Performance IndicatorsCompare the different methods’ ratios to one another alongside the cost per hire. Then, choose the one you think fits the best your company style and budget.
Relevant Showcase Dashboard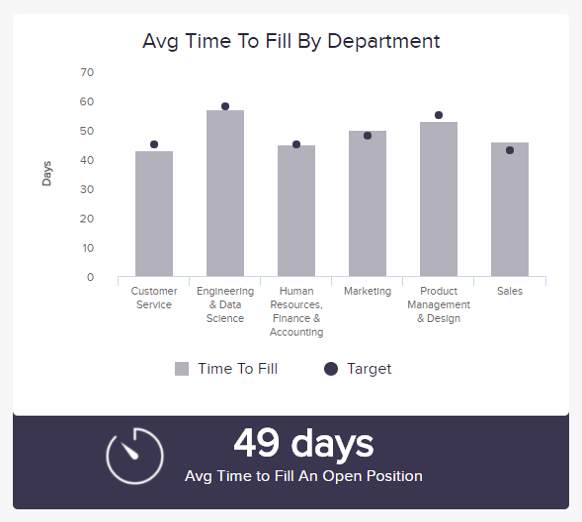
Time to fill
How long do you need to find a new employee?Another easily understandable HR performance metric as the definition lies in its name. This metric simply measures the time elapsed between the moment a job offer has been posted and the moment a new employee has been hired for that specific position. Like the Recruiting Conversion Rate, it tracks how efficient the hiring process is in terms of the time resources spent to fill a vacancy. It also informs to do realistic business planning, as a lay-off or someone quitting has to be handled and anticipated when possible. A low figure is always better; however, it shouldn’t be the main criterion. Investing time is important to find the best fit and a good hire might cost in the beginning, but the benefits will always better greater afterwards.
Performance IndicatorsTo work this metric right, keep in mind that it is a process evaluation more than an objective to reach by lowering the numbers at all costs. The objective of recruitment remains the outcome, i.e. an employee fitting the position well.
Relevant Showcase Dashboard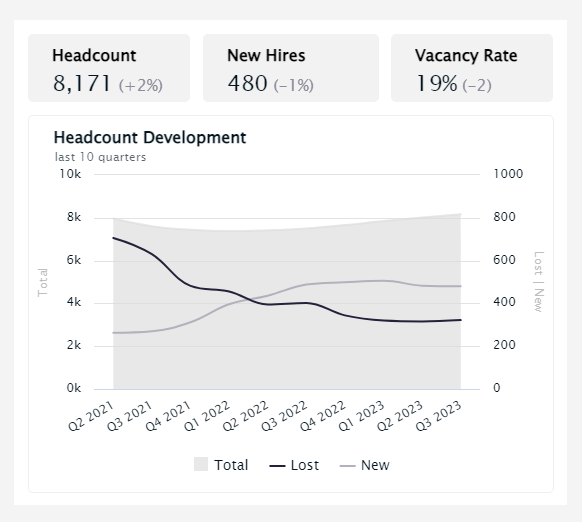
Headcount Development
How many new and lost employees are there?In human resources, the concept “headcount” refers to the number of employees working at a business at a given time, including part-time, full-time, temporary, or any other type of worker. The image above shows the headcount development for the last 10 quarters, differentiating lost and new employees against the total workforce of each quarter. It is important to note that this indicator is a lot more relevant for big corporations with a large number of employees over small businesses. Tracking this data in time helps big companies make accurate cost projections and recruitment strategies to ensure the company has the workforce it needs to cover the workload efficiently. Plus, it can also help uncover trends and opportunities to improve.
Performance IndicatorsTrack headcount development for departments, geographical locations, diversity groups, and more, and extract valuable conclusions for your strategies.
Relevant Showcase Dashboard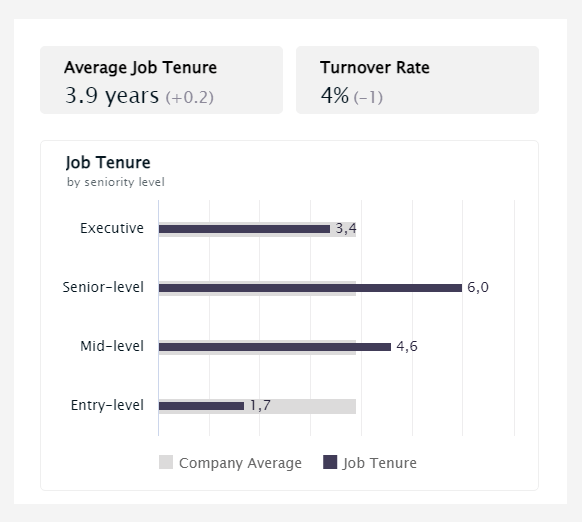
Average Job Tenure
What is your average tenure length by seniority?Our next human resources KPI is the average job tenure by seniority. It essentially tracks the average time in years that each employee spends working at a company based on his or her seniority level. In most industries, entry-level positions have the lowest tenure time as they are less engaged with the organization and can be tempted to move to a different job. Plus, entry-level workers are usually from a younger generation that is less likely to stay multiple years on the same job. On the other side, older employees working in mid or senior-level positions are more likely to stay for a longer time. Of course, the average tenure time will vary from industry to industry. For example, service-related jobs like serving food or selling at a retail store are more likely to have a smaller tenure, while management-related jobs a longer one.
Performance IndicatorsCompare your average job tenure with your turnover rate and extract conclusions to increase employee retention.
Relevant Showcase Dashboard
Talent Rating
How do you assess the quality of your employees?The relevance of regular, constructive employee and internal feedback meetings is undisputed and is taken for granted in most companies today. However, the HR department needs to measure the quality of its employees in order to be able to evaluate its recruitment measures. For example, it could be determined that employee assessments in the IT department are unsatisfactory, which could be caused by incorrect evaluation criteria during the recruitment process, or missing and irrelevant tests focusing on the wrong topics. To be able to identify such deficiencies and have an adequate overview of the quality of your employees at all times, you should develop an individual employee evaluation system (talent scoring). We have illustrated this for you using five selected scoring criteria as examples.
Performance IndicatorsThe more individual and better your employee evaluation system, the greater the potential benefit of this KPI for HR managers.
Relevant Showcase Dashboard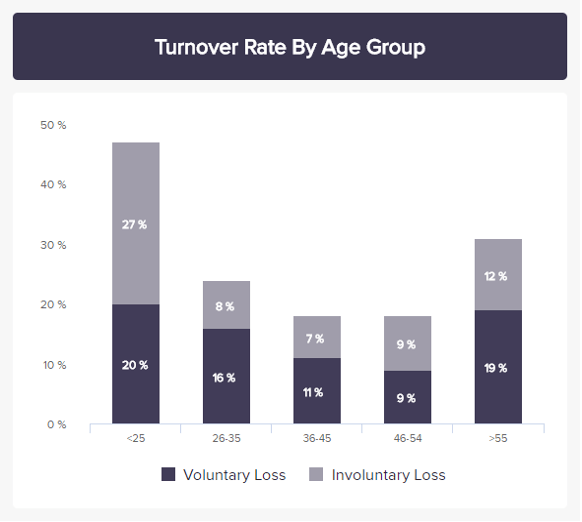
Employee Turnover Rate
How well do your retention efforts work?Another example of human resources metrics, employee turnover, measures how many of your workers leave, voluntarily or not. It indicates the success of your company in terms of retention efforts, and just like the time to fill, it is a good help to plan for talent replacement. Preferably, people who do not fit in with the company will leave – and it is not a bad thing for both parties. However, when your talents leave, it becomes a problem, because it is final: people never come back, or very seldom. And usually, people quit their managers, not their job. This is why you should track the root causes if you have a high turnover and identify potentially problematic areas that need to be fixed.
Performance IndicatorsA low turnover rate is always better for a satisfactory performance in the long run and lower recruitment costs in total.
Relevant Showcase Dashboard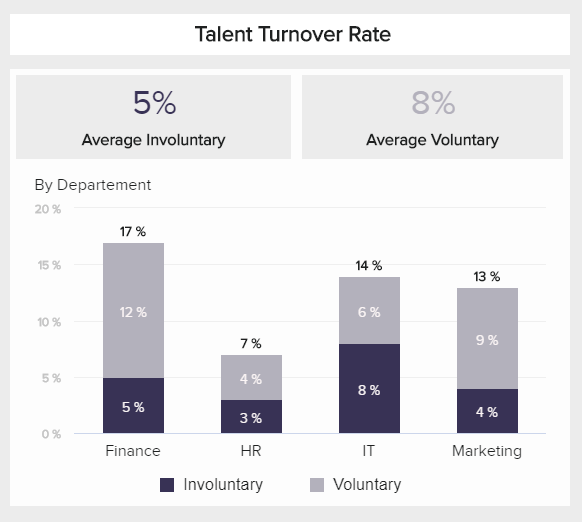
Talent Turnover Rate
How many employees do you need to change?A high turnover rate is particularly problematic for positions that are difficult to fill. This is where talent (junior specialists) and generally highly qualified specialists (professionals) are usually in demand. On the one hand, from a financial point of view, high expenditure means high recruitment costs, and on the other hand, these are usually key positions within the company that would benefit from a longer-term employment relationship. Therefore, it makes sense to take a closer look at these segments with the help of data analysis software like datapine. We have illustrated this in one of our human resources KPIs for professionals in different departments of a company.
Performance IndicatorsYou should try to keep this rate as low as possible, especially for your junior staff, as they will be your most valuable human resources in the future.
Relevant Showcase Dashboard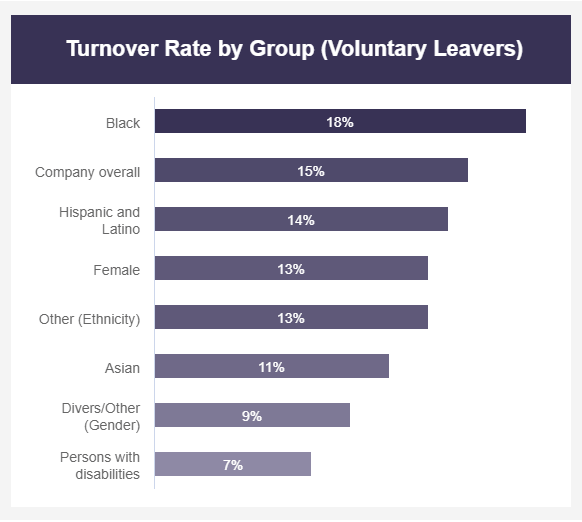
TURNOVER RATE BY GROUP
Is your diverse workforce leaving the company?Moving on to another KPI, we have the turnover rate by diversity group. This straightforward indicator tracks the percentage of voluntary leavers by diversity group which can allow you to understand if a specific group is unsatisfied with your organization. For instance, here we can see that the turnover of Black employees is 18%, even higher than the overall company; this means something is clearly going on that makes Black workers non-satisfied in your organization. In order to improve these rates in diversity groups, make sure you track the reasons as to why someone is leaving and find adequate solutions to prevent any more of your personnel from doing the same.
Performance IndicatorsAnother way to measure this KPI is by comparing voluntary leaves to involuntary ones. If you see that there is also a high percentage of involuntary leaves in a specific group, you also need to question your reasons to avoid any biases.
Relevant Showcase Dashboard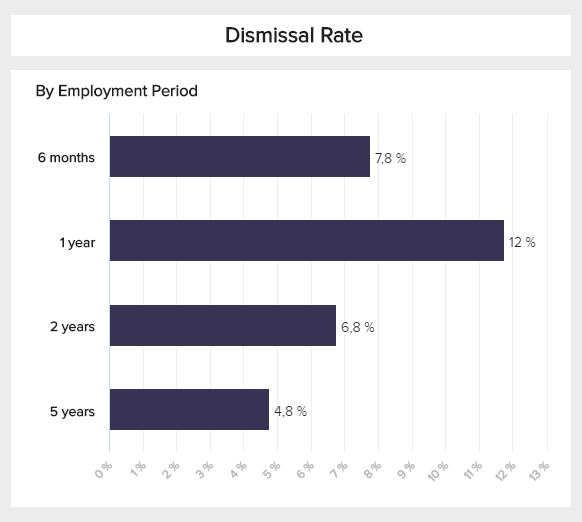
Dismissal Rate
Are you recruiting the right employees?The turnover rate is influenced by 2 main factors: terminations by the employee or employer. Additionally, there are other influencing factors, such as the expiration of employment contracts, retirements, resignations due to incapacity to work, etc. In order to monitor the quality of your recruiting measures in a transparent and comprehensible way, you can use the dismissal rate, one of the critical KPIs for human resources that focus on lost talent. Look at it from different angles, for example, according to the length of employment, teams, departments, or separately for your junior specialists, as shown in our template.
Performance IndicatorsYou should try to keep this KPI as low as possible, especially for your junior staff, as they will be your most valuable resource in the future.
Relevant Showcase DashboardBecome a data wizard in less than 1 hour!
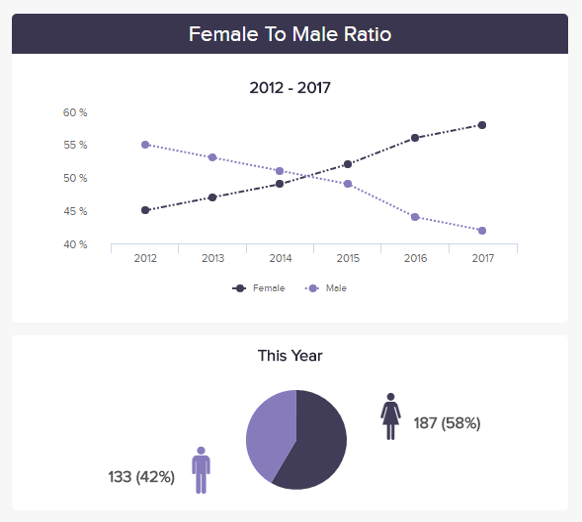
Female to male ratio
Is gender diversity present in your company?This HR metric is not often used and remains a bit of a taboo in many companies. However, measuring the ratio of female to male workers, especially in top-management positions, can tell a lot about a company. Some industries are very gender-biased (IT and engineering are overcrowded with men, while caring and nursing tend to be in majority female). This has a historical and societal explanation, but as our societies evolve, it is important to be aware of and encourage diversity – be it gender diversity, but also nationality-wise and curriculum-wise. The more horizons you gather, the broader the view and the more diverse the approaches and innovation possibilities you will have. That is an incredible competitive asset in our globalized economies.
Performance IndicatorsThere is no target rate in particular, as it also depends on the availability of the candidates at a certain time. But countless studies prove that a balanced environment – especially in boards of direction – is much more successful than any other in the long run.
Relevant Showcase Dashboard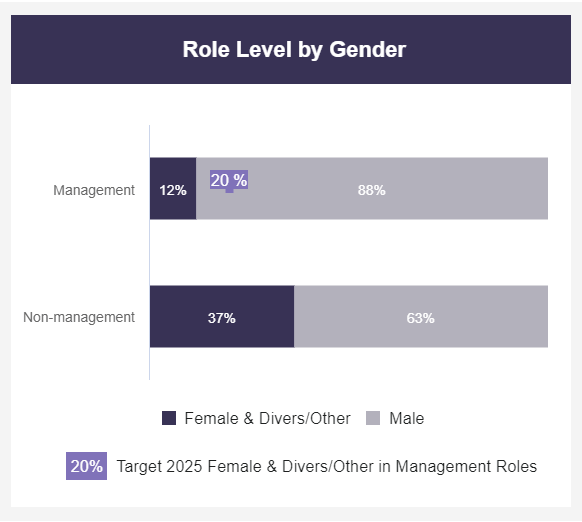
GENDER DIVERSITY BY ROLE
Are your managerial positions diverse enough?Our next example is the role level by gender. It specifically tracks the share of male vs. female/diverse employees occupying leadership roles. As mentioned, there are still many industries that are male-biased. Therefore, this is an important KPI to track when it comes to diversity, as you want to ensure your organization is diverse across all levels. A great way to ensure this is to set realistic targets. As seen in the example above, there is a target to increase female and diverse workers occupying management roles to 20% by 2025. This can allow you to understand if the actions you apply are contributing to reaching your end goal.
Performance IndicatorsConsider measuring this KPI with other diversity groups such as disabilities or ethnicity. This will allow you to ensure that you are not being biased about any demographic group.
Relevant Showcase Dashboard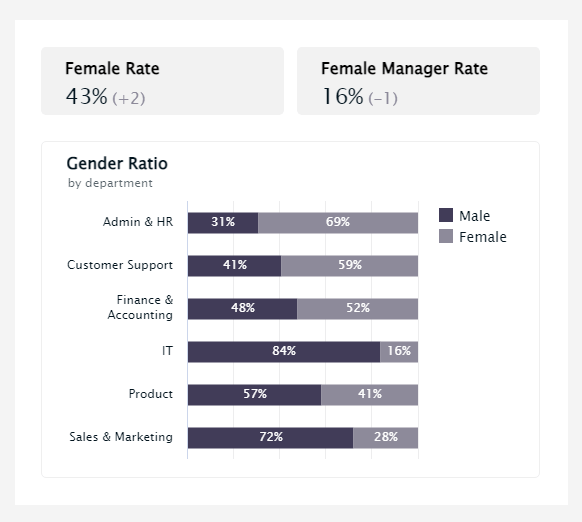
GENDER RATIO BY DEPARTMENT
What is the female share by department?On a similar note as our previous example, this KPI tracks the gender ratio by department. As mentioned previously, there are many industries and departments that are still predominantly male. Therefore, tracking the share of female and male employees by department can help spot areas with a big disparity and evaluate the causes and measures to take. The image above, shows that IT is the department with the biggest share of male employees. This is not a surprise as research suggests that only 38% of women with a computer science background are working in the field compared to 53% of men. That being said, it is important to assess the business’s job applications and processes to make sure there weren’t any (voluntary or involuntary) male biases during recruiting time and that every candidate was given the same opportunities.
Performance IndicatorsInclude this metric in your recruiting analytics process to ensure objective hiring strategies.
Relevant Showcase Dashboard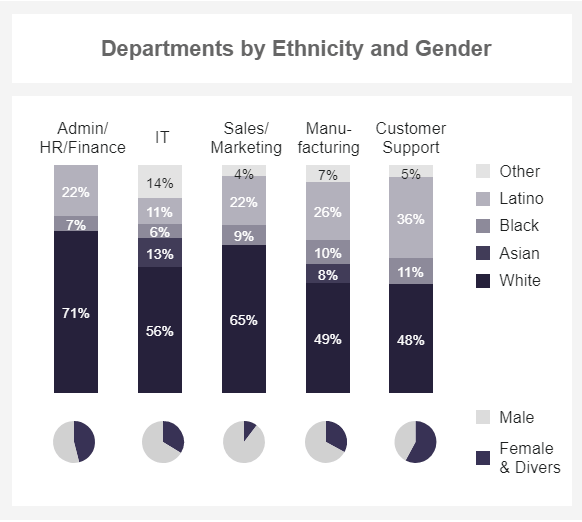
ETHNICITY DIVERSITY
How diverse are your business departments?Expanding on our last example, we will now cover ethnicity and gender by department. Diversity in business is not an easy topic. While some companies might pride themselves in having a diverse workplace, they might still be biased when it comes to a specific function or department (such as hiring men or white people in higher-paid positions). To avoid it, this KPI offers a breakdown of ethnicity and gender by department. Here we can see that financial positions are mostly occupied by white employees, while manufacturing positions are mostly occupied by men. This could be something to look into to ensure diversity across the board.
Performance IndicatorsA great way to start analyzing your diversity by department is to look into areas that are most generally male-forward such as IT and sales and others that are ethnicity-forward such as HR or finances. These will be great starting points to look at your recruitment and selection processes.
Relevant Showcase Dashboard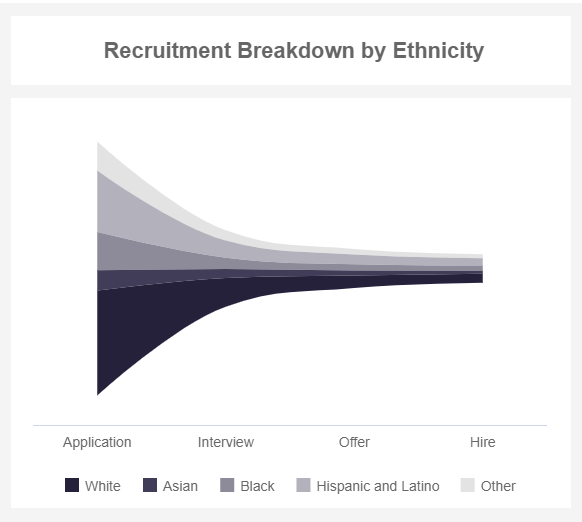
RECRUITING FUNNEL BY ETHNICITY
Is your recruitment process biased?Moving on to another diversity metric, the recruitment breakdown by ethnicity is valuable for learning how inclusive your hiring process is. If your team is lacking diversity, but you see that your applicants are coming from different ethnic groups, then there is something going on in your recruitment strategy that needs to be looked into. An efficient way to avoid bias in recruiting is to educate your HR team on diversity measures, standardize interviews, identify entry barriers, and use anonymous resumes to select candidates. On the other side, if you find no diverse candidates at all, then you need to rethink your job descriptions to make them more interesting for a wider group of applicants.
Performance IndicatorsIf you find your company is struggling with diversity recruitment, then set realistic goals to gradually improve.
Relevant Showcase Dashboard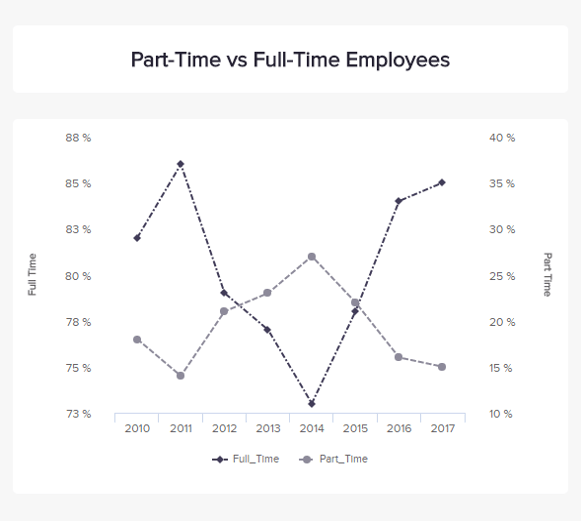
PART-TIME EMPLOYEES
Do you take into account part-time workers?Part-time employees work fewer hours in a day or a week than full-time ones, who are usually employed around 40 hours per week. There are several advantages to having part-time workers, especially when you start your company and cannot take too much risk, or when a position is needed but does not require someone to dedicate 40 full hours on it. Many different people can look for part-time jobs as these fit their needs and schedules better. But CEOs should keep in mind that cumulating several part-time employees to avoid the benefits and costs a full-time position would require is a poor strategic choice, as part-time workers may take longer to learn the job, the company culture, and can hardly be retained if they want a full-time job that never materializes.
Performance IndicatorsTrack the evolution of part-time contracts over time and parallelize it with other metrics like company performance and results, or workforce satisfaction and engagement.
Relevant Showcase Dashboard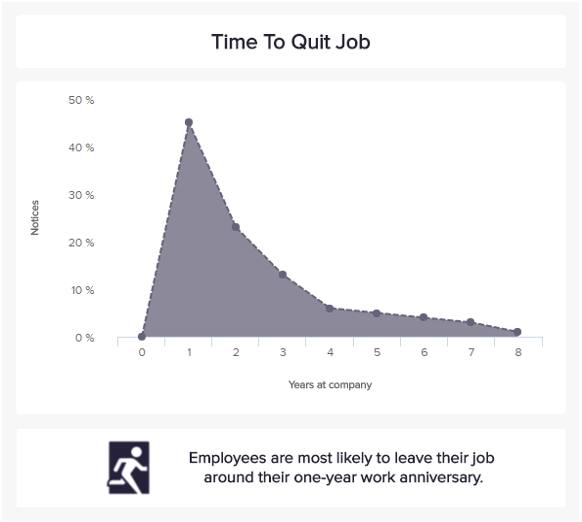
AVERAGE TIME STAY
How long do your employees stay in your company?The last of our Human Resources KPI examples is a good indicator of the attrition of your business, and lets you know if you are good at retaining talent. This HR metric tracks the average number of weeks, months or years an employee stays within a company. It is efficient to measure both retention and employee satisfaction with his position, his team and/or managers. You already know how much hiring and training a new employee costs – so the longer the time he or she stays, the better! That way, you can earn greater return on your investments. This metric is even more powerful if measured alongside other KPIs like the Employee Turnover: a short time stay combined with a high turnover does not announce anything good, and the reasons for that should be assessed as soon as possible.
Performance IndicatorsThe longer, the better for your company’s return on hiring and training investments.
Relevant Showcase Dashboard


Setup only takes a few minutes. No credit card required!