
IT METRICS THAT EVERY IT MANAGER SHOULD USE
TOP 20 IT Key Performance Indicators and Metrics
✔ See different templates & designs ✔ Find & track the right IT KPIs to meet your corporate objectives
An IT KPI or key performance indicator helps to keep track of all relevant aspects of quality regarding an IT project. KPIs help deliver projects on budget and time by analyzing and optimizing the IT ticket management, IT problem-solving and IT cost management.
Modern times require modern solutions and the IT industry is usually at the forefront of innovations. CTOs, managers, professionals, and project leaders need to constantly keep up with changes in order to optimize their performance and results. Modern KPI software helps organizations to automate processes and generate immediate insights from their IT data. In order to be fully successful, we suggest you create a complete IT dashboard from our selected IT metrics below. That way, you will gain full control over your performance while taking advantage of professional IT analytics solutions that will improve your bottom line.
Since we have explained what are KPIs in IT, now we bring you a complete list of the top 20 IT KPIs and metrics that every IT professional needs to know:
Total vs. Open Tickets: Do you measure the ticket churn over time?
Projects Delivered on Budget: Can you keep your budget within limits?
Average Handle Time: How do you keep your tasks under control?
New Developed Features: How many features do you continually develop?
Number of Critical Bugs: How many bugs do you regularly encounter?
Server Downtime: Do you know why and when downtime happens?
Backup Frequency: How frequently do you back up your data?
Cyber Security Rating: How is your overall security strategy?
Amount Of Intrusion Attempts: What frequency & type of threats do you face?
Mean Time To Detect: How long it takes you to detect an attack threat?
Mean Time to Repair: How efficiently you deal with unexpected events?
Phishing Test Success Rate: Are your employees aware of potential threats?
Unsolved Tickets per Employee: Do you monitor employee’s effectiveness?
Reopened Tickets: Are you handling your tickets efficiently?
IT Support Employees per End Users: Do you have enough IT support?
Accuracy of Estimates: Do you estimate your team’s time correctly?
IT ROI: How profitable are your investments?
IT Costs Break Down: Are you able to identify your costs’ breakdown?
IT Costs vs. Revenue: Do you compare your IT expenses to your revenue?
Team Attrition Rate: Do you manage to keep talented employees?
TOTAL TICKETS VS. OPEN TICKETS
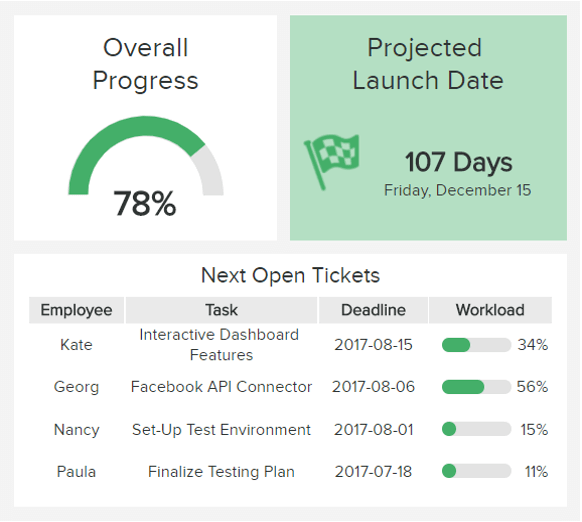
Do you measure the ticket churn over time?Monitoring the overall progress of your tasks and projects is key, and that’s why this IT KPI made it to the top of our list. An important number of unresolved tasks piling up might translate a problem across the system, or with the agents. This is why it is important to monitor it in relationship with other indicators (workload of the staff, their deadlines, etc) as displayed on our example aside. Thanks to a modern KPI software like datapine’s, you can easily track the ratio of open to resolved tickets, while keeping an eye on the most important open tickets to complete your tasks on time. You can also work with various filter options for the ticket history, and filter by specific project for instance, or by individual team or employee.
Performance IndicatorsMonitor the ratio of open vs. completed tickets over time for different projects, teams or employees, and find potential strategic optimizations in your ticketing system.
Relevant Showcase Dashboard
PROJECTS DELIVERED ON BUDGET
Can you keep your budget within limits?Our second IT KPI example reflects on the project expenses: it estimates if the costs of your project are below or above the originally planned upper limit. To calculate the cost variance, divide the planned budget to the actual budget at a given time. On our example, we see that the budget is currently 8.1% over target. When budgeting for a project, we try to take all the costs into account but there inevitably are new costs that appear, unexpected events that change plans, etc – this is why it is important to add a certain margin of error to take them into account.
Performance IndicatorsIf your project budget is already over target in the early or mid-stages of delivery, you should investigate on the reasons: poor estimations? Underlying problems in the development? Find the potential issues to better stay within your budget limits.
Relevant Showcase Dashboard
AVERAGE HANDLE TIME
How do you keep your tasks under control?This IT KPI is a key metric for every project manager – but also for employees – and helps you monitor your planned tasks, projects and sprints. By analyzing your past sprints, you can optimize the workload of each employee. In our example aside, we take the case of a 5-day sprint. We see that Nancy has completed her tasks within the 5-day sprint-limits, usually already after 3.7 days, and doesn’t have a heavy workload. Paula, however, can rarely accomplish her tasks within 5 days. You should hence analyze the reasons behind it: is it due to bad planning management, or is Paula lacking the skills required to accomplish that task? On overall, however, the average handle time for all the employees is 5.5 days, which is still within the framework.
Performance IndicatorsAnalyze your sprints at your preferred time-interval (one week, two weeks, four weeks, etc.), and optimize the workload of all team members. You can then plan the average handle time more accurately, and hence have more control over your project deadlines.
Relevant Showcase Dashboard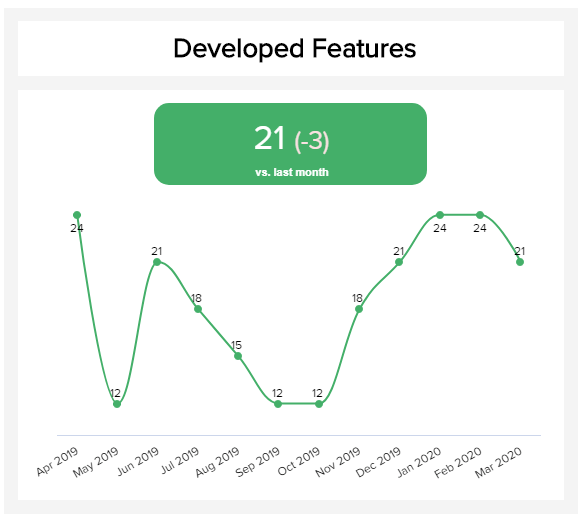
NEW DEVELOPED FEATURES
How many features do you continually develop?Each IT team is focused on developing new product features but the important part is to measure and compare the results over time. This KPI for the IT department will make sure you have a clear overview of the feature development in order to implement those findings within your next sprint planning, internally across the business, or launching it to the public. Usually, each feature should be tied to a bigger business goal (acquisition, retention, conversion, just to name a few) and it’s important to filter the ones that wouldn’t bring additional value to the organization and focus on the most profitable ones while keeping the track of the teams’ performance.
Performance IndicatorsMeasure the developed features over time, compare, and optimize based on your overall business goals and teams’ productivity levels.
Relevant Showcase Dashboard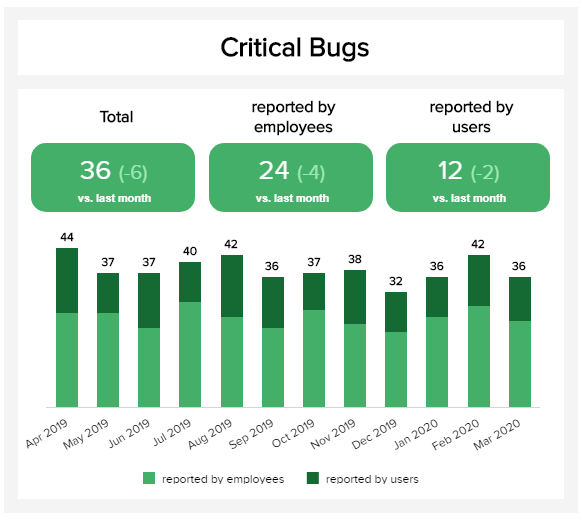
NUMBER OF CRITICAL BUGS
How many bugs do you regularly encounter?Problems and/or bugs arise every day but the most critical must be monitored over time, intuitively organized, and analyzed in depth. That’s why a KPI for the IT manager such as the visual one on the left has advantages in showing the total number of critical bugs, the ones that were reported internally by your team, and externally by the end-user. The point is to keep these numbers as low as possible since a high number of externally reported bugs can affect your brand as a result. An overview over time can tell you if the critical bugs are rising and, in that case, it might make sense to dig deeper into causes. Perhaps the product was launched too soon or new features don’t work as expected?
Performance IndicatorsKeep an eye on the overall number of critical bugs in order to avoid deeper issues within the business and potential damages to the brand image.
Relevant Showcase Dashboard
SERVER DOWNTIME
Do you know why and when downtime happens?The server downtown is a great IT KPI for the server performance management. It tracks the amount of time your IT infrastructure is down and not working. Downtime can be planned: for maintenance, updates or reboots, that are necessary to a well-functioning infrastructure. However, downtime can also be unexpected, when the system crashes – and at this moment, you will need to have an outage response plan efficiently designed to minimize that unforeseen downtime. You can measure this IT metric on a monthly basis, or on a quarterly or annual basis – but the more often, the better, so that you can track more accurately if there are specific times at which this happen, and identify the root causes more easily.
Performance IndicatorsYou can measure the downtime in minute alongside the uptime as a percentage. Having an uptime over 99,9% is considered good and is favorable.
Relevant Showcase Dashboard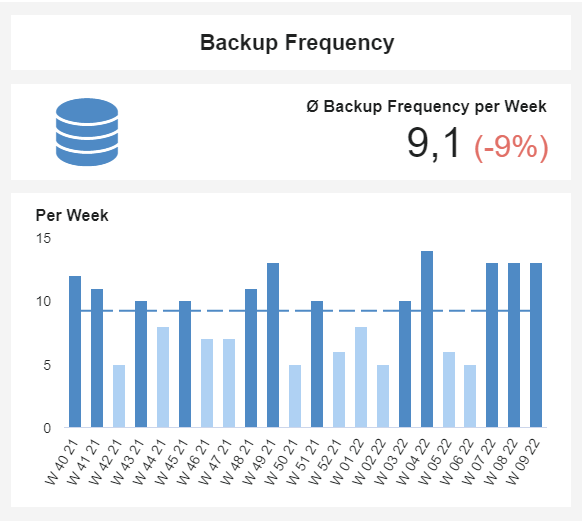
Backup Frequency
How often do you backup your data?Our next example is a straightforward metric tracking the backup frequency. Enterprises and small businesses alike gather sensitive data that needs to be constantly saved in additional secure locations. With cyber-attacks becoming a constant threat, the need to back up your data regularly becomes critical. For that purpose, this metric provides you with a visual overview of your backing actions by week. This allows you to keep a record and ensure that everything is being saved when it needs to. This way if any attacks happen, you ensure that the business is minimally affected.
Performance IndicatorsAn acceptable frequency of data backup should be once a week. However, an ideal frequency is once every 24-hours. Automation tools can help you in this matter.
Relevant Showcase Dashboard
Cyber Security Rating
How well do you manage cyber security?Our next KPI example aims at helping businesses define the quality of their security measures. It is no secret that cyber security has become a priority for IT departments. Therefore, the need to measure and optimize security actions becomes critical. There is not a standard calculation for the cybersecurity rating as it will depend on diverse factors pre-defined by the company. Some calculations might include other cyber security metrics mentioned in this list such as downtimes, mean time to detect and repair, and attack attempts, just to mention a few. The end goal here should be to always try to increase your cyber security rating with new actions. In the example above, we can see that this company has gradually increased its rating in the past 5 years going from an intermediate to an advanced level which means its security strategy is successful.
Performance IndicatorsIt is expected that cyber security ratings will count as an important factor when considering new business relationships, therefore it is critical to ensure your company has a good rating for internal and external purposes.
Relevant Showcase Dashboard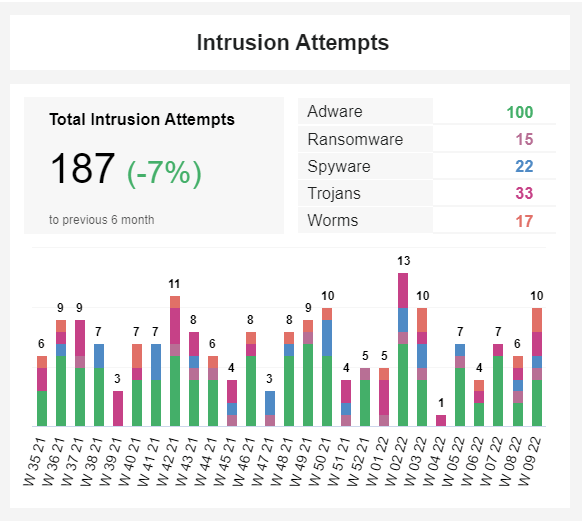
Amount Of Intrusion Attempts
What are the most common intrusion attempts?As its name suggests, our next example covers the number of weekly intrusion attempts – meaning unauthorized efforts to access your company’s system. This fairly straightforward KPI is also divided by the type of attempt and is compared with the previous six months to see how it developed in time. Tracking this information in real-time provides the IT department with accurate data about the level of risks its system is facing on a regular basis. Adding to this, looking at the most common types of attempts can also provide insights into where you should be focusing your efforts. For example, this company has a high majority of Adware attacks, therefore this is a place to start optimizing.
Performance IndicatorsAlthough this might not seem like a critical IT metric, it is relevant to track it regularly. While your security system might be preventing incidents to occur, it does not mean you are not a target. Therefore, tracking common attempts is key for overall cyber security.
Relevant Showcase Dashboard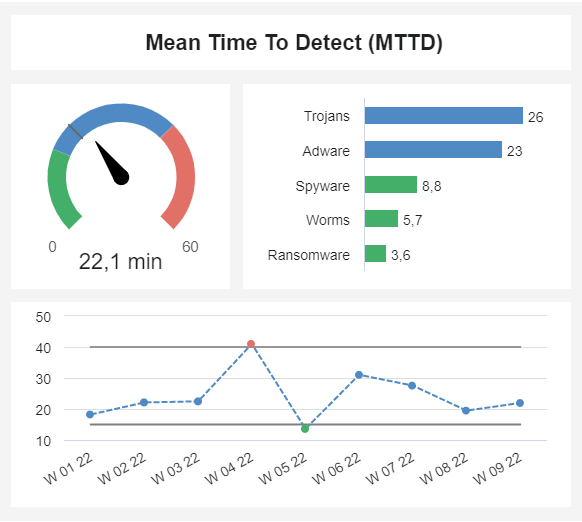
Mean Time To Detect
How long does it take you to detect an attack?Paired with the intrusion attempts, another one of the most relevant cyber security metrics to monitor is the mean time to detect (MTTD). This indicator shows how long a security thread is going unnoticed until the moment someone from the IT team deals with it. Naturally, the MTTD should always be as low as possible, as the longer it takes to detect and attack the longer the attackers can damage the system. Of course, the MTTD will depend on the type of attack, as some of them might be harder to notice than others. Tracking this metric weekly can also tell you about a few areas in which you can improve. For example, here we can see that week 4 had a spike in the detection time. This could be looked into and find improvement opportunities in the detection process.
Performance IndicatorsTrack your mean time to detect on a regular basis as some cyber attacks are cheaper to fix the sooner they are found. In time, it will not only keep the organization safe but also lower security spend.
Relevant Showcase Dashboard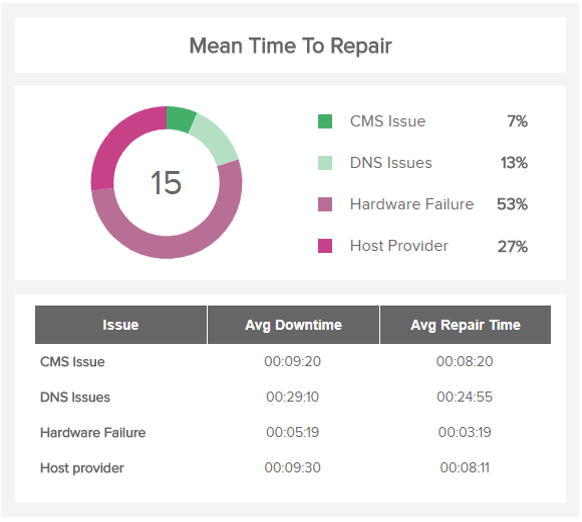
MEAN TIME TO REPAIR
How efficiently you deal with unexpected events?The mean time to repair is an IT KPI that is measured calculating the time between the start of an incident and the moment it is resolved. It includes the diagnostic time, fixing time, alignment, calibration, test, and wait time to get back to production. It is a reliable performance IT metric since it measures how good a team is at facing, responding and repairing a problem. Our IT KPI examples aside organize the different time to repair according to their nature (DNS issues, hardware failure, ...) and the time they need to be troubleshot: that way, you not only know where you should assign more staff to address the issues, but also how long it takes on average to do so. That is important for planning ahead.
Performance IndicatorsBy knowing which issues appear and for how long, you can better develop standard processes and an efficient strategy to tackle them as they happen, and benchmark over time the evolution.
Relevant Showcase Dashboard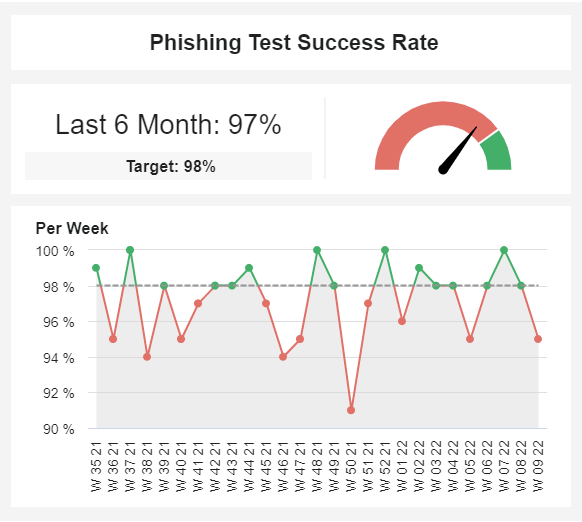
Phishing Test Success Rate
Are your employees aware of potential threats?Continuing with some insightful cyber security metrics we have the phishing test success rate. With cyberattacks becoming more frequent, companies need to ensure their employees are not exposed to falling for these threats. Phishing has become one of the most common attacks in the past decades, as it doesn’t require breaking through advanced security systems to reach it. For this purpose, especially big enterprises conduct weekly phishing tests with different parts of their workforce to measure how likely are employees to fall for these attacks and find preventive measures to avoid them. In the example above, we can see that this organization barely made it to the target of 98% success. To improve this, the IT department needs to look into the worst-performing weeks and find areas in which security awareness measures need to be implemented such as training for employees.
Performance IndicatorsWhen it comes to smaller businesses implementing weekly phishing tests can be less effective as employees can suspect that something is going on. Instead, you can plan training instances to generate awareness about this topic.
Relevant Showcase Dashboard
UNSOLVED TICKETS PER EMPLOYEE
Do you monitor your employee’s effectiveness?This is another pretty self-explanatory IT KPI. Unresolved issues can also be called open tickets, and calculate the number of issues that remain unsolved and need further communication. Tracking the number of issues that remain unsolved by worker provides a good view on each of your employee’s performance. It can also create a healthy competition and give everyone an idea of where they stand with regard to their peers. Displaying them as a ratio between the solved and unsolved tickets will show who is off track and you should investigate the reasons why: it might be because of a very demanding customer, or a lack of training, etc.
Performance IndicatorsThe lowest the percentage, the better, since it means that you have more issues solved than not.
Relevant Showcase Dashboard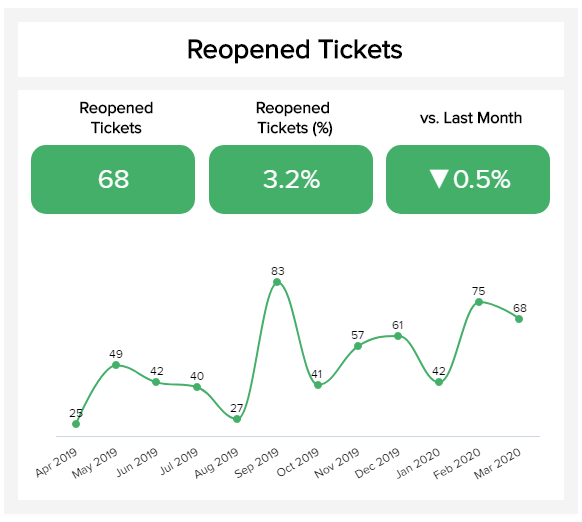
REOPENED TICKETS
Are you handling your issues efficiently?Our rundown of the most prominent IT performance metrics wouldn’t be complete without the metric focused on reopened tickets. This basically shows how effective is the task handling, usually feedback or bugs, and doesn’t require additional reopening. If the team performed well, the less repeated problems will appear again, and your improvement efforts will be positive. It’s good to track this metric over time and see which months brought more reopened issues in order to improve the team’s performance. The goal is to keep the ticketing system as clean as possible and the numbers on the lower end of the spectrum.
Performance IndicatorsTrack the number of reopened tickets over time and talk to the team to see what happened during certain spikes in your metric’s data.
Relevant Showcase Dashboard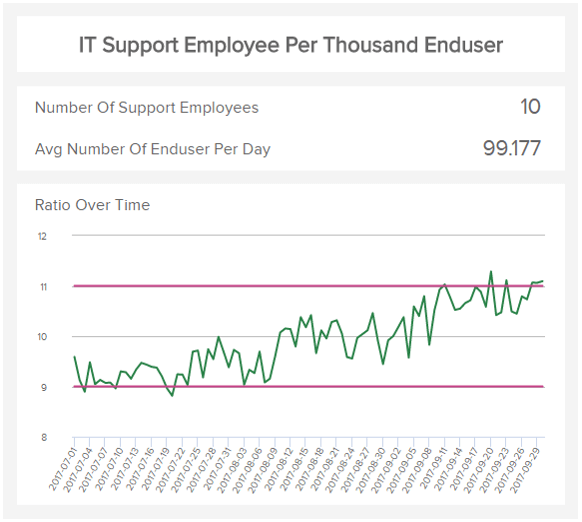
IT SUPPORT EMPLOYEES PER THOUSAND END USERS
Do you have enough IT support employees?This IT KPI represents a self-explanatory ratio: how many support workers does your company have to help a thousand of end-users? On our example on the side, there are 10 support employees for an average of 99.177 end-users daily. But the ratio keeps on growing over time, and from the lower-end of the target zone it increases to reach the top and even goes beyond. That translates a need to hire more support workers for them to continue providing a high-quality work without being under too much pressure, trying to solve a pile of tickets that never decreases. There is no exact ratio to follow, as it depends on the type of users you have in front of you, but also on the product you support: a small mobile app requires less time for support than a high-end analytics software suite. This IT KPI is especially important for hard scaling IT companies.
Performance IndicatorsTo know if your current ratio is good, validate it with different quality support metrics. If such ratio doesn’t provide a good support, set it lower by hiring new support employees.
Relevant Showcase Dashboard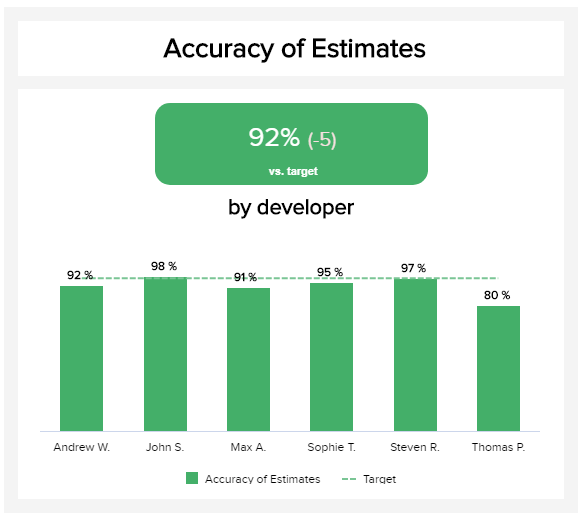
ACCURACY OF ESTIMATES
Do you estimate your team’s time correctly?In many IT scenarios, developers need to estimate how much time they need in order to complete a task. It’s extremely hard to estimate 100% correctly each time, but the point is to be as close as possible. Missing the launch date because of an increased number of bugs that developers need to deal with is common in the IT-sphere and requires regular tracking in order to be better prepared for the future. Here it would also make sense to be aware of “just” tasks: it’s just a small task, it will only take 10 minutes to fix it, it shouldn’t take a lot of time, etc. These are often ad hoc tasks that cause delays and missed deadlines since developers can easily underestimate the time needed to focus on the issue.
Performance IndicatorsMonitor the task efficiency with a percentage and break it down by team members so that you know which tasks have caused inaccurate estimations and examine why.
Relevant Showcase DashboardBecome a data wizard in less than 1 hour!
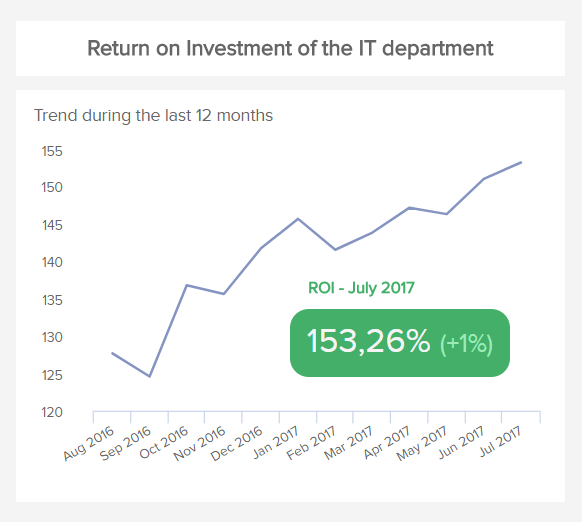
IT ROI
How profitable are your investments?An IT metric relatively universal, the IT return on investment measures the efficiency of your investments. An ROI analysis usually answers the famous question, “how much bang for the buck do I get?”. It is an easy gauge for profitability, evaluating how much you get back for one dollar of investment. To push it a bit further, when measuring returns, you should go beyond obvious metrics like cost savings or revenue increases, and include all levels of performance relative to a program or a project’s goals. You will thus measure more than only financial, raw returns, and expand them to achieving desired outcomes and producing the right results.
Performance IndicatorsThe ROI is measured dividing the benefits by the cost of investment. The higher the better of course. It is important to measure it over time to see its evolution, that should go upwards.
Relevant Showcase Dashboard
IT COST BREAKDOWN
Are you able to identify your costs’ breakdown?Knowing how and where you are allocating your money is another of the essential IT KPIs you should track. Breaking down the investments into the different unit levels (software, hardware, SP, personnel) and each of their components (maintenance, infrastructure, development, operations...) will give you a better insight on where the money is spent, and let you identify your main cost drivers as well as opportunities for improvement. That also lets you perform a more accurate financial budgeting and projections. For an optimal budgeting though, it is better if each department makes sure to measure in detail their IT spend.
Performance IndicatorsThe goal of this IT metric is to identify the main cost drivers and analyze them more in details. Try to make it as accurate and detailed as possible.
Relevant Showcase Dashboard
IT COSTS VS. REVENUE
Do you compare your IT expenses to your revenue?The last of our IT KPIs compares the IT expenses to the revenue generated over a year. It is an important metric for tech companies that scale heavily over a short period of time, and witness large revenue increases. Are the costs maintaining the same level of percentage to the revenue? Or are they, as it often happens, growing exponentially (and often enough, uncontrollably)? Such case scenario is not uncommon and impacts negatively on potential profits, and that is why it is important to track this metric and keep it to a steady level. Another scenario would be that with a stagnating revenue, if IT costs steadily increase over time, the impact on profit margins would be unfavorable.
Performance IndicatorsDefine a target range for your IT costs as percentage of revenue, so that you can make profit. If this ratio rises sharply, identify the reasons behind that and if necessary, take action to reduce these costs.
Relevant Showcase Dashboard
TEAM ATTRITION RATE
Do you manage to keep talented employees?Team attrition is a real issue, especially in the technology sector where talents are nevertheless scarce and companies need to develop good offers for candidates that they want to keep in the long run in order to avoid additional recruiting costs. High attrition has a massive impact on organizations, meaning the separation can cost to over 125% of an employee’s salary for companies in the software industry. To keep this number as low as possible, IT leaders need to develop abilities to keep talented employees, and, in order to do so, an IT metric that keeps track of relevant attrition rates through a period of time can certainly help.
Performance IndicatorsOversee the attrition rate over a timeframe and develop strategies together with HR to keep talents in order to avoid potential additional business costs.
Relevant Showcase Dashboard


Setup only takes a few minutes. No credit card required!