
KPI Examples for Facebook
FACEBOOK KEY PERFORMANCE INDICATORS AND METRICS
✔ See different templates & designs ✔ Find & track the right Facebook KPIs to meet your corporate objectives
A Facebook KPI or metric is a performance measurement that is used to track specific details of a Facebook Fan Page, a specific campaign or shared content. These indicators (Impressions, Reach, Engagement e. g.) define the value and success of your company on Facebook.
Here is the complete list of the most important Facebook KPIs and metrics, that we will discuss in this article in every detail:
Number of Fans: Is my number of fans actually important?
Follower Demographics: Where does my audience come from?
Page Views by Sources: How many people have seen my Page?
Actions on Page: What are people exactly doing on my Page?
Reach by Post Type: Which post type works best on Facebook?
Post Engagement Rate: How vital is my Average Engagement rate?
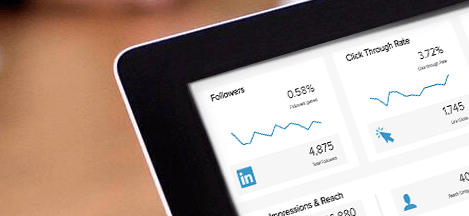
Click-Through-Rate (CTR): What is a good CTR for my Facebook posts?
Ad Impressions & Frequency: How are my ads performing over time?
CPM & CTR of Facebook Ads: How much my campaigns should cost?
Cost per Conversion: Where do you get conversions for the lowest price?
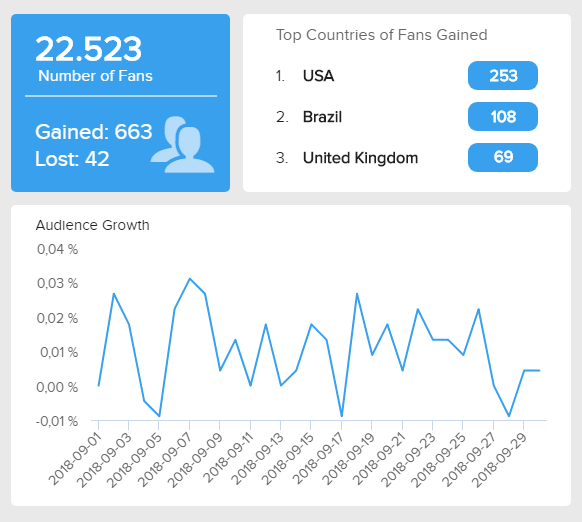
Number of Fans
Is my number of fans actually important?The number of fans your Facebook Page has generated can be an indicator of how well your content is performing. Seeing a significant drop or increment can provide valuable insights into the fluctuation of your content and deliver additional impact on the decision-making process: which content to share and what happens with the numbers. If your fan base predominantly comes from a specific country, then it could be valuable to tailor the content to their specific culture. If you see the total number of fans significantly dropped, this metric can show on which specific day that happened, and what preceded to cause this.
Performance IndicatorsIf you understand how your audience grows, did it expanded or contracted, and were there internal or external causes to these changes, then you can easily adapt your content to increase the number of followers and use this data for future posting.
Relevant Showcase Dashboard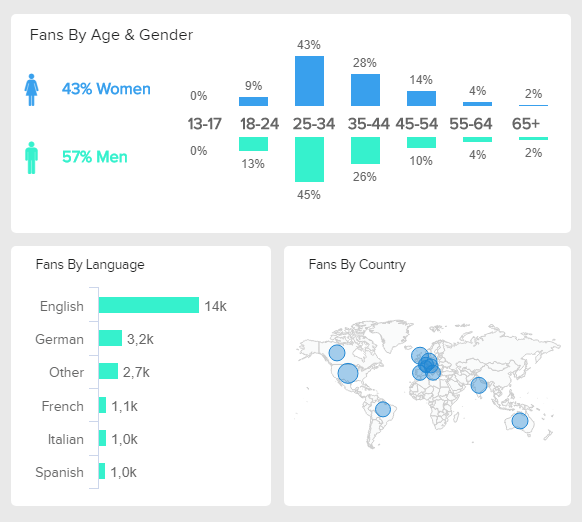
Follower Demographics
Where does my audience come from?Getting to know your audience is one of the most important Facebook KPIs that can define your overall channel strategy. By breaking your follower demographics into Gender, Country, City or Language, you can discover how many of them are engaging or converting with your content (depending on your specific goal) and customize your content to their specific requirements. You can look into the specific language of your audience which can define whether you need to translate your content or write in your mother-tongue. If you see the gender is predominant by women, you should modify your tone of writing to correspond their style.
Performance IndicatorsDetermine the right profile of your followers to understand how to personalize your content and deliver the right type of message. If your findings generate new insights than previously thought, make sure to modify your strategy.
Relevant Showcase Dashboard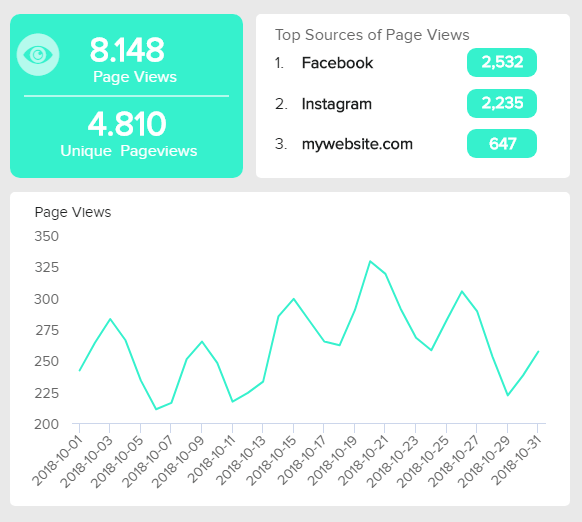
Page Views by Sources
How many people have seen my Page?The Page Views metric can determine from which sources your Facebook Page has been visited and viewed. Additionally, you can track that metric over a specific period to see which channels bring you a higher number of referrals. If your top sources indicate that other social media channels, like Instagram or Twitter, have a higher amount of referrals, you should consider looking more into that specific channel. You can also separate Unique Page Views, meaning the number of single users interacting with your Page to get a clearer insight into your audience. If you see a specific spike on this metric’s dashboard, you can dig deeper to see if your post has been featured on another website.
Performance IndicatorsEvaluate the amount of referring channels and determine the source of traffic that brings the most value to your Facebook Page in relation to your complete social media strategy.
Relevant Showcase Dashboard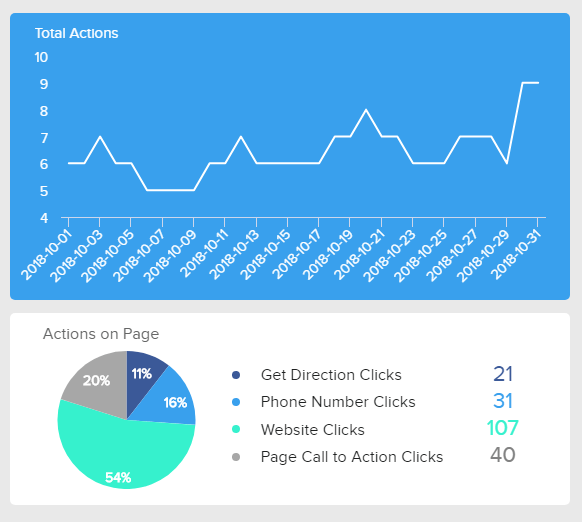
Actions on Page
What are people exactly doing on my Page?One of the most important Facebook metrics to get to know your audience and deliver them the best content possible, is the Actions on Page KPI. This metric shows the exact amount of clicks on your Action Button, Get Directions, Phone Number and Clicked Website. Additionally, it would make sense to filter these insights by age, gender, country, city, and device. The important point to consider is the objective you want to accomplish. The purpose of Actions on Page differentiates if you want your business to be local, nationally, or internationally engaged with, therefore, customize your approach, buttons and see if you’re engaging on a local or global scale.
Performance IndicatorsEstablish which Actions on Page are relevant to your strategy and customize your content to deliver the maximum amount of results. If you’re a local business, increase the Get Directions and Phone Number clicks.
Relevant Showcase Dashboard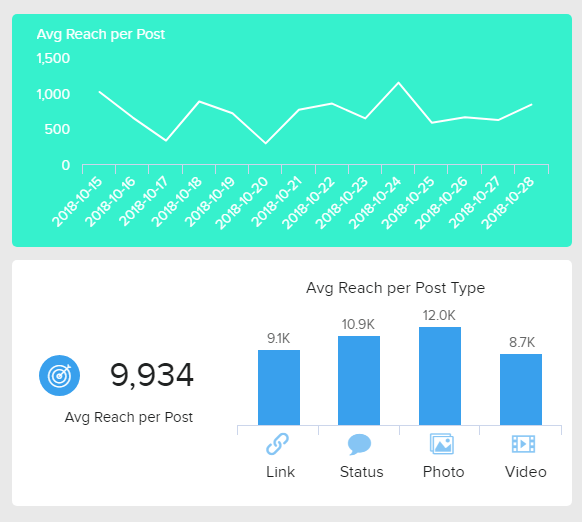
Reach by Post Type
Which post type works best on Facebook?Reach is the number of unique views the Post has received. It is an important metric because you can see how many unique users have seen your content. The Average reach per Post Type number will tell you what kind of content resonates with your audience best: Link, Status, Photo, or Video. You can even see the development of the Average reach over a time-frame. It would make sense to additionally analyze the Impressions (the number of times your page Post is seen) and then also calculate the Frequency – a metric that tells how many times your message is shown to the same audience.
Performance IndicatorsThe more Reach you get, the more people have seen your content, the more awareness you build. Set your date range and compare the average numbers.
Relevant Showcase Dashboard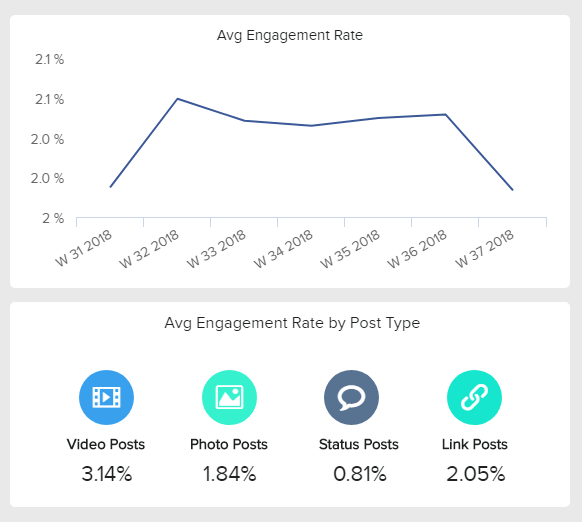
Post Engagement Rate
How vital is my Average Engagement rate?Your Engagement rate is certainly one of the crucial metrics to follow and track on your social media channel. The number of link clicks, comments, likes, and shares can make or break your post value, regardless of the time spent to create and prepare it. This Facebook KPI can be divided by the type of the post, so you can easily spot what kind of production you need to concentrate on: video, photo, written status or link. The Average Engagement rate is presented in percentage of people who saw the post and decided to like, share, click or comment; the higher the percentage, the higher the number of engaged people.
Performance IndicatorsMake sure you know which engagement is important to your business and which post types you need to create and combine for better results.
Relevant Showcase Dashboard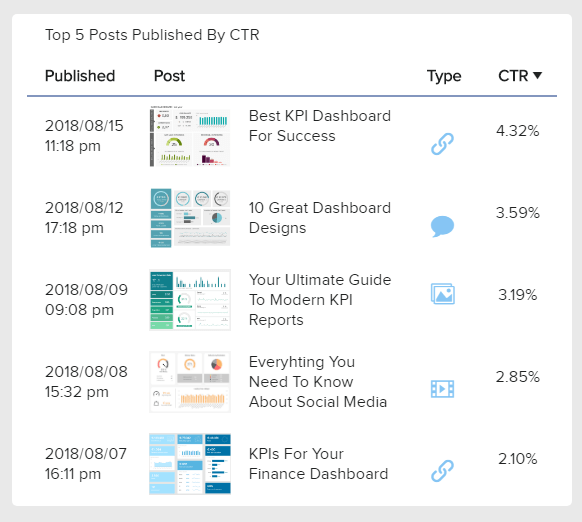
Click-Through-Rate (CTR)
What is a good CTR for my Facebook posts?One of the most common question in Facebook marketing, which is not that simple to answer. Depending on the industry and your overall marketing goal, the CTR can vary. It is calculated as Link clicks divided by Impressions. Multiply that number with 100 and you get your percentage of people who saw your content and actually clicked on it. Usually, organic posts get a higher CTR in comparison to the paid ones. For an organic Newsfeed post a CTR over 5% is good, and for a paid Newsfeed post 1.5% is quite good. If your CTR starts to drop, ask yourself which metrics and tactics you need to change and adjust to make sure you perform better.
Performance IndicatorsIdentify your industry benchmarks, perform analysis of your top posts and detect what your audience is clicking through, so you can implement those findings in future posts.
Relevant Showcase DashboardBecome a data wizard in less than 1 hour!
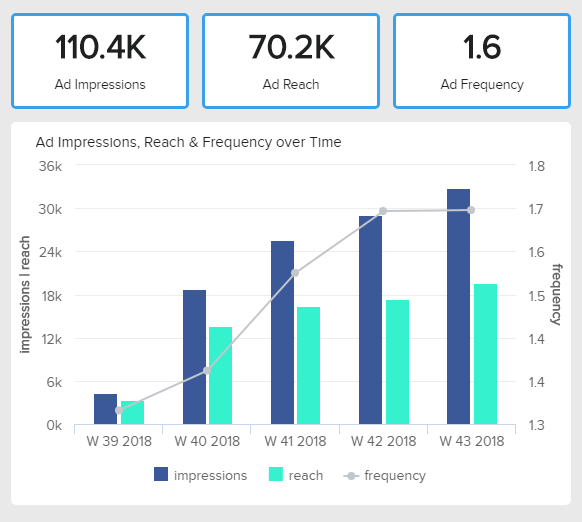
Ad Impressions & Frequency
How are my ads performing over time?Facebook metrics examples which indicate how your ads are performing during a certain period can be evaluated by the number of Impressions, Reach and Frequency. Impressions will let you know how many times your ads were displayed, Reach will demonstrate how many unique people have seen your ads, and Frequency is simply impressions divided by reach. In practice, that means if your ad had 50.000 impressions, reached 25.000 people, your frequency will be 2. If your ad was seen more than 4 times by the same user, it would certainly cause the drop in the CTR, and the chance to convert those users would be much lower.
Performance IndicatorsMonitor frequency to make sure the same people aren’t seeing your ad too often, which can cause audience’s fatigue, so a wise move would be to change your targeting or creative.
Relevant Showcase Dashboard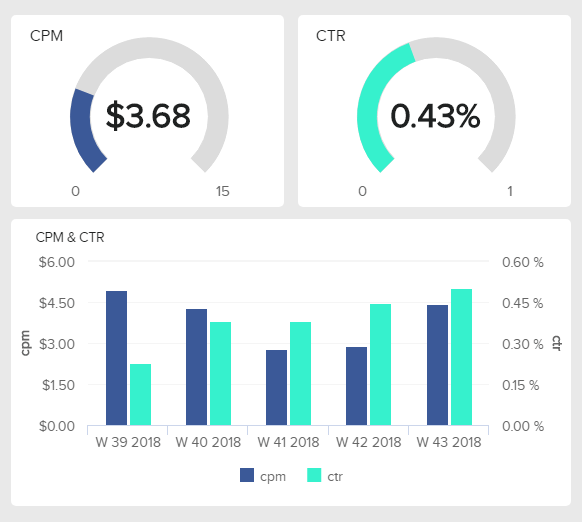
CPM & CTR of Facebook Ads
How much my campaigns should cost?The cost of your campaigns is the most crucial part of your overall social media strategy. It all goes down to the simple question: how much should I invest to get as much as possible from my ads? The CPM and CTR metrics will differ a lot by targeting and placement. If you pay by Impressions, of course, you want to have the best possible CTR, as this will decrease your click price. Your decision is usually a trade-off between a really specific targeting (high CPM and higher CTR) or a broad one (lower CPM and lower CTR). Consider also the benchmark data from your respective business.
Performance IndicatorsMeasure each performance conjointly and compare your results over a set time frame.
Relevant Showcase Dashboard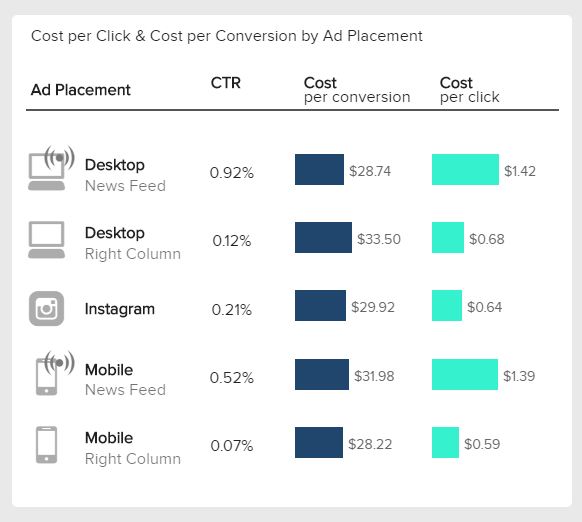
Cost per Conversion
Where do you get conversions for the lowest price?Conversions are the main goal of a social media marketing strategy. You want your audiences to perform a specific action, and no matter how good other Facebook KPI examples which we have mentioned are performing, you won’t get a positive ROI if conversions don’t happen. Test different Placements and see the percentage of CTR and the CPC you gain. However, there is a possibility that the lower CPC has the higher Cost-Per-Conversion, as this traffic can convert on a poorer level, depending on the Ad Placement. It can happen that the Right Column has a lower CPC, but, in the end, a higher Cost-Per-Conversion.
Performance IndicatorsDifferentiate ad placements, calculate each KPI and conclude which fusion of metrics brings you the most relevant results.
Relevant Showcase Dashboard


Setup only takes a few minutes. No credit card required!