
Online Data Analysis Tool – Easily Analyze and Visualize your data on-the-fly
- Execute even complex data analysis with a few clicks without profound SQL knowledge
- Easily generate stunning charts and dashboards out of your data using our graphical drag-and-drop interface
- Share new insights using automatic reporting guidelines
DATAPINE – ONE OF THE BEST ONLINE DATA ANALYSIS TOOLS
What are the benefits of online data analysis?
Online data analysis is the process of managing, analyzing, visualizing, and monitoring datasets from various sources while enabling online, on-the-go access to all the business information an organization or company needs to generate actionable insights.
As data analytics are now an integral part of business life, more and more companies elaborate strategies to manage their data effectively and make the most out of it. In today’s fast-paced business world, smart online data analysis tools are essential to manage a business successfully. We have never been exposed to as much information as we are today, nor have we ever been exposed to so much data collection. Raw data makes up an increasing part of any business; it can no longer be ignored and needs to be dealt with efficiently. This is why, at datapine, we decided to help companies reveal their full data potential through these powerful features and benefits of online data analysis:
Manage and visualize your metrics instantly: With the increasing global competition and customer demands from all over the world, you’ll need to know how to push your company forward and find out which parts of your business are lagging. In this ever-changing context, online analysis tools will be great allies to help you manage and visualize your business’s key metrics in the most efficient and fastest way. Data can now be accessed from remote locations, executives can make decisions based on a complete online experience without the need to be present in the office, and attractive graphics and visualizations can provide instant access to clear and simple reports through the power of online BI.
Visualize data from multiple sources: We live in a data-driven era in which businesses extract huge amounts of information from several sources every day. Getting all that data together to extract the business insights needed to succeed in this crowded market is not an easy task. For that purpose, online data analysis tools include powerful data connectors that allow you to integrate all your internal and external data sources into one single point of access. Connect databases such as MySQL, Oracle, Amazon, CRM systems, third-party data providers, or simple flat files with just a few clicks and merge all your relevant data into one place. Once your sources have been connected, the tool will automatically update the data so you can constantly extract fresh insights that will empower your company in every way.
Access real-time data anytime, anywhere: The online aspect of analysis tools is a feature you should not miss. State-of-the-art Software-as-a-Service (SaaS) solutions enable you to access your analysis results, dashboards, reports, and anything you are working on, at any time and from anywhere. Such flexibility and accessibility are a great advantage in a world where information circulates faster than ever before. Modern SaaS BI tools always offer you the latest version of your data to help you be up to date, avoiding manual reporting and never-ending analyses.
Utilize full-service solutions: In this environment where the correct information and insights are the key to success for a company, investing in an easy-to-use tool at your fingertips is crucial to surviving in the business world. Whether you need performance reports, or sales figures, want numbers from last week, data from last year, or a prediction of the numbers for the next quarter, you’ll need trusted tools to analyze data to be able to make the right decisions. An important feature is offering a full-service BI solution encompassing all aspects of data management, such as advanced and basic analytical features, interactive data visualizations, and live dashboards that put accessible, readable, and actionable data at your fingertips.
Make data accessible and boost communication: Expanding on the previous point, the true value of a modern self-service data analyzer is the fact that it opens the analytical world to every single employee. Thanks to an intuitive, user-friendly interface, technical and non-technical users alike can use data to inform their decisions and communicate their progress to other areas and departments. Keeping everyone connected and working towards the same company goals.
Take charge of your outcomes: Online analysis tools enable you to be in charge of the entire analytical process and, therefore, make better and insightful data-driven business decisions at speed. Your managers and BI teams will appreciate this straightforward process – a humongous amount of data generated and delivered in just a few minutes. With better results, faster reporting, flexible design possibilities, and adjustment to your own needs, smart business solutions have never been so easy to implement.
Make the most out of your resources: Making decisions based on intuition can cost the organization time and money in implementing the wrong strategies. Modern analytics tools give you the necessary knowledge to build strategies based on your own performance, company needs, and audience. In time, this will not only save time in fixing errors but will also ensure that the monetary resources are spent on boosting the company’s growth and standing out from competitors.
By reviewing historical trends, tracking current performance, and making predictions for the future, businesses can now use online data analysis to make more accurate real-time decisions that will help to streamline business operations, improve workflows, and increase profits.

Become a data wizard in less than 1 hour!

Get started with online data analysis tools
Online data analysis and tools must answer the crucial need businesses face today: leveraging all the data they produce and turning it into actionable insights that will benefit them long-term. To help you get started, here we present some tips to consider when choosing a data analyzer for your business:
Simplify as much as you can: Managing the data you gather and accumulate day after day can be a challenging task, but missing the opportunity to exploit it and leaving this compelling source of knowledge untapped would be a great loss for the future of your business. A self-service BI tool enables everyone to explore, analyze and visualize data without profound technological knowledge. The flexibility online data analytics tools offer is unrivaled. They let you be, at the same time, an information consumer, and an analytics producer without requiring an extremely sharp knowledge of IT.
Translate data for everyone: Whether you need an MySQL report builder that your colleagues can also get on board with or simply want a reliable and robust data analyzer that speaks your language, the tool you choose must have diverse options. It needs to be developed as a dynamic and intuitive online data analysis software for ease of use. Our work with organizations across the globe has shown that for data to be useful, it needs to be accessible and understandable to relevant decision-makers as well as anyone in the organization that needs to work with the data.
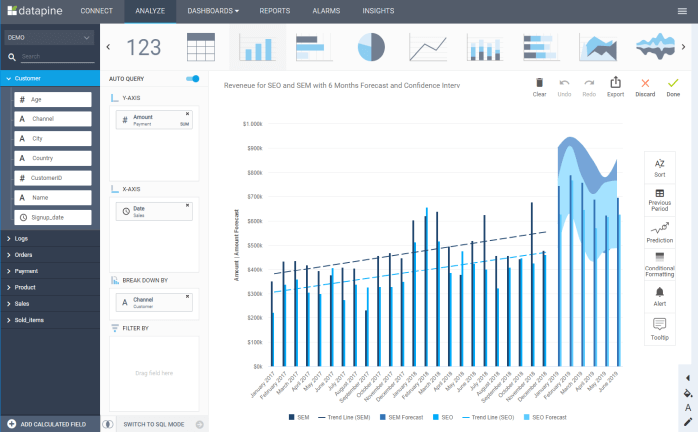
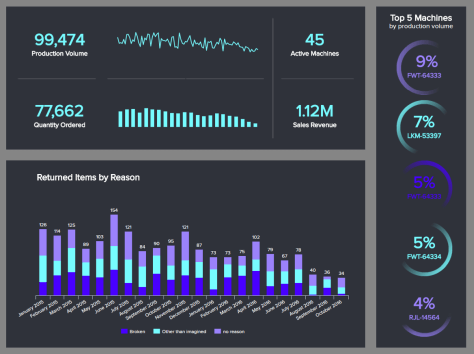
Dive into visual analytics: One of the greatest values of modern data analysis is using data visualizations to bring your data to life. Our professional software offers users over 25+ chart types to visualize your most important KPIs in an interactive way. This is an invaluable benefit as humans process visual information way faster than numbers or text, making graphs and charts your best weapon to keep your audience engaged with the data.
Look for ease of use: A single solution should encompass a range of data analysis options, such as automatically running SQL queries, data visualization, dashboarding, and KPI reporting, which you can simply achieve via an intuitive drag-and-drop interface. The drag-and-drop function is the first stage in making your data work harder for you by allowing you to easily build database queries on your own without requiring any SQL experience. This drag-and-drop approach frees you from the IT department’s timetable and puts data analysis firmly back in your own hands. Without waiting for the IT department to query databases and create your reports, you’re free to use your data as and when you need it.
Take advantage of customization: In the past, businesses have often hit stumbling blocks when it comes to analyzing their data using complex software, with extensive set-up processes, a pre-requisite knowledge of technical codes and SQL commands, and a lengthy wait for the report to be generated. Thus, it is no wonder businesses were not making the most out of the data they generated. Thanks to modern BI solutions, anyone can analyze and visualize data with an intuitive user interface and create dynamic dashboards with a modern dashboard creator. You can now easily create and customize interactive business dashboards on your own, that produce automated reports sent to the right people, without requiring you to do it all manually, nor requiring you to do it via a third party.
Create your own data story: Data analysis processes of the past couldn’t include interactive visualizations or provide deep data exploration just by looking at a single desktop screen since the technology wasn’t as advanced as today. Data exploration has enabled users to conduct deep analysis without the need for endless research or multiple spreadsheets dispersed across departments. Modern online data analysis software facilitates this notion by providing possibilities to create your own data story, filtering out what’s not important, and helping you understand the business context of a particular issue. With the help of professional business intelligence dashboards, your story can now be told in ways that weren’t previously possible, enabling you to test new hypotheses faster than ever.
Make flexibility your top requirement: Businesses change often and fast. To be able to keep up with those changes, online analysis tools must provide scalable options to meet your requirements. Sometimes you will need ad hoc analysis, and sometimes you will need to provide recommendations for an extensive business strategy and share those insights with your department. The possibility of conducting everything you need just from your mobile phone, tablet, or desktop, and fully online brings another level of flexibility we couldn’t imagine before. You should be able to look for this flexibility on any data analyzer you need for your company or department.
Don’t forget AI and predictive analytics: Data management has never been easier, as self-service analytical tools provide businesses with astonishing possibilities. A modern data analyzer can take you even further by providing advanced technologies such as Artificial Intelligence features and predictive analytics that will give you that much-wanted competitive advantage. On the one hand, AI technologies such as data alerts will use neural networks to learn from trends and patterns in your data and notify you if any anomalies are found. On the other hand, predictive analytics gives you a glance into the future by taking historical data to predict a possible outcome in your performance. This way, your online data analysis process will be easier, automated, and more efficient than ever.
If you consider all the tips we mentioned, your productivity and data quality will increase. Business information is no longer spread across many systems or spreadsheets, which, in the past, increased the risk of errors and poor interpretation. Now, a single place for data visibility can empower any business user to extract, evaluate and present data. Sending a report request down to IT can now be a thing of the past with professional online analysis tools.
Enjoy the flexibility of datapine’s online data analysis tool 14 days for free
As one of the best data analysis tools, datapine returns the power of your data to you by making it easy to keep all decision-makers and stakeholders up to date in the reporting process. Reports can also be automated so that everyone who needs to be on the same page as you can be. There is no need to recreate dashboards or setup charts twice and no need to set any reminders; datapine’s single solution is packed with various analysis functions and options that will do the hard work for you.
datapine’s dashboard designer software also allows users to customize their dashboards to meet individual needs. Not concerned with net profit? Want to generate location-based reports instead? Create your own metrics to measure performance in the way you see fit. Intuitive drag-and-drop functionality means that users can edit their dashboards in a matter of seconds. This brings the data they want to monitor to prominence, allowing them to focus on analysis without sorting through reams of facts and figures.
With datapine, you are the master and owner of your business intelligence. You no longer rely entirely on your IT teams to produce BI reports and dashboards, and can access your data from anywhere, with the security level you expect. Indeed, our servers are subjected to some of the strictest data security laws in the world, so you remain the only proprietor of your data, while our servers are highly protected 24/7. You can safely connect your databases to datapine and work remotely, grant access to other co-workers, and enjoy the flexibility that online data analysis tools put at your disposal.
Our online dashboard tool allows you to run your data analysis online and access all of your dashboards from any device. Just log on to any internet-enabled device to take your office and your required tools or reports directly with you, wherever you may be. Mobile access has never been so simple, especially with our carefully curated app that can bring your datasets in one, mobile roof.
Want to see how datapine beats any other online data analytics tool you may have tried? Sign up for our free 14-day trial and see how datapine will change your business.


We were amazed how easy it was to use datapine and get the first KPIs within a couple of minutes. datapine is definitively a game changer for us as now all decision makers have quick, easy access to ad hoc analysis, KPI dashboards and reports.Sebastian Diemer, Founder at KreditechGO TO PRODUCT OVERVIEW
Become a data wizard in less than 1 hour!