
Top 23 Financial KPI Examples
Financial Key Performance Indicators and Metrics
✔ See different templates & designs ✔ Find & track the right finance KPIs to meet your corporate objectives
A financial KPI or metric is a measurable value that indicates a company’s financial performance and provides information about expenses, sales, profit, and cash flow, in order to optimize and achieve a business’ financial goals and objectives.
The financial sector needs to regularly track, monitor, and analyze a company’s performance to keep a healthy status and avoid monetary bottlenecks. That’s why financial metrics have a special significance in every company, and the team that deals with them, needs proper dashboard reporting to manage and optimize those processes effectively. With the help of our list, you can create a complete financial dashboard that will enable you to interact with each metric and automate most of your reporting and analysis processes. By implementing these KPIs through the power of financial business intelligence, you can make your financial data and insights better, more informative, and easier to manage.
Here is the complete list of the top 23 finance KPIs and metrics, that every financial professional needs to know:
Gross Profit Margin: How much revenue you have left after COGS?
Operating Profit Margin: How is your EBIT developing over time?
Operating Expense Ratio: How do you optimize your operating expenses?
Fixed Operating Expenses: What are the fixed costs of your operations?
Variable Operating Expenses: What are the highest variable costs?
Operating Expenses Development: How are your operating costs developing?
Net Profit Margin: How well your company increases its net profit?
Working Capital: Is your company in stable financial health?
Current Ratio: Can you pay your short-term obligations?
Quick Ratio / Acid Test: Is your company’s liquidity healthy?
Berry Ratio: Are you losing money or generating profit?
Cash Conversion Cycle: How fast can you convert resources into cash?
Accounts Payable Turnover: Are you paying expenses at a reasonable speed?
Accounts Receivable Turnover: How quickly do you collect payments?
Vendor Payment Error Rate: Are you processing your invoices productively?
Budget Variance: Is your budgeting accurate and realistic?
Actual vs Forecast Expenses: Are you meeting your expected costs?
Actual vs Forecast Income: Are you reaching your expected revenue?
Return on Assets: Do you utilize your company’s assets efficiently?
Return on Equity: How much profit do you generate for shareholders?
Economic Value Added: Do you generate true economic profit?
Employee Satisfaction: Will your team recommend you as a workplace?
Payroll Headcount Ratio: How do you utilize your labor force?
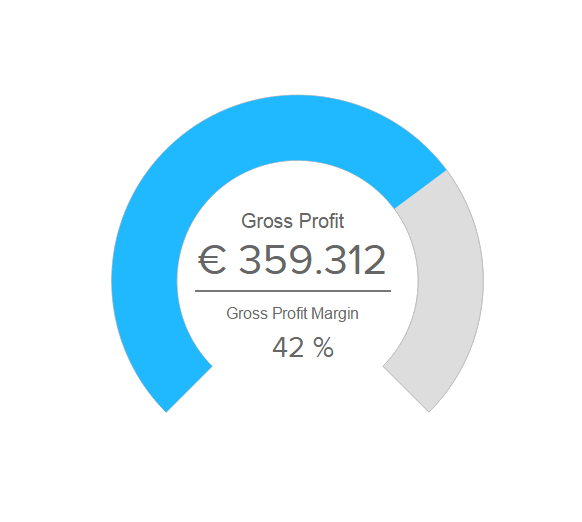
GROSS PROFIT MARGIN
How much revenue you have left after COGS?This financial KPI refers to your total revenue minus the cost of goods sold (COGS) or service delivered, divided by your total sales revenue. It signifies the percentage of total sales revenue that you keep after accounting for all direct costs associated with producing your goods and is an important measure of your company’s production efficiency. Direct costs include the price of materials and labor but exclude others, such as distribution and rent. Let’s look at an example: If your gross profit margin last year was 40%, you would keep 40 cents out of every dollar earned and put it towards running your company by taking care of administration costs, marketing costs, and rent, among others.
Performance IndicatorsThe higher the gross profit margin you manage to acquire, the more income you retain from each dollar of your sales.
Relevant Showcase Dashboard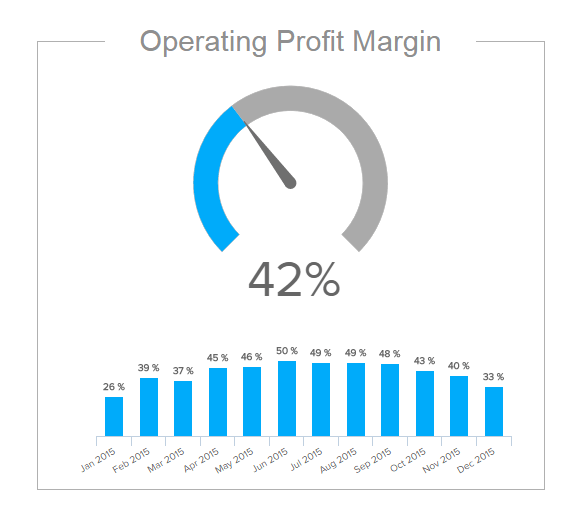
OPERATING PROFIT MARGIN
How is your EBIT developing over time?This financial KPI template shows the operating profit margin, also known as “earnings before interest and tax” (EBIT), as a percentage of total revenue earned. It does not include any revenue earned from the firm's investments or the effects of taxes. It is calculated by dividing operating profit by your sales revenue. The operating profit margin measures how profitable your business model is and indicates what is left over from your revenue after paying for all operational costs. This can easily be done by using financial analytics software that can automate your calculations.
Performance IndicatorsThe higher the operating income, the more profitable your company will be. If this number is declining, then you need to quickly identify the reasons and take action.
Relevant Showcase Dashboard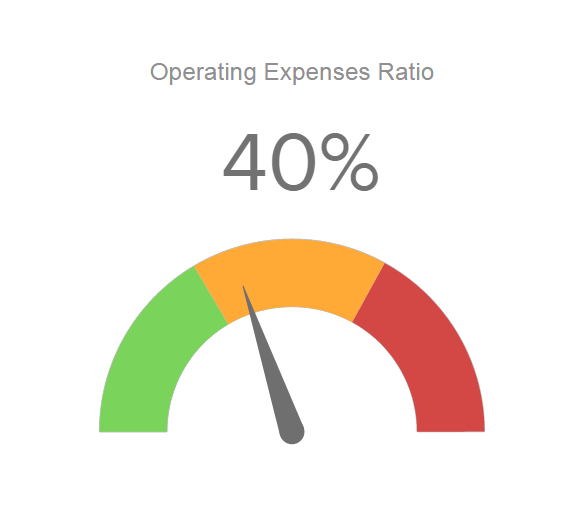
OPERATING EXPENSE RATIO
How do you optimize your operating expenses?One of our next finance KPI examples, the operating expense ratio (OER), shows your company’s operational efficiency by comparing operational expenses (the cost associated with running your core operations) to your total revenue. The lower your company's operational expenses (OpEx) are, the more profitable your company will be. With modern KPI dashboards, you can easily analyze and track your operating costs in detail. These breakdowns are also useful when benchmarking your company against other organizations. As these numbers vary wildly by industry, when benchmarking please make sure to survey companies in a similar field. Investors are often interested in the OER to specifically examine how high your operating costs are in relation to generated revenue.
Performance IndicatorsOver time, changes in your company’s OER should inform you whether or not your company is scalable. Can you increase sales without increasing operational costs?
Relevant Showcase Dashboard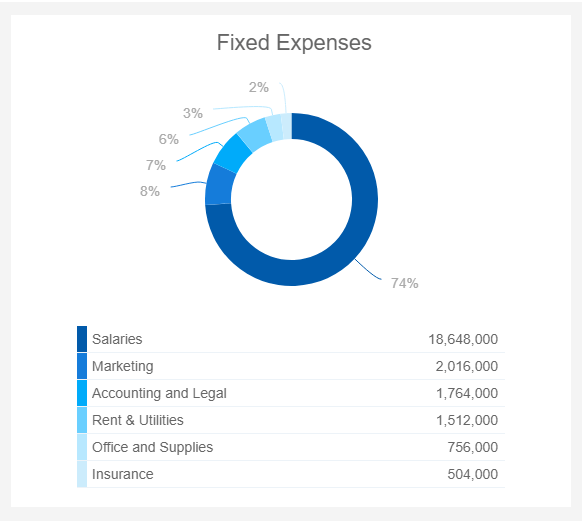
FIXED OPERATING EXPENSES
What are the fixed costs of your operations?This financial KPI shows a breakdown of fixed or indirect expenses. These are all costs that need to be mandatorily paid during a specific period and are not subjected to the company’s production level. Meaning, even if the company doesn’t produce or sell a single product or service, they still need to be paid. Examples include rent, salaries, fixed marketing costs, office supplies, and insurance, among others. Given that fixed expenses are often hard to be decreased, they often present a challenge for organizations. In that sense, it is important to keep a close eye on them to ensure they don’t go up too much, as they otherwise cut into a substantial portion of a business’s total profitability.
Performance IndicatorsUse your fixed OpEx to accurately plan budgeting and implement cost-saving strategies where possible.
Relevant Showcase Dashboard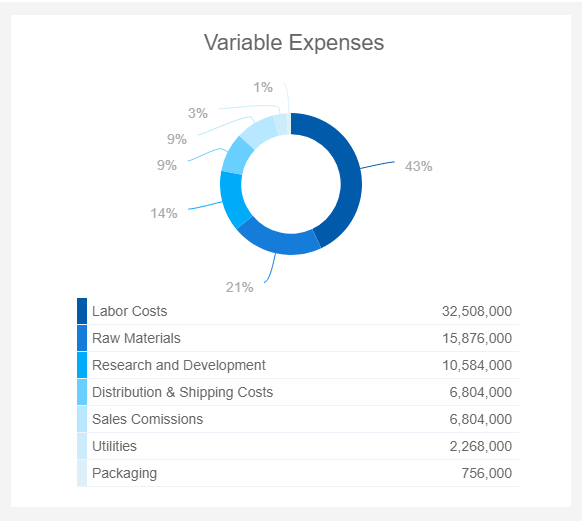
VARIABLE OPERATING EXPENSES
What are the highest variable costs?Moving on from fixed OpEx, we will look into variable or direct ones. These are all costs that are direct and proportional to the company’s production level. Hence, they increase as production increases and decrease when production decreases. Unlike fixed costs, which are often hard to decrease, variables are easily manageable and the first to be adjusted if a company suffers from cash flow issues. Plus, efficient variable expense analysis allows decision-makers to efficiently define product pricing based on the expected revenue they want to collect, as well as plan budgeting and other growth strategies. Examples of variable costs will vary from industry to industry but most commonly consider labor costs, raw materials, variable marketing costs, sales commissions, packaging, and utilities, to name a few.
Performance IndicatorsTrack your variable and fixed expenses together to get deeper insights into the profitability of your organization.
Relevant Showcase Dashboard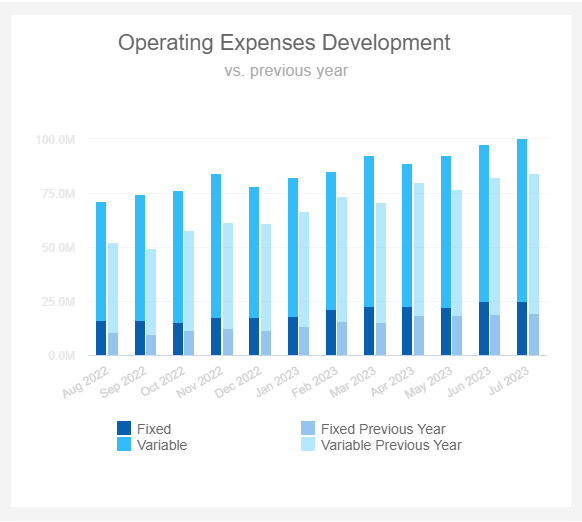
OPERATING EXPENSES DEVELOPMENT
Are your cost-decreasing strategies successful?This finance KPI shows the monthly development of fixed and variable expenses compared to the previous year's performance. As mentioned in the last expense-related examples, costs influence substantially a company’s total profitability. Therefore, closely monitoring their development and extracting trends and patterns from the analysis can help you spot improvement opportunities as well as generate cost-saving strategies to boost profitability. The column chart above shows that this business’s OpEx development is higher than the previous year. This could either mean that the company is producing more and the increases are justified, or something is going on and needs to be looked at.
Performance IndicatorsThe end goal should be to keep your expenses as low as possible without affecting quality and profitability.
Relevant Showcase Dashboard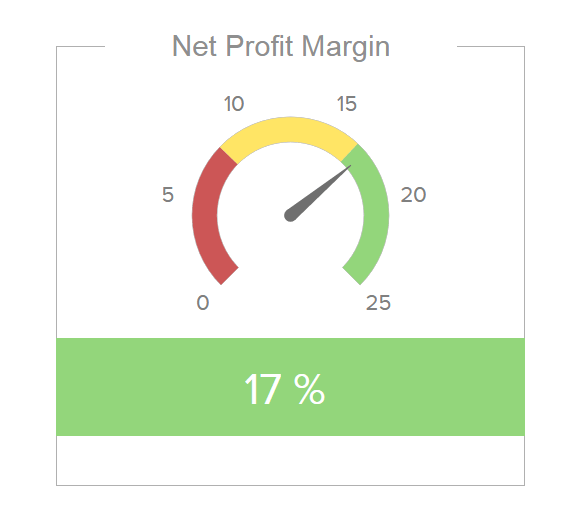
NET PROFIT MARGIN
How well your company increases its net profit?Net profit margin measures your profit after subtracting all operating expenses, depreciation, interest and taxes divided by the total revenue (net income x 100 / total revenue). The net profit margin is one of the most closely tracked KPIs in finance. It measures how well your company does at turning revenue into profits. As a percentage of sales, not an absolute number, it is often used to compare different companies and see which of them are most effective at converting sales into a profit.
Performance IndicatorsThe higher your net profit margin, the better off you are. Review any decline with a fine-toothed comb to fix any problems from decreased sales to unsatisfied customers ASAP.
Relevant Showcase Dashboard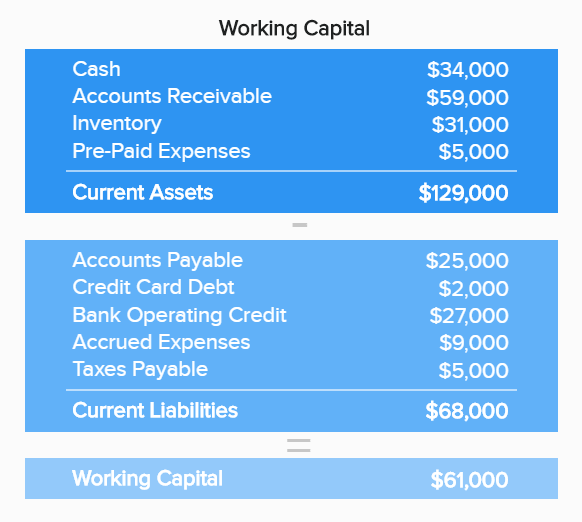
WORKING CAPITAL
Is your company in stable financial health?The top financial KPIs wouldn’t be complete without the working capital. This KPI is not a ratio or proportion, but solely the number of dollars remaining after you subtract your current liabilities from current assets, which include your cash, inventory, accounts receivable or prepaid expenses, etc., and empowers you to pay for ongoing OpEx and fund standard business operations. On the other hand, current liabilities represent all the obligations or debts that are due within 12 months. That can include accounts payable, bank operating credit, accrued expenses, taxes payable, etc. This is one of our KPI examples that illustrates a company’s operational efficiency and short-term financial health, which is important in financial reporting and analysis.
Performance IndicatorsHigh working capital doesn’t automatically mean the company is performing extremely well. It can also mean that it is not investing the excess cash.
Relevant Showcase Dashboard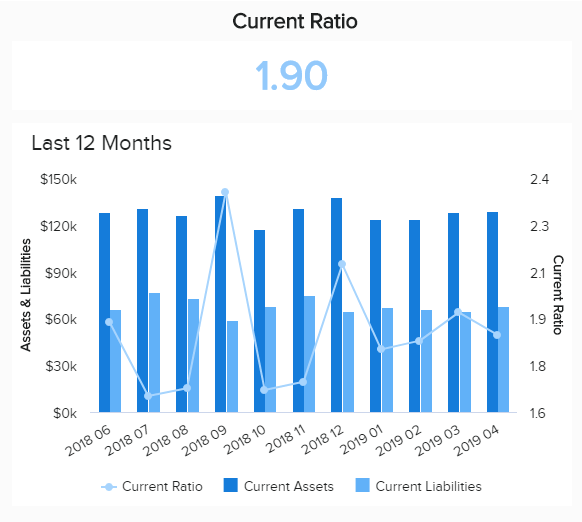
CURRENT RATIO
Can you pay your short-term obligations?We have included the current ratio as one of the top financial KPI templates concentrating on liquidity. It measures your ability to pay your obligations in the short-term, often within 12 months. Unlike other liquidity ratios, this one includes all current assets and liabilities. It is calculated by dividing your current assets (such as cash, accounts receivable, inventory, and prepaid expenses) by your current liabilities (accounts payable, credit card debt, bank operating credit, taxes, etc.). The goal is to have a ratio higher than 1. If it’s lower, you would be unable to pay off your obligations if they were suddenly due. This metric is a key indicator of a company’s short-term financial health and shows whether you are able to collect accounts due in a reasonable amount of time.
Performance IndicatorsThe higher your current ratio, the more capable you are of paying your bills in the short-term. Banks often recommend a current ratio higher than 2.
Relevant Showcase Dashboard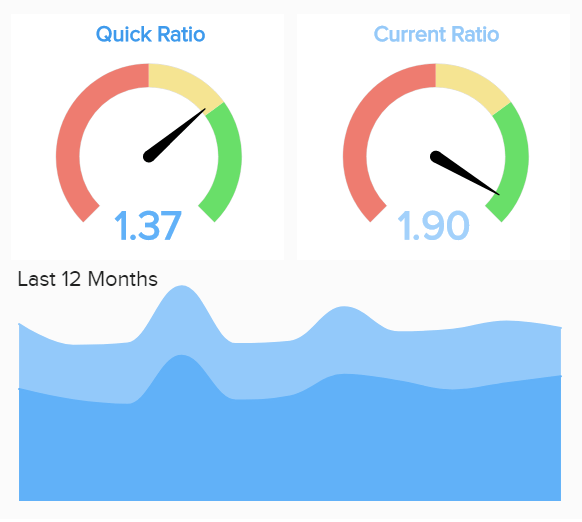
QUICK RATIO / ACID TEST
Is your company’s liquidity healthy?We continue our finance KPI examples with the quick ratio. This metric considers just the short-term liquidity positions (the so-called near-cash assets) that you can convert into cash quickly. It is much more conservative about the assets since it doesn’t include all of them. It is also known as the acid test ratio, as it produces instant results. This KPI also expounds on the liquidity of a company, but it should consider assets that can be easily converted into cash, usually within 90 days or so, such as accounts receivable.
Performance IndicatorsThe higher the ratio, the better your liquidity and financial health. Compared to the current ratio, your quick ratio will always be smaller, because it includes near-cash assets. Your goal should be to have at minimum a quick ratio of 1,0.
Relevant Showcase Dashboard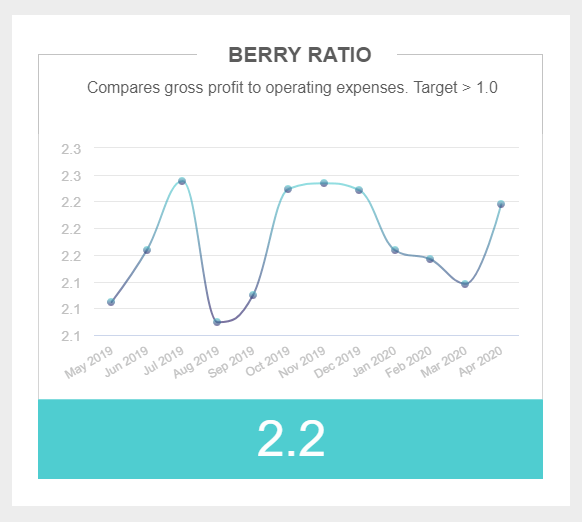
BERRY RATIO
Are you losing money or generating profit?Our list of the most important financial key performance indicators wouldn’t be complete without the berry ratio. This metric compares the company’s gross profit with its OpEx, and you can use it to indicate the profit in a specific time period. If the coefficient is above 1, it means that your company is making a profit above all variable expenses, while a coefficient below 1 will indicate that your company is losing money. Therefore, it would make sense to look into this metric over a timeframe in order to monitor if the performance starts to drop. In our example, we can see that the ratio is above 2, which means that the company is generating a healthy amount of profit.
Performance IndicatorsTrack this metric over a set timeframe and ensure your coefficient stays above 1 in order to keep generating profit against variable costs.
Relevant Showcase Dashboard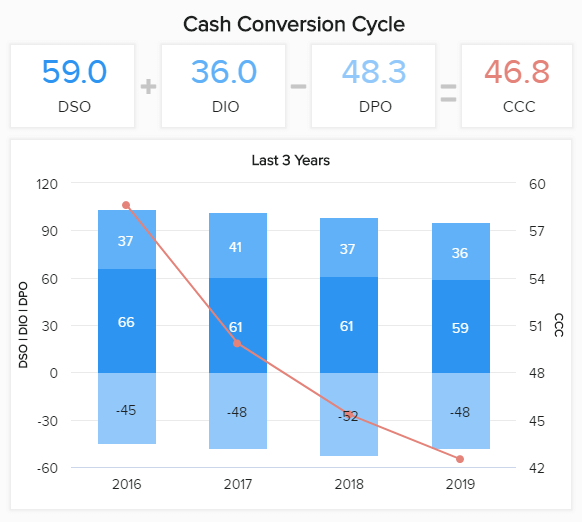
CASH CONVERSION CYCLE
How fast can you convert resources into cash?The cash conversion cycle (or CCC) is a quantitative measure that helps to evaluate how efficient a company’s operations and management processes are. It basically measures how long it takes for a company to convert its inventory investments and other resources into cash flows from sales. The mathematical formula for calculating CCC = DIO (days of inventory outstanding) + DSO (days sales outstanding) – DPO (days payable outstanding). A steady or decreasing CCC is a fairly good sign, but if it starts to rise, additional analysis should be made. It also differs across industries based on the nature of business operations.
Performance IndicatorsIf a company efficiently manages the requirements of the market and its customers, the cash conversion cycle will have a lower value.
Relevant Showcase Dashboard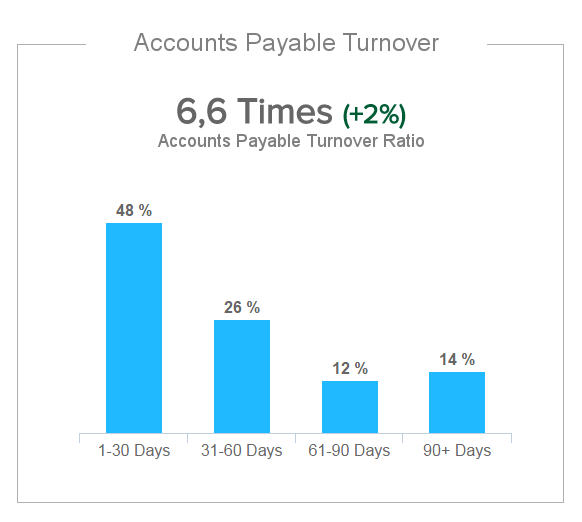
ACCOUNTS PAYABLE TURNOVER
Are you paying expenses at a reasonable speed?Accounts payable turnover is a short-term liquidity financial metric and shows how quickly you pay off suppliers and other bills. It is derived from your total vendor purchases, divided by your average accounts payable, over a set period (total supplier purchases / avg. accounts payable). In other words, the accounts payable turnover ratio indicates how many times a company can pay off its average accounts payable balance during the course of a defined period, such as one year. For example, if your company purchases $10 million worth of goods in a year, and holds average accounts payable of $2 million, the ratio would be five. If your accounts payable turnover ratio is increasing, it means that you are paying your suppliers at a faster rate. The opposite would be the case when the turnover ratio is decreasing.
Performance IndicatorsA higher ratio shows suppliers and creditors that your company pays its bills frequently and facilitates when negotiating a credit line with a supplier. On the other hand, paying your bills fast reduces your available cash.
Relevant Showcase Dashboard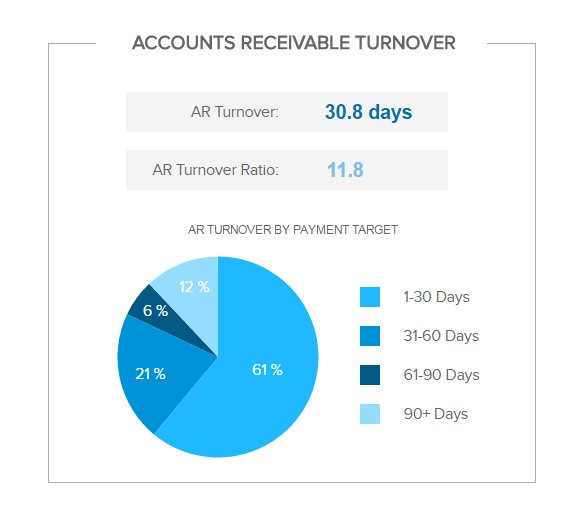
ACCOUNTS RECEIVABLE TURNOVER
How quickly do you collect payments?Our next KPI for finance is the accounts receivable turnover, which measures how quickly you collect your payments owed and displays a company’s effectiveness in extending credits. This KPI measures the number of times a company can collect its average accounts receivable and is calculated by dividing the amount of all supplier purchases by the average amount of accounts receivable for a given period. The faster your company can turn credit sales into cash, the higher your liquidity. A low accounts receivable turnover ratio signifies a need to revise the company’s credit policies to ensure a more timely collection of payments.
Performance IndicatorsThe higher the accounts receivable turnover ratio, the better and the more liquidity you have available to finance your short-term liabilities.
Relevant Showcase DashboardBecome a data wizard in less than 1 hour!
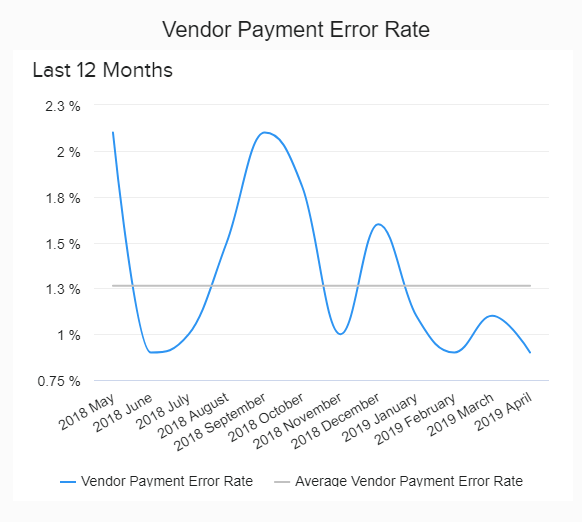
VENDOR PAYMENT ERROR RATE
Are you processing your invoices productively?This is one of our financial KPI templates that focuses on the company’s diligence in issuing and paying vendor’s (creditors, suppliers) invoices. These errors may include payments made to the wrong entity, underpayments or overpayments, and fundamentally, it shows if the company has a stable accounts payable department. It is calculated with the total number of payments that contained an error divided by the total number of transactions over a period of time and expressed as a percentage. The goal is to keep this percentage as low as possible and deliver accurate and timely invoices (and payments). This will create stronger partnerships between companies.
Performance IndicatorsA high percentage of the error rate clearly indicates that the controlling of procurement functions lacks efficiency. This can lead to vendor disputes.
Relevant Showcase Dashboard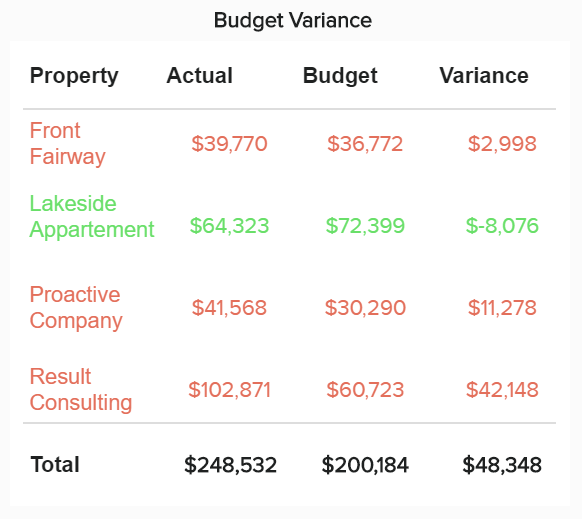
BUDGET VARIANCE
Is your budgeting accurate and realistic?The budget variance is one of our next financial KPI examples which expresses the difference between budgeted and actual figures for a specific accounting category. It can be favorable or unfavorable, each caused by various internal and external factors such as labor costs, poorly planned budget, natural disasters, changing business conditions, etc. The goal is to keep the revenue that comes in higher than budgeted, or costs lower than originally predicted. That would ensure a greater income than expected. On the other hand, if revenues fall short of the budgeted amounts, expenses get higher, and the variance becomes unfavorable.
Performance IndicatorsKeep your budgeting and assumptions as realistic and accurate as possible to avoid unfavorable budget variances and, consequently, increase your expenses.
Relevant Showcase Dashboard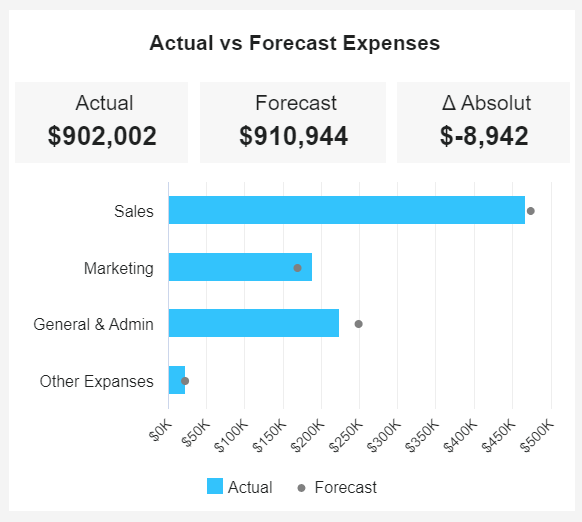
Actual vs Forecast Expenses
Are you meeting your expected costs?Next in our list of professional financial KPIs we have the actual vs forecast costs. As seen in the image on the left, this indicator tracks the actual value of all costs (operational, COGS, and taxes) and compares it to a forecasted amount. It is an invaluable metric to track, as overspending can significantly damage a business’s profitability in the long-term. Therefore, tracking it closely and against a forecasted amount, allows organizations to efficiently identify roadblocks as well as opportunities to optimize their cost-strategies. Additionally, using forecasting in the initial stages of cost-planning is a great way to allocate resources smartly to achieve the organization’s financial goals.
Performance IndicatorsUpdate your forecasts regularly to adapt to changing market and organizational conditions. This way, you’ll avoid sticking to a single truth that might not be up to date.
Relevant Showcase Dashboard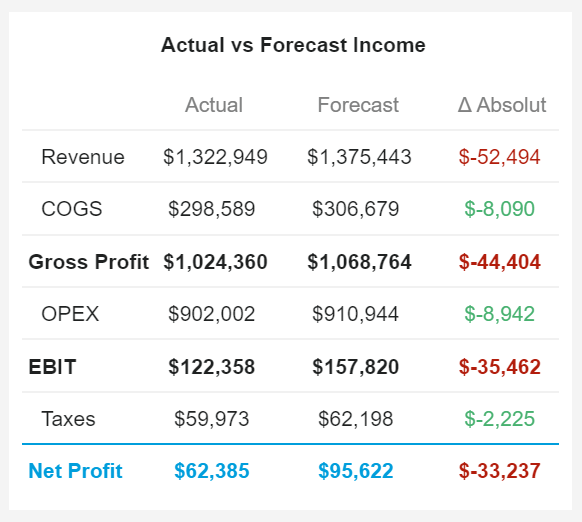
Actual vs Forecast Income
Are you reaching your expected revenue?Just like our previous example, this KPI tracks the actual vs. forecasted income to understand if the initial expectations are being met or if there is something that needs to be optimized to stay on track with company goals. Forecasting income is a valuable practice as it estimates how much money the company will bring in the coming fiscal year, how much spending will be necessary, and potential margins they will keep from it. Our example on the right, is a small version of an income statement, including the subtraction of all relevant costs from the expected revenue. Here, we can see that this business has a high, negative difference in the net profit which could mean something is wrong with their planning or execution and needs to be looked into in detail to find the causes.
Performance IndicatorsJust like with the forecast costs, the key to a successful revenue forecasting strategy is to not stick religiously to it. Adapt it monthly or quarterly to really reflect on the business’s current situation.
Relevant Showcase Dashboard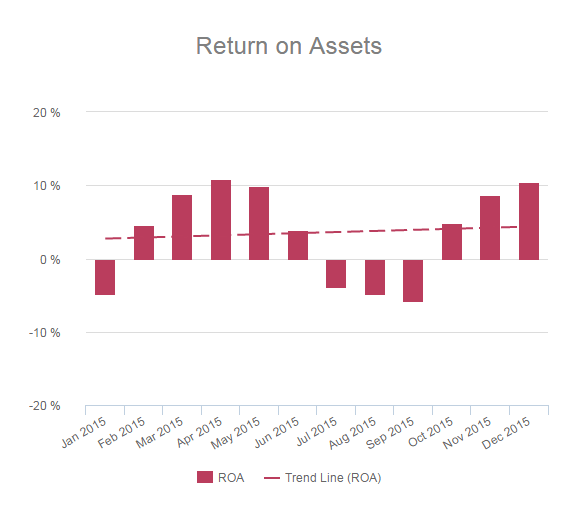
RETURN ON ASSETS (ROA)
Do you utilize your company’s assets efficiently?Return on assets indicates how profitable companies are in relation to their total assets. This financial KPI is calculated by dividing your net income by the total assets, including debt and equity. The increasing ROA is a good indication since it states that either the company is earning more money with the same account of assets or it generates equal profits with fewer assets required. This KPI is important to potential investors because it gives them a solid insight into how efficiently management is using their assets to generate earnings or, in other words, how effectively they are converting investments into net income.
Performance IndicatorsThe higher the return on assets (ROA) the better, especially compared to other companies in the same industry.
Relevant Showcase Dashboard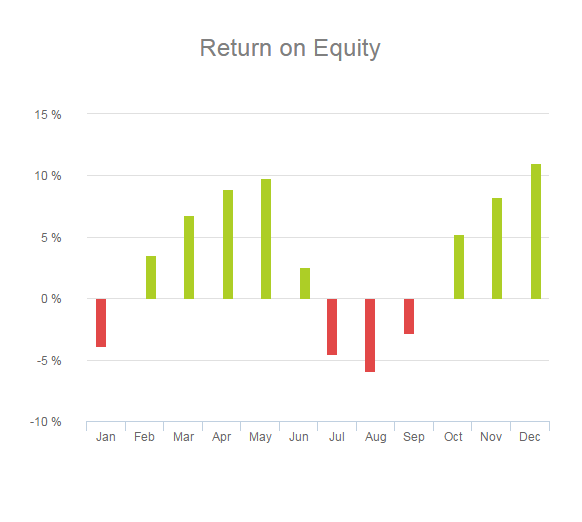
RETURN ON EQUITY (ROE)
How much profit do you generate for shareholders?Return on equity (ROE) measures how much profit your company generates for your shareholders. In other words, management often utilizes it to measure how effectively a company uses its assets to create profits. This metric can be calculated by dividing your company’s net income (minus dividends to preferred stocks) by your shareholder’s equity (excluding preferred shares). It is often used to compare the profitability of certain companies within the same industry. For example, if a tech company has a ROE of 20% compared to its peers, which have an average of 17%, an investor can conclude that the management has above average results in using the assets to create profits.
Performance IndicatorsThe higher the return on equity, the more value you generate for your shareholders. Keep in mind to compare the results within your industry.
Relevant Showcase Dashboard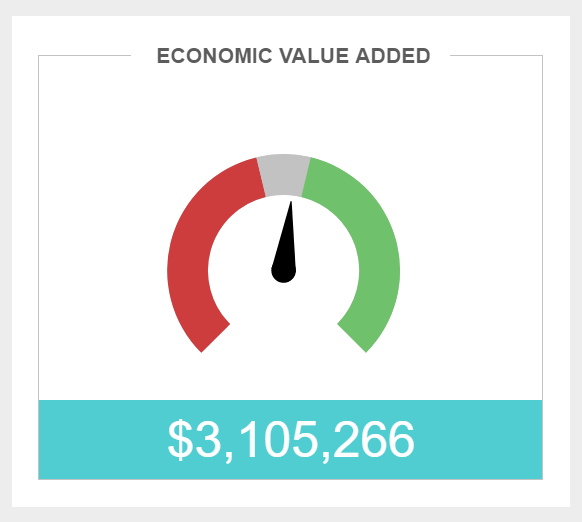
ECONOMIC VALUE ADDED (EVA)
Do you generate true economic profit?To calculate the economic value added (EVA), you need to deduct the costs of capital from the operating profit and adjust for taxes on a cash basis. This finance KPI example shows the value a company generates from funds invested in it. If the value is negative, the company is not generating value, and, on the other hand, if it’s positive, the company generates value from the funds invested. The basic formula to calculate EVA is as follows: net operating profit after taxes (NOPAT) - invested capital * weighted average cost of capital (WACC). You can see in our example an automatic calculation and immediately spot that the company generates value and has a positive EVA which is a positive sign of development.
Performance IndicatorsMonitor EVA regularly so that you become aware of the company’s wealth through assets and expenses to make better managerial decisions.
Relevant Showcase Dashboard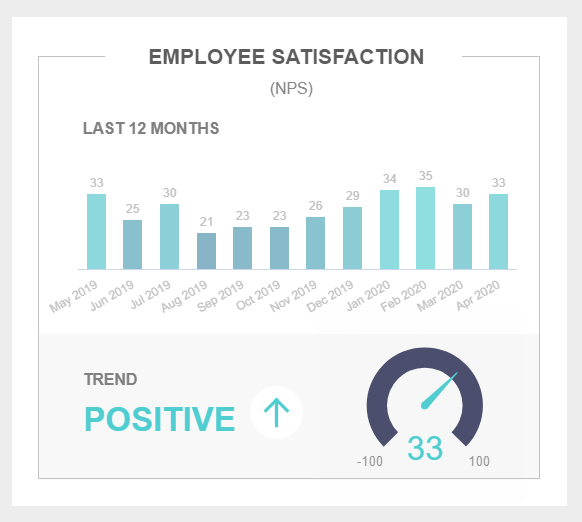
EMPLOYEE SATISFACTION
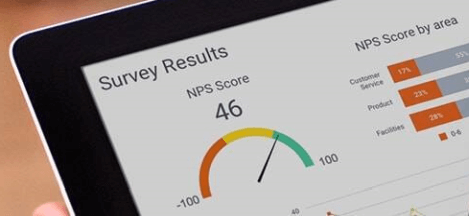
Will your team recommend you as a workplace?We continue our financial metrics examples with the employee satisfaction levels depicted through the net promoter score (NPS) in our visual on the right. It shows how likely your employees will recommend your company as a place to work, and we have also visualized the development over the course of a year. That way, you can see which months have performed better or if you need some adjustments in your talent management processes. A quick trend overview, whether positive or negative, will enable you to immediately spot if your employees are satisfied. Consequently, you can adjust your strategies, and examine your data and people management, if you see that the satisfaction levels drop.
Performance IndicatorsUse this metric to get a better overview of your people management processes, but dig deeper with other HR metrics in order to gain a complete overview.
Relevant Showcase Dashboard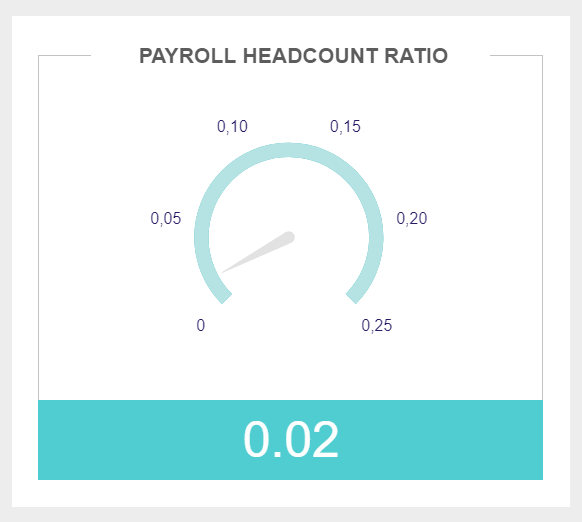
PAYROLL HEADCOUNT RATIO
How do you utilize your labor force?The payroll headcount ratio is a metric you can calculate by dividing HR full-time positions by the total number of employees. You can include freelancers, part-time employees, and contractors, for example, to evaluate, in the best possible manner, how well your company is utilizing its workforce. This metric shows how many people are engaged in the payroll process compared to the total number of employees. If the ratio is rising, it means you’re adding labor costs, so it might make sense to keep an eye on this metric so that you don’t experience potential financial difficulties.
Performance IndicatorsMake sure your labor costs are well invested and bring positive financial gain. If you spend more than you earn, you must reconsider your employment strategies.
Relevant Showcase Dashboard


Setup only takes a few minutes. No credit card required!