KPI Examples for LinkedIn
LinkedIn Key Performance Indicators and Metrics
✔ See different templates & designs ✔ Find & track the right LinkedIn KPIs to meet your corporate objectives
A LinkedIn KPI or metric is a measurement tool utilized in company pages and individual profiles to track and measure their influence via specific goals, be it engagement, reaching out or developing connections with as many people as possible in their specific industry.
Here is the complete list of the most important LinkedIn KPIs and metrics, that we will discuss in this article in every detail:
Followers’ Demographics: Where do my followers come from?
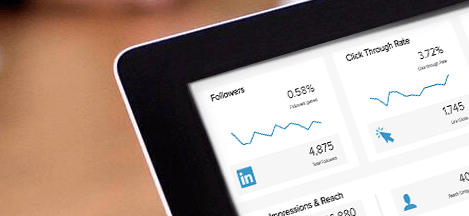
Number of Followers: Is my business influential enough?
Impressions & Reach: How many people have seen my page?
Engagement Rate: What kind of content engages most?
Company Update Stats: How are my updates received?
Viewer Information: Who viewed my profile and updates?
Contact & Network Growth: Where should I find new contacts?
Profile Views by Job Title: How is my profile performing over time?
Post Views & Engagements: How is my engagement developing?
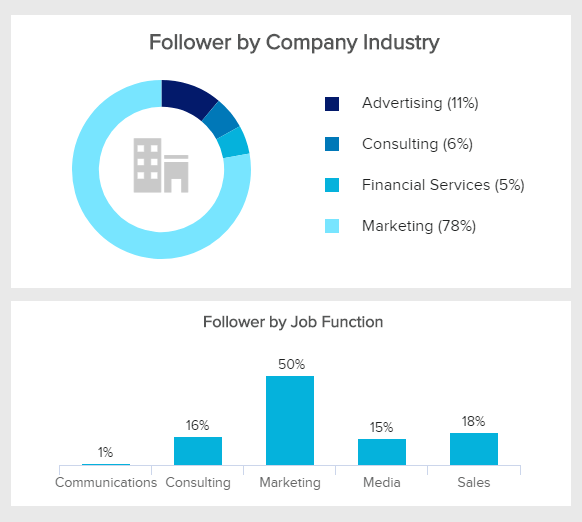
Followers’ Demographics
Where do my followers come from?The follower’s characteristics of your company profile can be distributed by the percentage of the follower number by company, industry, seniority, company size, function, etc. These LinkedIn metrics are important to consider if you want to connect with people within your own industry or target additional ones, possibly from similar industries to get a broader view of your business impact. The importance of the demographics KPI lays in the fact that you can quickly find out the types of followers your company page possess and tailor your content to match their interests. That way you can develop strategies for other metrics and KPIs important for your business page.
Performance IndicatorsIdentify the company industry percentage of followers, their job function, seniority, company size, and function. That way you can concentrate on your specific audience and incorporate meaningful content.
Relevant Showcase Dashboard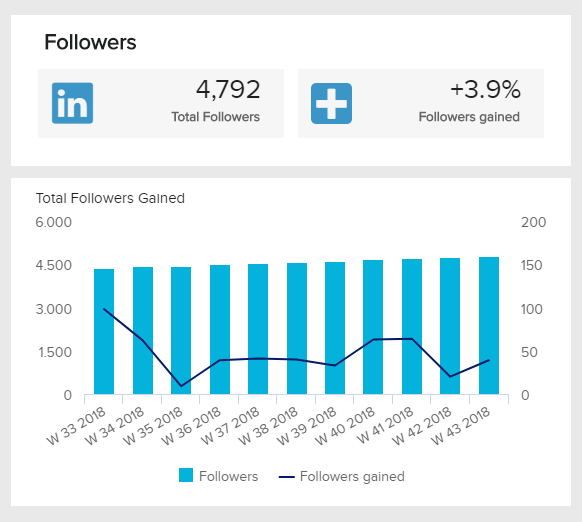
Number of Followers
Is my business influential enough?The influence of your business on this business social media channel can be perceived through the number of followers, that are presented on this visual KPI example. You can compare your findings on a specific time frame and see if your content needs to adjust, or you are already satisfied with the results. You can follow the detailed development of the total amount of followers: inspect the weeks you gained a bigger number and see what preceded to this and how to repeat the success. Additionally, you can compare the development with your competitors, which enables you to see whether you stand out or need additional tinkering.
Performance IndicatorsDetermine the growth percentage of your followers through a specific time set and compare your findings with competitors. The bigger the numbers you get, the more influential you become.
Relevant Showcase Dashboard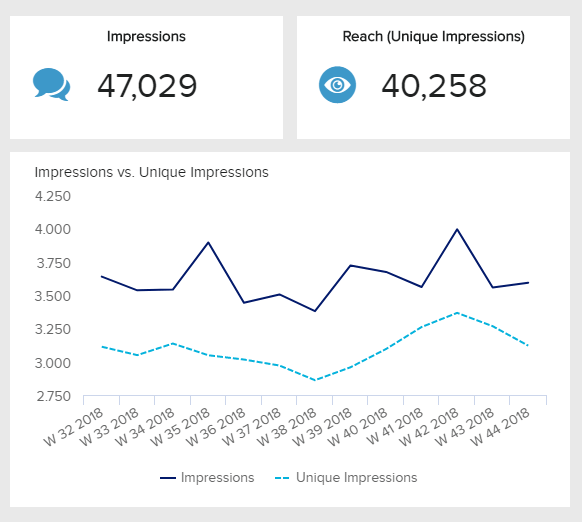
Impressions & Reach
How many people have seen my page?During the tracking of your LinkedIn KPIs, another important factor to consider is the amount of Impressions and Unique impressions (or the unique number of people who have seen your business page). In the LinkedIn interface, you can notice these metrics as Page views and Unique visitors. The higher the numbers, the more people have seen your page and the probability to interact is higher. If you compare your data over a specific period, you can see the fluctuation of your page and incorporate additional actions to perform better. The more people have seen your page, the better are the chances to build awareness and establish yourself as an industry leader.
Performance IndicatorsIncrease the number of Impressions and Reach to strengthen your influence.
Relevant Showcase Dashboard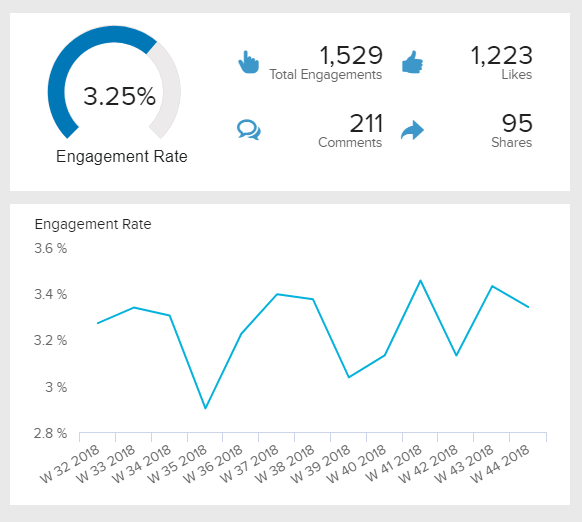
Engagement Rate
What kind of content engages most?When talking about social media, the important fact is that Engagement is still one of the key indicators (it is still a social form of media, isn’t it?). LinkedIn’s Engagement Rate will let you know details about the specific action that was taken on your company page: like, comment or share. You want to track the Rate to measure the general social interaction. But don’t forget about the CTR, as link clicks, in the end, matter the most. It’s like a snowball effect: start small and build over time. If you determine specific spikes, investigate more and see if you can repeat positive results, or learn from negative ones.
Performance IndicatorsMonitor your performance so that you know what kind of content works best with your industry and audience, and understand what draws the higher number of comments, likes or shares.
Relevant Showcase Dashboard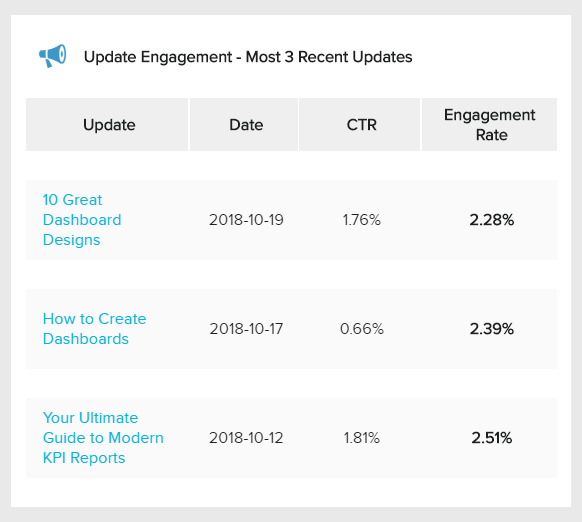
Company Update Stats
How are my updates received?When you share content on your company page, the Update Engagement section provides an easy access to the most recent updates visualized by the date published, the CTR, and the Average Engagement Rate. As stated before, the higher the numbers, the better your update value, so keep in mind your audience, the time of the day when you share and what kind of update receives the best value for your business. You can also customize the dashboard to see your sponsored content and compare it with your organic results. With datapine, that is possible with a few clicks.
Performance IndicatorsThe most recent updates can provide a quick overview of the reactions and overall impressions that your shared content has received. Use this metric wisely to additionally get to know your targeted audience.
Relevant Showcase Dashboard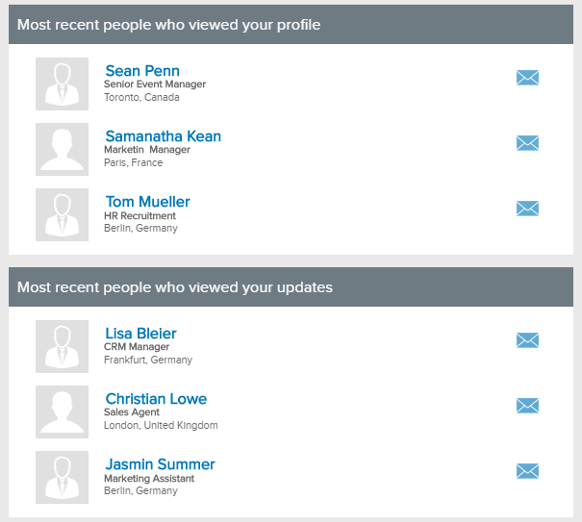
Viewer Information
Who viewed my profile and updates?By inspecting most recent people who viewed your profile, you can identify their industry or job title and send them a direct message which enables you to interact with your visitors in just a click. Their location information will provide you with more details on who your visitors are, and give you a detailed insight on which kind of people your personal profile attracts. Below the most recent viewers metric, you can inspect the most recent people who have viewed your updates, by the same level of details. This kind of information can help you determine what kind of content you should distribute in future to engage your audience.
Performance IndicatorsAssess frequently the most recent viewers on your profile and updates to keep track on which ones are the most interesting for your business profile and potential associations.
Relevant Showcase Dashboard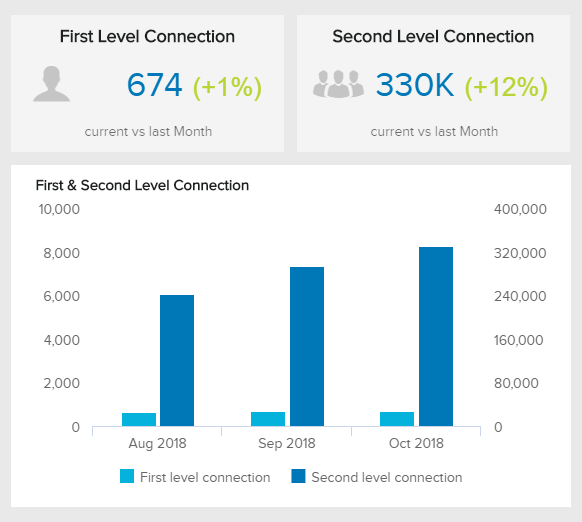
Contact & Network Growth
Where should I find new contacts?One of the most important LinkedIn KPIs is the way your build and maintain your contacts and network growth, especially in regard the influence you establish on this business network. How many people have you connected within the past week, or month, can define your strategy on which content to share and how many invites to send. On this visual KPI example, you can easily see a clear overview of your First and Second Level Connections’ growth over time. By comparing these metrics, you can get an outline of your overall growth and set timelines and specific actions to increase your network’s value and industry connections.
Performance IndicatorsMonitor your overall network growth to increase the value of your profile and chances to connect to specific people in your industry.
Relevant Showcase DashboardBecome a data wizard in less than 1 hour!
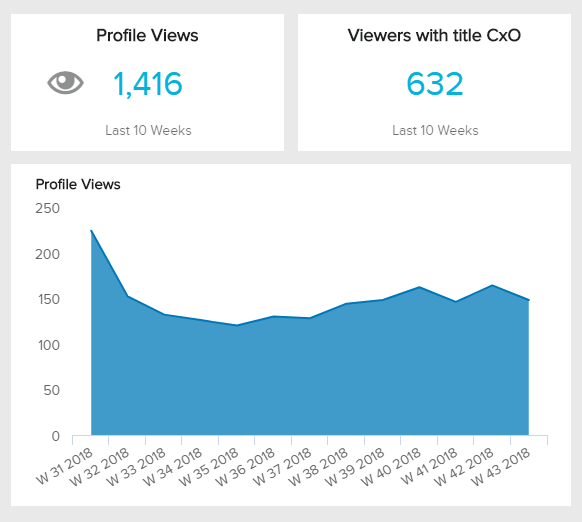
Profile Views by Job Title
How is my profile performing over time?The total number of profile views in the last 10 weeks can provide some details on the trends that are occurring within your network. You can also filter the viewers by job title, so you can see exactly if you have reached the specific target audience, which can bring you a chance to further interact with a specific person and develop your network prospects and increase your influence level. While customizing a more broad, monthly view, or a more detailed, daily one, you can easily track when has someone viewed your profile, adjust your goals and find the best possible influencer for your future business connections.
Performance IndicatorsMonitor your profile views metric over a specific time frame to identify trends and possible engagement within and outside of your network. Also, check that you actually reach your defined target audience: the right and interesting people for your network.
Relevant Showcase Dashboard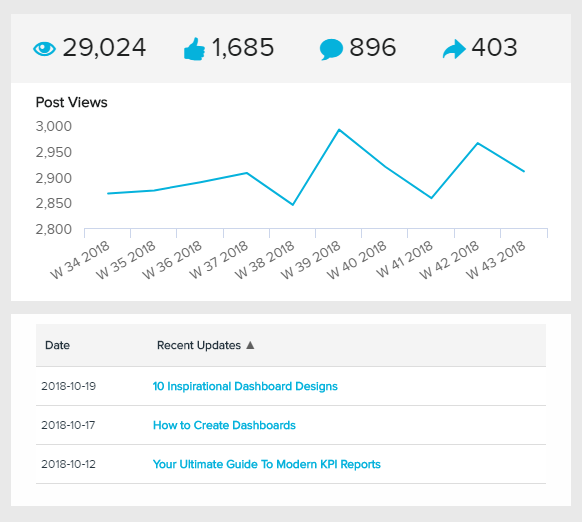
Post Views & Engagements
How is my engagement developing?The true value of any social media channel lays within the engagement indicator. LinkedIn KPI examples which we have shown earlier must be holistically viewed with the Engagement metric, so that any spike in the Post View section can be easily connected with other important KPIs. By visually seeing the Post View development over time, and average per individual post, the user can quickly draw conclusions and specify what kind of content can bring the highest number of views. Keep in mind also the Recent Updates section, where you can see how well they perform in relation to the overall Post Views numbers.
Performance IndicatorsMeasure your Post View performance in relation to engagement and other KPIs to deliver a holistic conclusion and increase your strategic value.
Relevant Showcase Dashboard


Setup only takes a few minutes. No credit card required!