
KPI Examples for the Retail Industry
Retail Key Performance Indicators and Metrics
✔ See different templates & designs ✔ Find & track the right retail KPIs to meet your corporate objectives
A retail KPI or metric is a performance measurement to track important retail processes in an efficient way. These KPIs are used by retailers to increase profits by identifying consumer patterns as well as bottle-necks within the ordering or shipping process.
Retail is an industry that heavily relies on providing great customer experience but also optimizing internal processes in order to generate profits. That said, a retail dashboard is a tool that many professionals use in order to thrive in this competitive industry, whether as a small shop or large multinational enterprise. No matter the size of a company, retail analytics are needed in order to increase customer satisfaction, monitor promotional activities, sales, return reasons, and many other critical retail metrics. By utilizing professional KPI software, retailers have greater chances to compete in the market and establish a data-driven culture that will ensure sustainable development.
Here we present a complete list of the 16 most important retail KPIs and metrics that modern retailers must know:
Website Traffic/Foot Traffic: Evaluate your marketing and ads’ efforts
Average Transaction Size: Analyze the purchasing behavior of customers
Average Units per Customer: Get insights on customer behavior trends
Total Volume of Sales: Track your sales numbers over time
Sell-through Rate: Compare the inventory received and sold
Back Order Rate: Measure the ability to fulfill customer orders
Rate of Return: Evaluate the number of orders returned to you
Customer Retention: Learn how to keep customers in the long run
Retail Conversion Rate: Improve your retail conversions
Total Orders: See the evolution of orders placement
Total Sales by Region: Evaluate how much you sell and where
Order Status: Track and analyze your orders in real-time
Perfect Order Rate: See how many orders are delivered without incidents
Return Reason: Get insights on why customers return their orders
GMROI: Track the relation between investments and returns
Monthly Revenue Per Employee: Evaluate the value of your employees
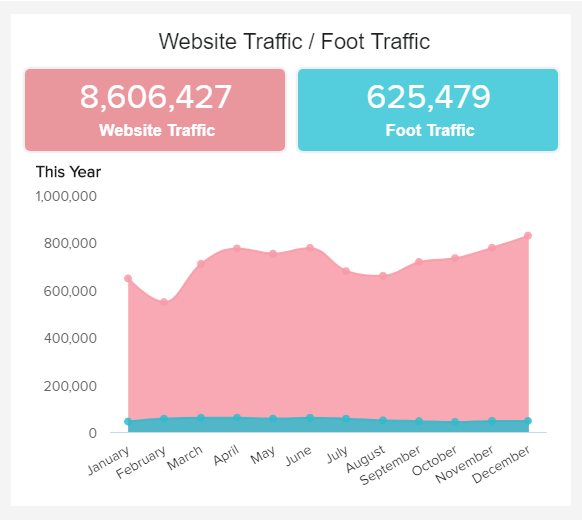
Website Traffic/Foot Traffic
Evaluate your marketing and ads’ effortsWebsite traffic and foot traffic are retail KPIs critical for assessing whether your promotional activities have made a positive business impact, which starts with traffic. Foot traffic refers to the number of people who entered your store while website traffic the number of visitors that have visited your website. In the offline world, if you have an interesting window display, or launched a promotion, foot traffic will determine whether you’ve been successful. On the other hand, if you invested significant amounts in online ads and increased your website traffic, you have to take a look at the final conversion and sales numbers. Was it worth it?
Performance IndicatorsThere is no right or wrong amount of traffic that you need to generate, but this traffic, ultimately, needs to bring sales so plan your marketing activities carefully.
Relevant Showcase Dashboard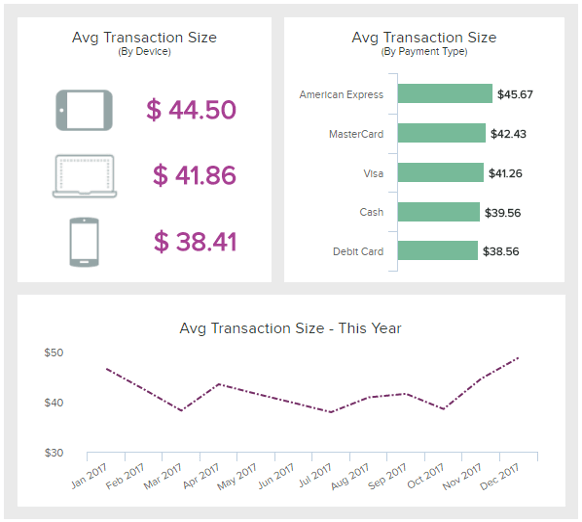
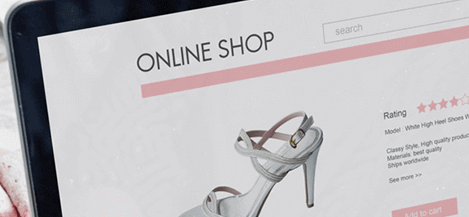
Average Transaction Size
Analyze the purchasing behavior of customersThe average transaction size will enable you to measure the amount of money spent on average for each transaction, and varies depending on the type of retail store. Evaluating this KPI over the year is a good indicator to know when your customers are more likely to spend money, which enables you to adapt your advertising accordingly. Likewise, measuring it according to the customer segments or to the device used to carry out the purchase will let you know who are your customers and what are their favorite purchasing platforms, giving you an opportunity to adapt your online shop. However, stay alert with this retail KPI that can misguide: if you have a lot of outliers taking the median instead of the average of your transaction size is more accurate.
Performance IndicatorsOf course, you want to increase your average transaction size over time. However often it makes sense to look at this metric in combination with your ARPU (average units per unit/customer), which shows you the average customer’s revenue from all your transactions.
Relevant Showcase Dashboard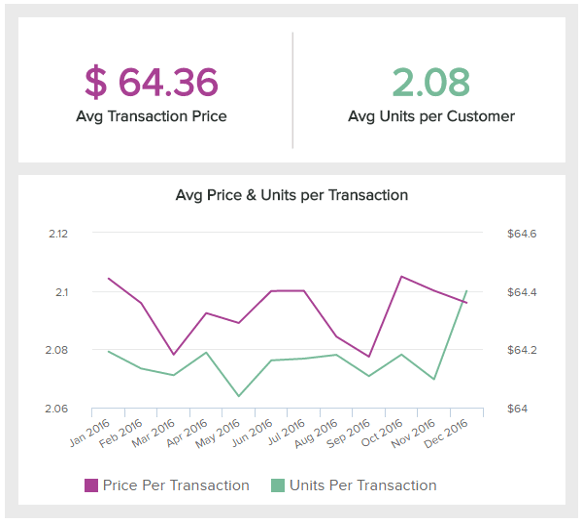
Average Units per Customer
Get insights on the purchasing trends in your storeThe average unit per customer is a sales metric used in retail to evaluate how many items are purchased, on average, by a customer in any given transaction. It is interesting to break it down into different periods of times or into different categories of article, so as to have a more precise evaluation of the sales. That way, you will know about purchase trends over the year, or how effective your sales teams are. Parallelize this data with other retail KPIs like the average transaction price and you can have a bigger picture of your customers‘ behavior.
Performance IndicatorsThe higher this metric, the more items are purchased per transaction. Low numbers can be increased by encourage more cross-selling.
Relevant Showcase Dashboard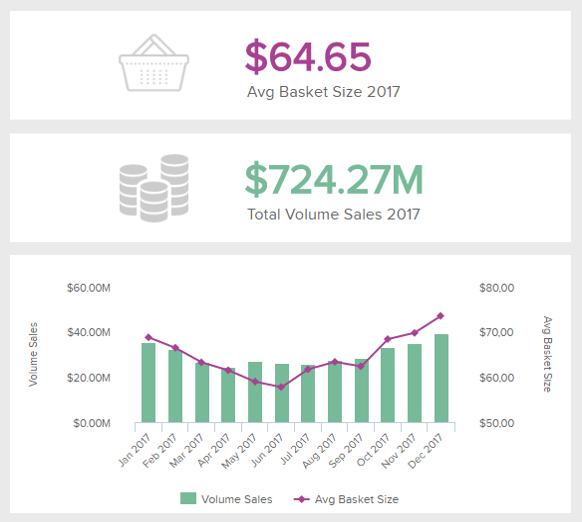
Total Volume of Sales
Measuring what you sell, where and whenThis one is a pretty straightforward retail KPI example. It measures the amount of sales performed over a period of time, or across locations including physical stores and online transactions. That way, you can see where and when demand is higher or lower, and try to understand why. It also helps gauge the dynamic of your business and create projections for future. Besides, comparing it between stores over same periods of time lets you customize products or services appropriately to these locations, as well as performing A/B testing: for similar volume sales in location 1 and 2, implement discount/promotional sales/samples/demos in one of them only, and see how it affects sales.
Performance IndicatorsMonitor and predict your total sales volume in detail to identify underperforming areas of your business or product categories early on.
Relevant Showcase Dashboard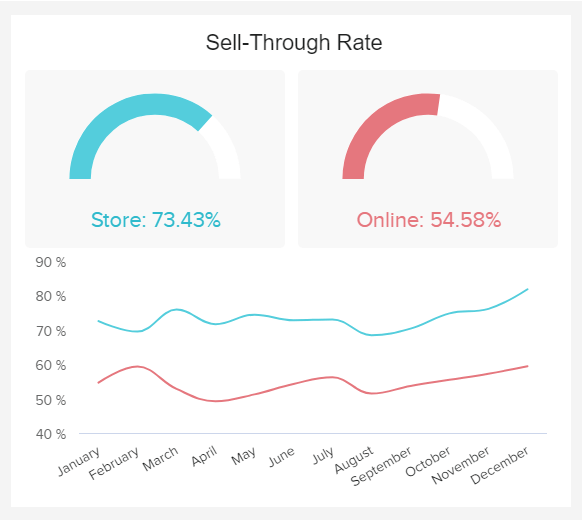
Sell-through Rate
Compare the inventory received and soldThe sell-through rate is one of the retail key performance indicators that is focused on the correlation between the amount of inventory sold within a specific period, relative to the amount of inventory received. If you want to identify how quickly you can sell your inventory, generally calculated on a monthly basis, then this metric should be high on your list. The goal of this KPI is to improve the inventory management processes, and ensure the highest possible percentage in order to have a healthy sales process. Keep in mind that any product that stays on your shelves, costs you money and carries a risk of slowing down your moving products.
Performance IndicatorsIf your sell-through rate is on the lower side of the spectrum, it’s time to re-evaluate your merchandise performance and items that are causing slow movement.
Relevant Showcase Dashboard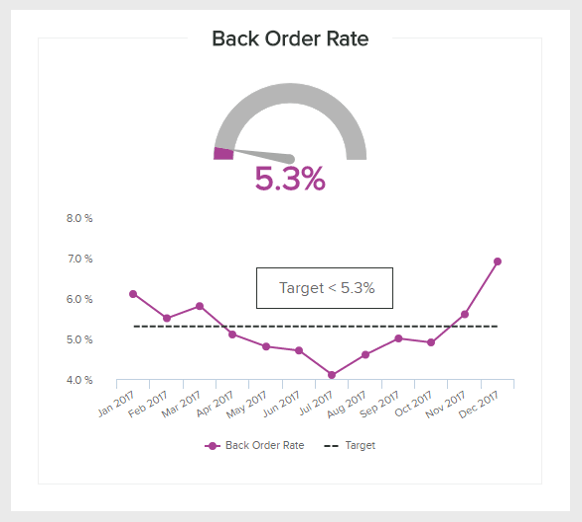
Back Order Rate
Measure the ability to fulfill customer ordersThe back order rate is the amount of orders that cannot be fulfilled at the moment the customer places an order, divided by the total number of orders. This is a retail metric that can be measured in units of items or in dollars. Having high back order rates usually is a situation that companies want to avoid; however, it isn’t always negative. If that happens regularly, it can indeed show a certain inefficiency in the production process that needs to be fixed; but it can also suggest rising sales that were not expected. Likewise, a decreasing back order rate can translate a lack of demand, or on the contrary a better production efficiency.
Performance IndicatorsTo make the best out of this metric and understand what it means, it is interesting to measure it in its context, along with other logistics and supply chain KPIs like the inventory accuracy or the out of stock ratio.
Relevant Showcase Dashboard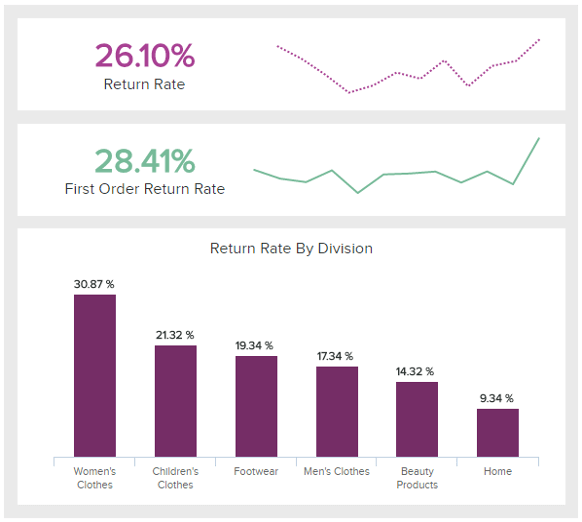
Rate of Return
Evaluate the number of orders returned to youNo business likes to see a customer walking back in with his items, or a package coming back in the factory. Returns are costly because they need to be processed again, or because they are lost due to a defect. This is why it is important for you to track not only the amount of returns your retail store has over a certain time, but also the reason why: you can couple this retail metric with the Return Reason for greater insights. Knowing at which pace these returns are happening and which categories of articles are affected the most will help you decrease it in the future.
Performance IndicatorsTo calculate the rate of return, divide the number of returns by the number of items sold. Multiply this ratio by 100 to visualize it as a percentage. The purpose is to maintain it as low as possible.
Relevant Showcase Dashboard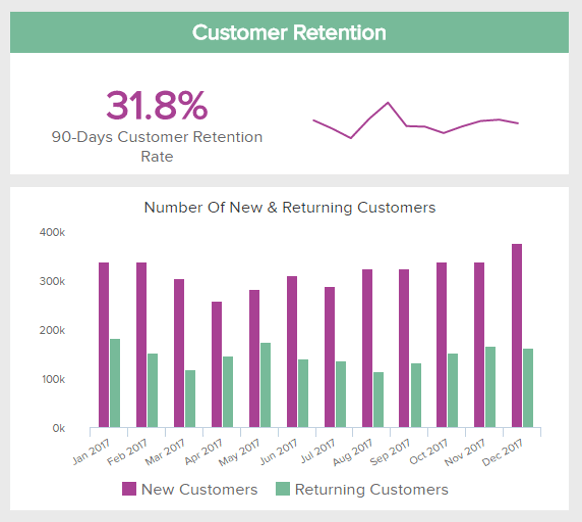
Customer Retention
Analyze how good you are at keeping customersAfter putting efforts into acquiring new customers, a company has to put even more in their retention, and develop in the long term a certain brand loyalty. Customer retention measures the capacity of your retail business to generate a recurring revenue from your already existing clients’ database. A retail metric like this one varies greatly according to the nature of your business, so it would be interesting for you to know the average value and try to reach it. Because of the high competition that exists in the retail sector, the customer acquisition costs are consequently so high that you can rarely make profit on their first orders: retaining them is then crucial for future benefits.
Performance IndicatorsCustomer retention rate = number of customers that repeatedly buy from your business. Keep in mind that retaining customers is cheaper than acquiring new ones.
Relevant Showcase Dashboard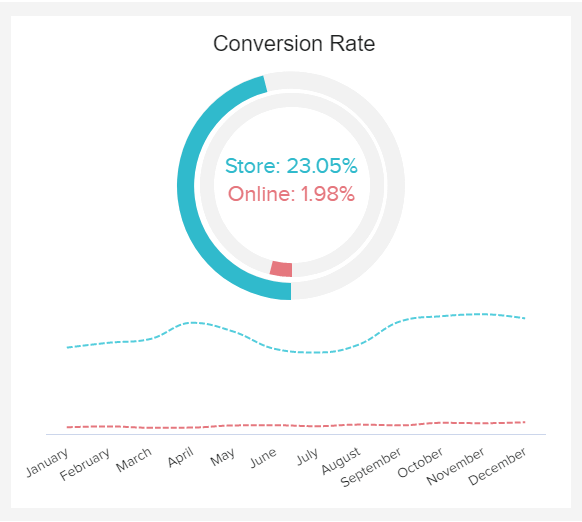
Retail Conversion Rate
Improve your retail conversionsOur list of KPIs in retail continues with the conversion rate. It’s one of the most important metrics to track since it will show you the ability to maximize sales, and enable you to spot any inefficiencies in your online and offline shop. Higher amounts of traffic are great, but if visitors of your store or online shop don’t convert, your bottom line will be affected. To calculate the retail conversion rate, you need to divide the number of sales with the total number of visitors. Compare it over time to see if your tactics have a positive impact on your business.
Performance IndicatorsIf you don’t measure this metric, your business decisions will be based on guesswork. Build rapport with your customers but don’t be too pushy.
Relevant Showcase Dashboard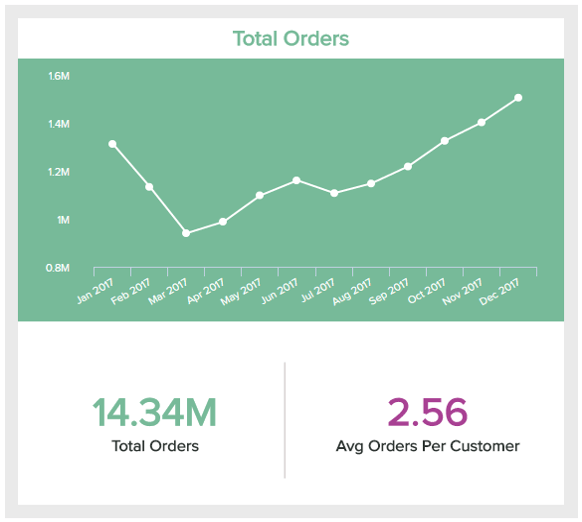
Total Orders
See the evolution of orders placementAnother retail metric which is pretty straightforward. Your total orders figure calculates how many orders have been placed in your business over the course of the day, month or year. This will help you in knowing what the rush periods are and adapt your stock inventory accordingly, to avoid any stock-out or back order. It will also help you adapt your staff management, and avoid mistakes or defects due to overloaded personnel. You may calculate an average of orders per customer as well, but like for the transaction size, the average can be biased if one customer places a huge amount of orders in one time. The total orders your company is receiving is also giving you the pulse of your business.
Performance IndicatorsA growing figure of total orders is a good indicator of business growth. Be careful though to compare it to your revenue/profit growth, that should increase as well.
Relevant Showcase DashboardBecome a data wizard in less than 1 hour!
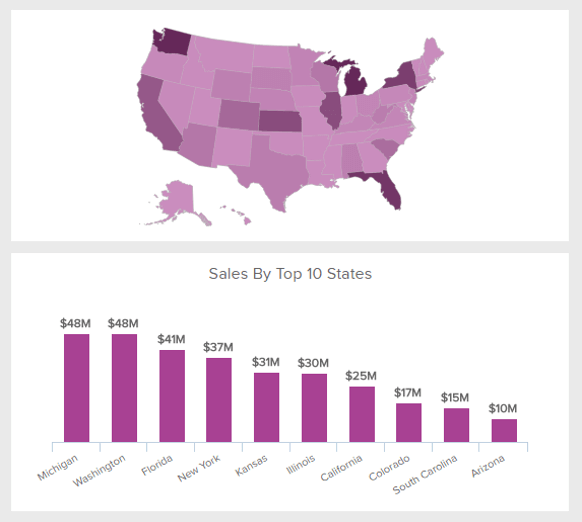
Total Sales by Region
Evaluate how much you sell and whereMeasure the amount of sales you make according to the customers’ location if you have an online business, or to your stores location if you have physical points of sales. As mentioned, when reviewing the volume sales KPI, you can compare your sales volume across locations and try to understand why, as well as try to implement new marketing initiatives and testing them in different places. To make the best out this retail metric, analyze it along other KPIs like the demographic ones related to your customers: gender, age, population of the city and state, so as to have a big picture on your customers and all the cards in hand to grow your total sales respectively to each region.
Performance IndicatorsAcknowledge where your customers are purchasing the most to find trends and implement specific strategies accordingly.
Relevant Showcase Dashboard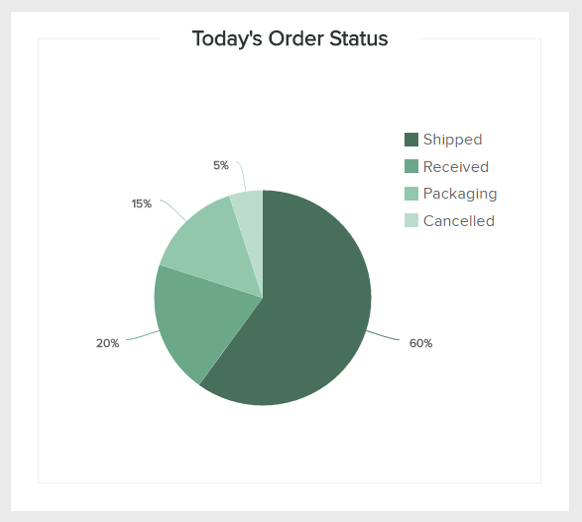
ORDER STATUS
Track your orders in real-timeThe order status is a good retail KPI example that serves both your business and your customer. Indeed, customers like to know at which stage of the achievement process the order they placed is, and you need to have real-time update on the different orders you have to evaluate your supply chain efficiency in the matter. The purpose is of course to decrease the percentage of back orders or restocking, and maintain a high percentage of new orders to keep the business going. Tracking such retail metric will help you monitor your supply chain and adjust in case of slow processing, high inaccuracy, or low new orders.
Performance IndicatorsA growing figure of total orders is a good indicator of business growth. Be careful though to compare it to your revenue/profit growth, that should increase as well.
Relevant Showcase Dashboard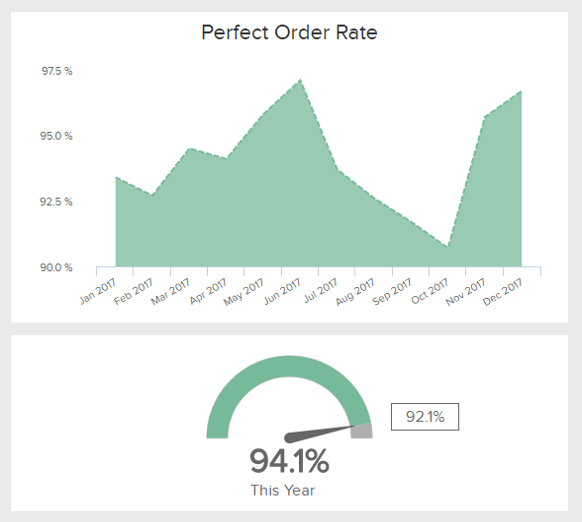
Perfect Order Rate
Assess the efficiency of your company in deliveringThe perfect order rate is a good retail KPI to assess performance. It measures the amount of orders that are fulfilled and shipped out without any incident on the way (inaccuracies, damages, delays, loss…). A low perfect order rate translates an inefficient supply chain and will inevitably affect your customers’ satisfaction as well as your business reputation. A high ratio will avoid you useless expenses due to returns or damages, and will give a reliable image of your business in your clients’ minds, that will in return be more likely to come back and recommend your services to friends and family.
Performance IndicatorsThe higher, the better. This KPI is directly impacting your customer retention rate.
Relevant Showcase Dashboard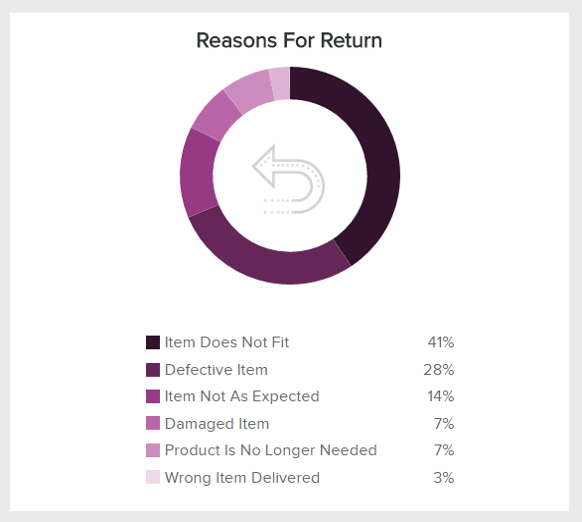
RETURN REASON
Get insights on why customers return their ordersThe return reason is a retail KPI example of quality assessment: after evaluating the rate of return your business is facing, you should dig into the why of that rate. It might be the product quality, the marketing promises unfulfilled, the customer service, a defect, an inaccuracy, etc. With these insights, you can improve the areas where your retail business is falling short. Return reason is to be compared to other KPIs such as the rate of return or the perfect order rate to be used at its full potential. Once you have assessed your returns, you can consider implementing return policies specific to items, services or reasons.
Performance IndicatorsAfter careful evaluation and benchmark, your goal should be to decrease the rate of return thanks to the insights you gain with the return reason.
Relevant Showcase Dashboard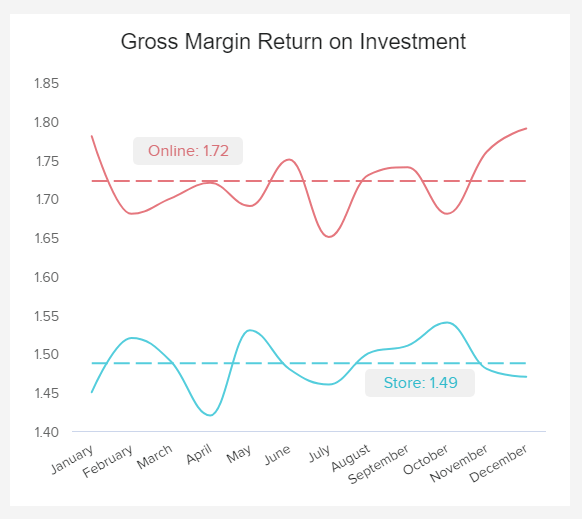
GMROI
Track relations between investments and returnsIf you want to improve KPI performance in retail, tracking the gross margin return on investment (GMROI), among other critical metrics depicted on a dashboard, is a clear must. The formula is simple, you need to divide the gross profit with the average inventory, and the result will show you how much money your inventory has made. This metric is worth measuring for specific products or categories because it it’s a clear inventory profitability measurement and it gives you ideas on what kind of items are worth having in your shop or online store. To improve this KPI for retail, you can increase your prices, or lower the costs of goods, but that depends on your current status and if you need to adjust. A higher ratio means that your company has a healthy relation between sales, margin, and cost of inventory.
Performance IndicatorsIf the GMROI ratio is higher than one, it shows a healthy state of business. If it’s below 1, you need to adjust your business management and identify bottlenecks.
Relevant Showcase Dashboard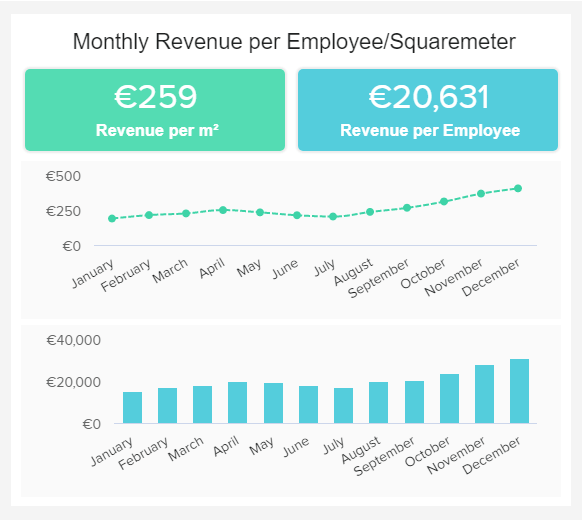
Monthly Revenue Per Employee
Evaluate the monetary power of your employeesThe revenue per employee is a KPI in retail that shows you how much money each employee generates for your retail company. It’s simply calculated by dividing the company’s total revenue by its current number of employees. The higher the ratio, the better the productivity. In our example, we have also visualized the revenue per square meter, which is a direct showcase of your physical store’s productivity, and you can see that it increases over time. As mentioned, these retail performance metrics are great indicators of company’s productivity, and, if you see certain negative trends, it makes sense to include advanced analytics, reassess the store layout, optimize prices, or push promotions.
Performance IndicatorsYou can use the revenue per employee and square meter when planning your store layout, and evaluating the productivity of your workforce.
Relevant Showcase Dashboard


Setup only takes a few minutes. No credit card required!