
TOP 18 PROCUREMENT KPIS
Procurement Key Performance Indicators and Metrics
✔ See different templates & designs ✔ Find & track the right procurement KPIs to meet your corporate objectives
A procurement KPI or metric is a measurable value that tracks all relevant aspects of obtaining or buying goods and services. These KPIs enable the procurement department to control and optimize the quantity, quality, costs, timing and sourcing of purchasing processes.
No matter if you’re a procurement professional or manager, these metrics will help you in monitoring, assessing, and creating a comprehensive procurement dashboard that will enhance your online data analysis process and enable you to improve departmental performance. By taking control of your procurement data, you will benefit across the board; from automating your procurement reports to creating stunning interactive visuals, these metrics will help you identify bottlenecks and increase your productivity.
Here is the complete list of the 18 most important procurement KPIs and metrics, that we will discuss in this article in every detail:
Compliance Rate: Understand if suppliers fulfill your requirements
Number of Suppliers: Track your level of dependency towards your suppliers
Purchase Order Cycle Time: Know who to address your urgent orders to
Purchase Price Variance: Track standard vs actual purchasing price
Purchase Order Coverage: Monitor if invoices match to purchase orders
Supplier Quality Rating: Analyze the quality of your suppliers
Supplier Availability: Measure suppliers’ capacity to respond to demand
Supplier Defect Rate: Evaluate your suppliers’ individual quality
Vendor Rejection Rate & Costs: Examine your quality management strategies
Lead Time: Understand the total time to fulfill an order
Emergency Purchase Ratio: Track the number of your emergency purchases
Purchases In Time & Budget: Monitor purchasing time & budget
Cost of Purchase Order: Control the internal costs incurred by each purchase
Procurement Cost Reduction: Streamline the tangible costs savings
Procurement Cost Avoidance: Avoid potential extra costs in the future
Maverick Spend: Monitor your non-contracted spending
Spend Under Management: Track and optimize your expenditures
Procurement ROI: Determine the profitability of investments
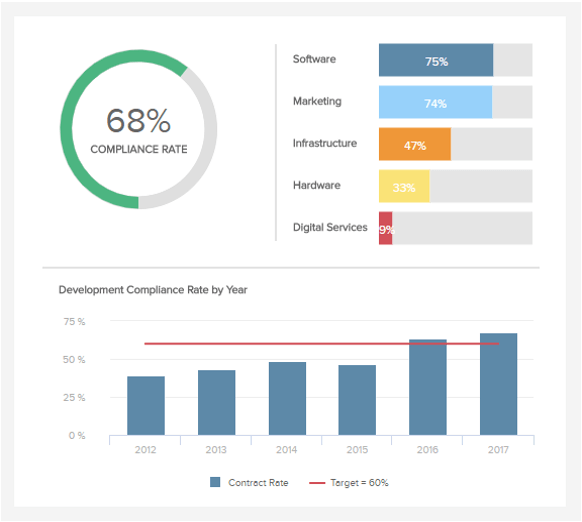
Compliance Rate
Find out if suppliers fulfill your requirementsOne of our compliance metrics examples represents the whole of basic agreements a company and a supplier lay down. It results in various requirements such as the maximum reaction time in case of any issue, the delivery time, special discount offers, etc. It is a key component in providing guidance and insights into processes, and participates in saving costs through better negotiations with suppliers. On our procurement KPI example aside, the compliance rate is 68% overall, and it is broken down per type of suppliers: the highest compliance rate is with software suppliers, with 75%, while the lowest is with digital services with 9% of compliance. It also tracked the general evolution over five years, with a pre-set target of 60% that is reached in 2016 and 2017.
Performance IndicatorsFor an average company that is not operating worldwide with millions of suppliers or end-users, reaching an overall of 50% of compliance is a good target to set.
Relevant Showcase Dashboard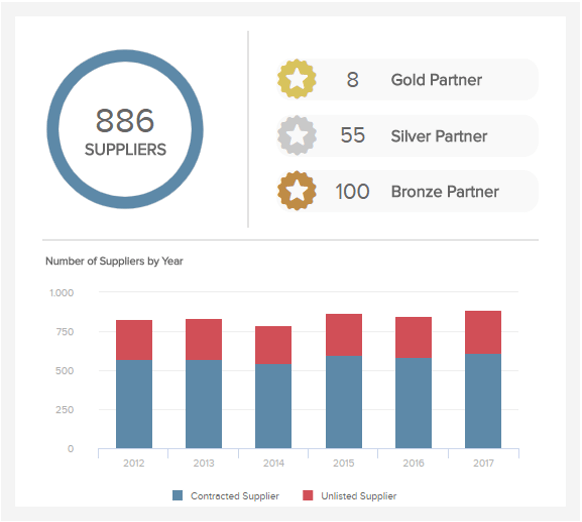
Number of Suppliers
Monitor the level of dependency towards suppliersOur second procurement KPI tracks the evolution of how many suppliers the company has. Relying on just a few and not diversifying your sources creates a risk of dependency, and potential further problems if one of them pulls out at the last moment. On the other hand, too many suppliers reduce the possibility of discounts. The procurement KPI aside shows the evolution of the number of suppliers over the years, divided into two categories: contracted and unlisted ones. Often enough, companies prefer contracting suppliers so that they agree with their terms of compliance – but not all of them agree, so they are unlisted. The contracted partners can be classified as gold, silver or bronze according to certain criteria measuring the relationship through discount, reliability, etc.
Performance IndicatorsApart from the level of dependency, the optimal number of suppliers you need should be measured using other metrics like the quantity discount they provide you with, and the defect rate of their supplies.
Relevant Showcase Dashboard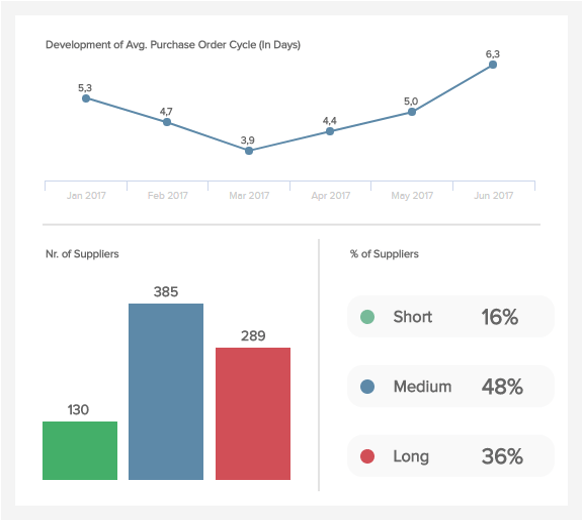
Purchase Order Cycle Time
Know who to address your urgent orders toThe purchase order cycle time is a procurement KPI that covers the end-to-end ordering process, from the moment a purchase order is created to the order approval, receipt, invoice and finally payment of the order. It focuses on the order and does not include the creation and delivery of the product or material itself. On our illustration aside, we see that the cycle decreased to 3,9 days at its minimum in March 2017, before increasing up to 6,3 days in June. The suppliers are divided into three categories classifying their purchase cycle time: short (4 days or less), medium (5 to 8 days) or long (over 8 days). This is a factor to take into account when purchasing: if the order is urgent, you may need to know which supplier is able to handle it quickly.
Performance IndicatorsReducing your cycle time can improve the turnaround of other key activities, and improve staff productivity and the overall cost of the procurement function.
Relevant Showcase Dashboard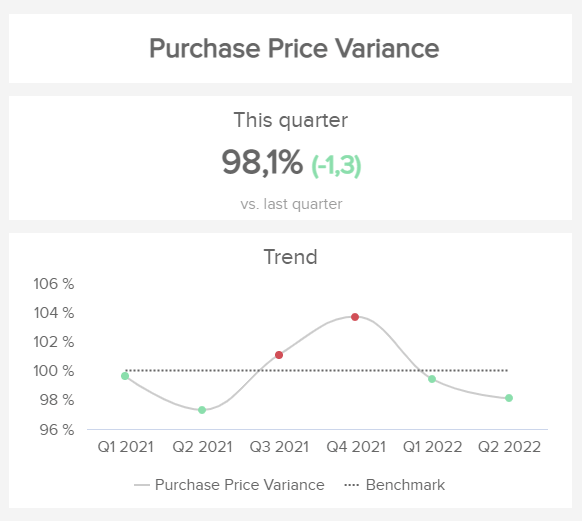
PURCHASE PRICE VARIANCE
Track actual vs standard purchasing priceOur next procurement KPI example is the purchase price variance (PPV) and it assists businesses in achieving efficient spending management. Essentially, it tracks the difference between the actual purchased price of an item or service with the standard price of it. The actual price is what the company actually paid its vendors, while the standard price is what the company expected to pay them during their planning and budgeting process. That said, a positive price variance means your procurement team was efficient at negotiating pricing deals, while a negative variance, might mean an increase in the price of materials, inefficient buying decisions, or bad negotiations of prices. The formula to calculate your business PPV is the following: actual quantity x standard price - actual quantity x actual price = PPV.
Performance IndicatorsTrack your purchase price variance against a target to easily identify when something is not performing as planned. This way, you will become more efficient at cost savings.
Relevant Showcase Dashboard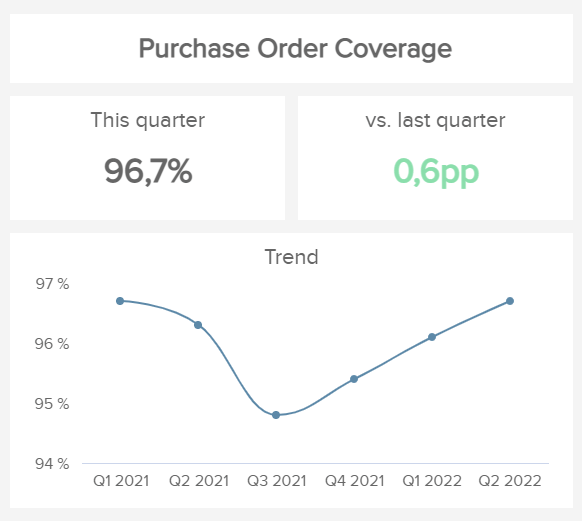
PURCHASE ORDER COVERAGE
How invoices match to purchase ordersThe purchase order coverage is a metric that tracks the percentage of supplier invoices received that can be matched to a purchase order. It is an important KPI to track as it not only protects the business from invoice fraud but also saves money and builds stronger relationships with vendors. Traditional means of invoice matching usually involve manual processing, which is time consuming and prompt to error. To avoid this, procurement departments rely on automation technologies such as the 3-way-matching approach. This is the process of comparing the original PO, the receiving document, and the vendor invoice to match the information in them. If the three do match, then the company’s expectations regarding the price, service, and goods match the vendors ones.
Performance IndicatorsAs a benchmark your purchase order coverage should be higher than 95% to avoid extra processing costs and unverified orders.
Relevant Showcase Dashboard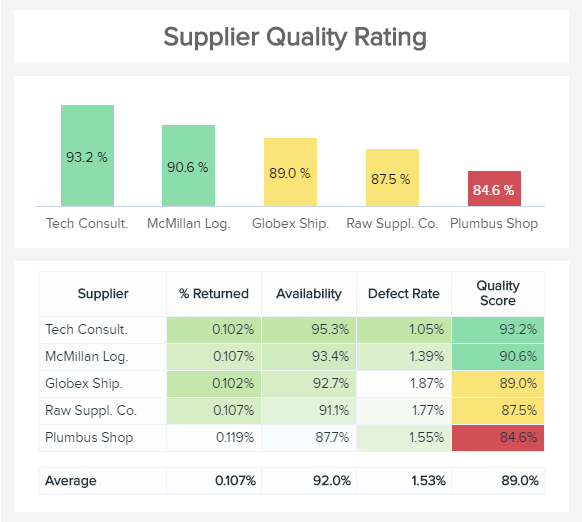
Supplier Quality Rating
Analyze the quality of your suppliersThe quality rating is one of the supplier performance metrics critical in evaluating present as well as future relationships with suppliers. If the designated supplier continuously delivers a lower quality score, then their status may be downgraded, or corrective measures implemented until issues in the supply chain are resolved. For example, if the supplier availability was low, and you cannot rely on their stock, your business can, consequently, suffer due to a lack of products. The point is to monitor suppliers, try to reach the highest quality score (above 90%), and re-evaluate the percentage of returned items, availability, and the defect rate, in order to renegotiate future contracts and agreements.
Performance IndicatorsEstablish a system of evaluating the quality of your suppliers backed with data and analytics like in the example above. Set clear goals and monitor their performance in detail.
Relevant Showcase Dashboard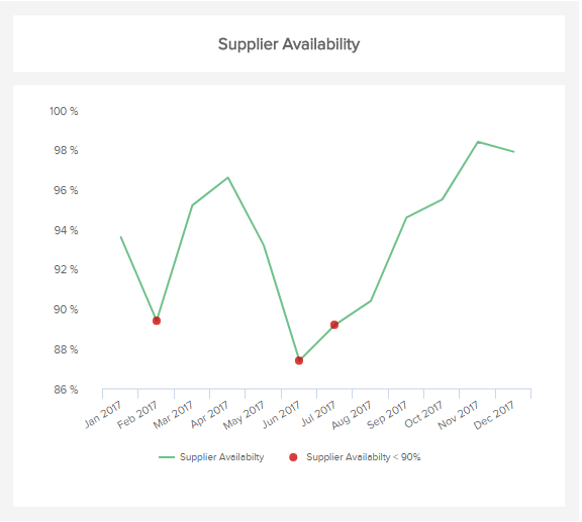
Supplier Availability
Measure your suppliers’ responses to urgenciesThe supplier availability is a procurement KPI that refers to the number of times goods were available on the supplier’s side, or to the number of orders placed with the supplier. In an era of fast-changing consumer habits, where the lines between different channels are blurred, and where mobile-commerce, online purchases, and in-store consumer-specific marketing all merge into one retail experience, it is important to manage suppliers as efficiently as possible to guarantee the availability of stocks. By monitoring the evolution of your supplier’s availability of stocks, you know the degree of reliability you can place in them.
Performance IndicatorsMaintaining your supplier’s availability over 90% ensures a good functioning of your supply chain and a greater level of efficiency.
Relevant Showcase Dashboard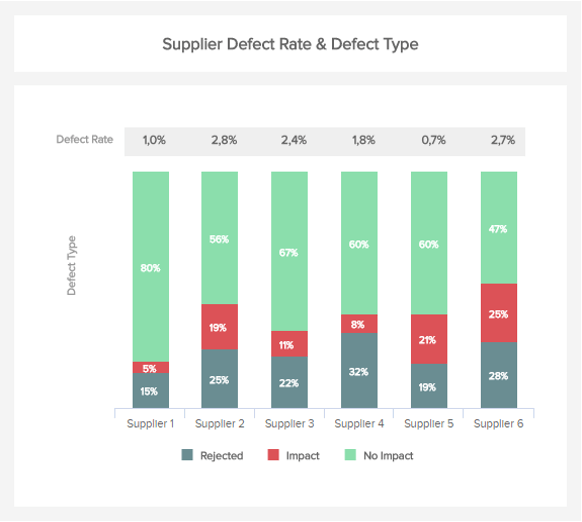
Supplier Defect Rate
Evaluate your suppliers’ individual qualityThis is a procurement KPI that is crucial when it comes to determining the final quality of a product. It measures the percentage of products received from suppliers that do not meet the compliance specifications and craftsmanship requirements. The supplier defect rate is more critical in some industries that have high-risks and multi-tiered supplier bases like the aerospace and defense or the automotive. Tracking your different suppliers defect rates and breaking them down into defect types will provide you insights into which supplier is more performant and reliable than other, and what type of errors are done. In our example aside, it is obvious that the first supplier is more reliable than any of the five others: within the 1% of defective goods supplier 1 has, 80% of them still have no impact.
Performance IndicatorsMeasure and track the different defect rates amongst your suppliers and identify the ones that are performing best and that are the most reliable.
Relevant Showcase Dashboard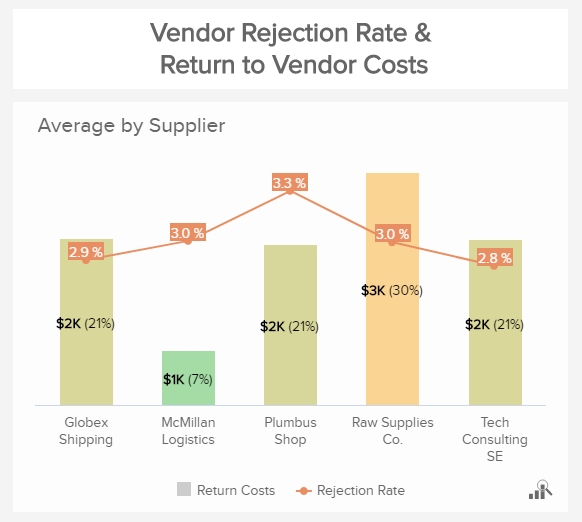
Vendor Rejection Rate & Costs
Examine your quality management strategiesTo ensure sustainable development of your business, vendor performance metrics such as the rejection rate and costs should be monitored regularly. The correlation between the two will let you know whether there are issues on a more serious note such as increment in both measures, and if the buyer can seek replacement goods or damages in a short time frame. Communication here is also important to avoid further bottlenecks. It’s important to find common grounds and try to negotiate possible solutions to ensure that the future relationship doesn’t suffer because of possible lawsuits for damages or claims against guarantees.
Performance IndicatorsMonitor the rejection rate and return to vendor costs in order to identify what causes these issues and how you can improve in the future.
Relevant Showcase Dashboard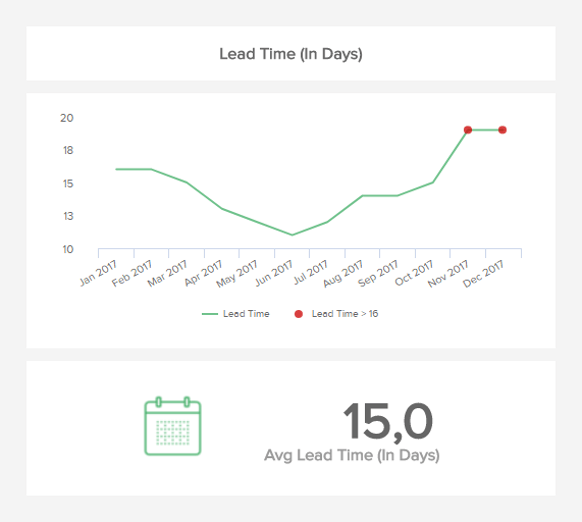
Lead Time
Measure the total time to fulfill an orderOur next procurement KPI measures the interval of time between the initiation of a procurement action, and the receipt of the production model into the supply system, purchased as a result of such action. In other words, it is the latency between the initiation and the execution of a process. It is composed of production lead time and administrative lead time. For instance, the lead time between the placement of an order and the delivery of printed circuit boards from a manufacturer can span from 2 weeks to 3 months, or sometimes more. Lead time is different from purchase order cycle time as it starts when the request is made till the final delivery and testing, while cycle time ends at the confirmation of the order. Set a target amount of days under which the lead time should stay; if you see that it repeatedly fails over time, measures should be taken.
Performance IndicatorsThe idea is to reduce lead time as much as you can while keeping a good quality level.
Relevant Showcase Dashboard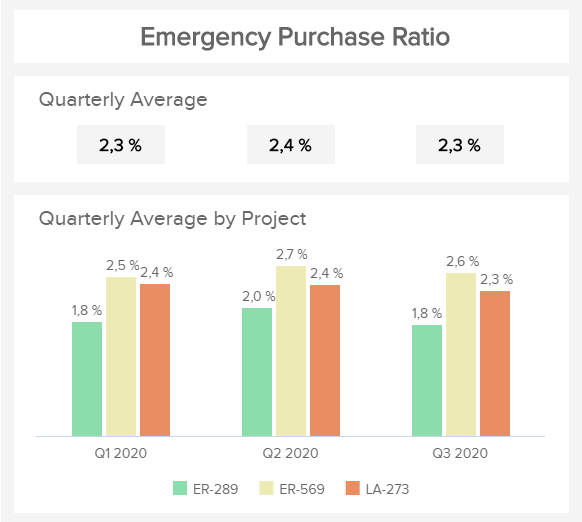
Emergency Purchase Ratio
Track the number of your emergency purchasesThe emergency purchase ratio is a purchasing KPI focused on unplanned orders. These orders are usually done when there is an indication of product shortages and are measured over a period of time, and expressed as a percentage between emergency purchases and total purchases. The visual we have created expresses also the quarterly average by project, which gives you additional details about emergencies that occurred. In essence, if this metric is lower, the organization has a chance to save money, improve planning processes, and reduce supply risks, among other important impacts. These indications will, consequently, show you how effective your planning is, and whether you need to adjust future strategies.
Performance IndicatorsThe goal is to keep the ratio as low as possible in order to avoid bottlenecks and shortage within your product portfolio.
Relevant Showcase Dashboard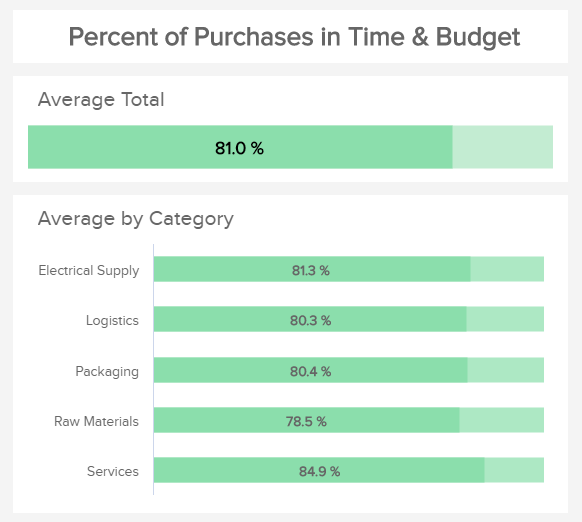
Purchases In Time & Budget
Monitor your purchasing time and budgetTracking the budget and time are critical elements in the procurement department. Managing the budget but also keeping a healthy amount of flexibility needs to be taken into account when analyzing procurement performance metrics. As you can see in our visual example, the average percentage of purchases in time and budget is 81%, which is a quite good result, although, in a perfect world, it would be 100%. Therefore, to further optimize this metric, it makes sense to look into different categories and identify areas where the values are (significantly) lower.
Performance IndicatorsThe goal is, of course, to stay on budget and time. If you don’t manage to achieve your goal, it’s time to dig deeper and find out why.
Relevant Showcase Dashboard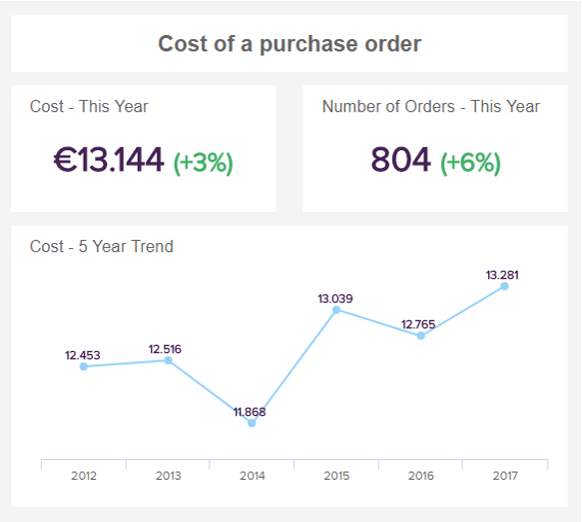
Cost of Purchase Order
Control the internal costs incurred by purchasesThe cost of purchase order is one of the disputed procurement KPIs, as the definition and application vary. In theory, this metric represents the average expense of processing an order, from purchase creation to invoice closure. In practice, the costs to process internally the purchase order can include a staggering list of variables, and depending on studies, can range from $1,34 to $437... So, when measuring this metric, it comes down to what you decide to consider: what is the average cost to process a purchase order, based on how long it takes to do so, by the staff directly or indirectly involved. In our example aside, we have an average of (13,144/804) €16.34, which is within the studies’ range.
Performance IndicatorsThe idea is to improve the efficiency of the procure-to-pay cycle, so as to prevent errors and reduce expenses.
Relevant Showcase DashboardBecome a data wizard in less than 1 hour!
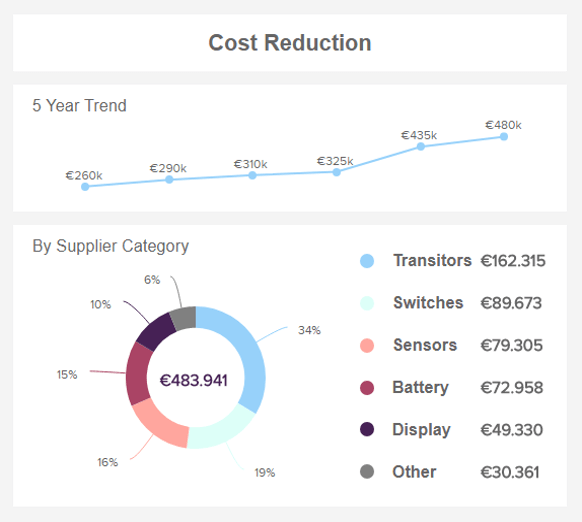
Procurement Cost Reduction
Streamline the tangible costs savingsCost reduction is central amongst the procurement KPIs of our cost management dashboard. It wants to measure the tangible “hard savings”, that you have performed in terms of cost management over the years. You can easily measure them by comparing directly the old costs versus the new ones for the same good or service. On our illustration aside, we see that it went from €260k up to €480k five years later. It also breaks down the cost reduction by supplier category (switches, battery, display, etc.) and we see that the transistors’ section has the highest savings. There are a lot of best practices to adopt to reduce spending: you can streamline your supplier lifecycle management, increase efficiency by leveraging supply chain analytics, or train your staff on how to save costs. It is a key metric for top management as it has a direct influence on the income statement.
Performance IndicatorsMonitor your cost reduction over time in order to increase it in the long-term.
Relevant Showcase Dashboard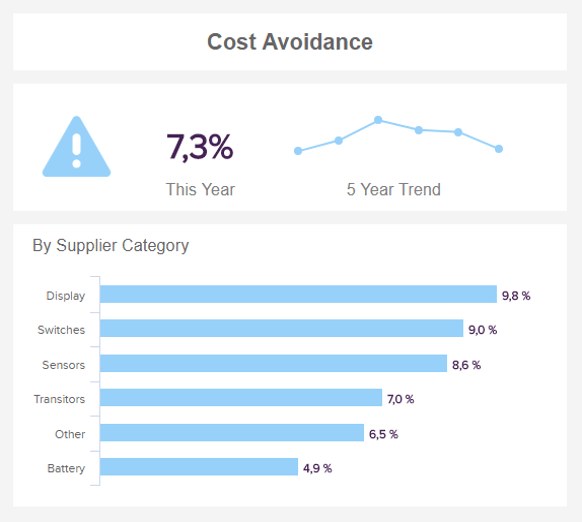
Procurement Cost Avoidance
Avoid potential extra costs in the futureThe second last of our procurement metrics focuses on the actions undertaken to reduce potential future charges, like replacing parts before they fail, and inevitably damage other parts. It is sometimes referred to as “soft savings” in opposition to the “hard” ones, since they do not directly appear on the bottom line in a quantifiable way, but can still have a positive impact. It can be neglected by the top management since it doesn't directly affect the income statement. Cost avoidance creates important strategic value as it often targets strategic spending like new investments or technologies that have no comparable purchase for instance. As you can see in our example, it is calculated as a percentage that can be broken down into the different categories of suppliers, that you can track alongside the cost savings performed, to better measure the impact of your efforts.
Performance IndicatorsDevelop a strategy to map your cost avoidance internally and combine it with the cost reduction in order to avoid future extra spending.
Relevant Showcase Dashboard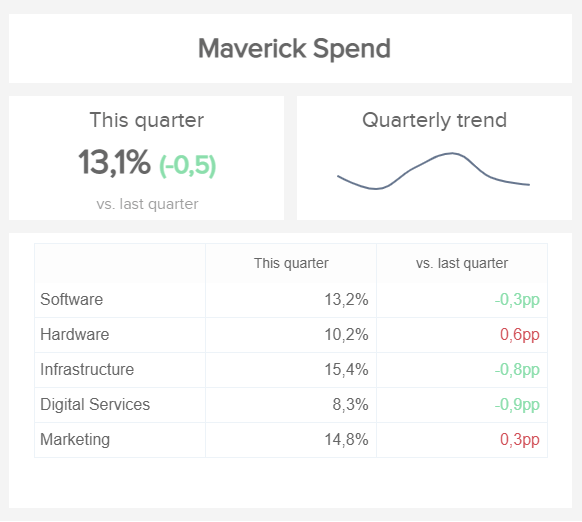
MAVERICK SPEND
Monitor your out-of-contract spendingThe maverick spend tracks the spending of goods or services from non-contracted or non-preferred providers. It represents a big challenge for organizations as it can bring adverse consequences especially in cost savings. For example, a high maverick spend can lead to increased expenses by not being able to benefit from discounts previously stated with contracted vendors or damaging the relationship with preferred ones and affect future contract terms. Besides increasing costs, maverick spending can also show a lack of communication inside the business. Some departments might be managing their purchasing on their own without considering the contracts that are already in place. To avoid this, it is necessary to implement a centralized system that informs the entire organization about purchasing policies.
Performance IndicatorsTrack this KPI for different business areas and departments to easily pinpoint if one of them is lacking and implement corrective measures.
Relevant Showcase Dashboard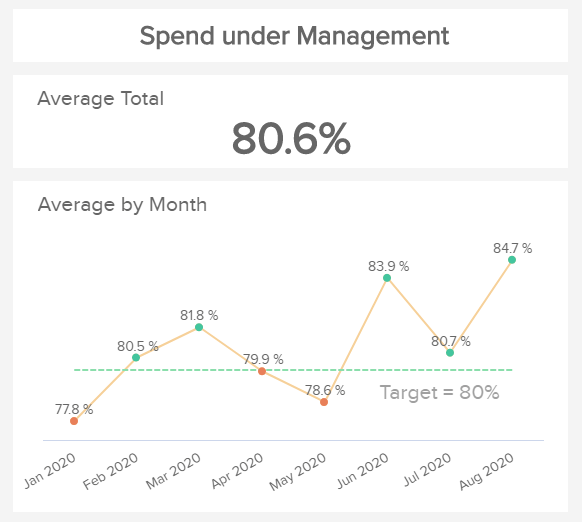
Spend Under Management
Track and optimize your expendituresSpend under management is one of the procurement cost savings strategies that falls under management. In essence, it includes strategically managed spend that covers established rates with your preferred suppliers, spend under contract to get the contracts into a procurement system, and control systems to make sure people are actually using negotiated prices. When you consider all these elements when evaluating this metric, you will uncover extreme potential for unrealized savings. It’s critical to perform regular spend analyses, evaluation of suppliers, and review contracts in order to identify operational and strategic savings. Modern tools such as datapine can certainly help.
Performance IndicatorsMake sure that similar $200 products aren’t being purchased 200 times per year but consolidate them, negotiate a volume discount and save countless dollars.
Relevant Showcase Dashboard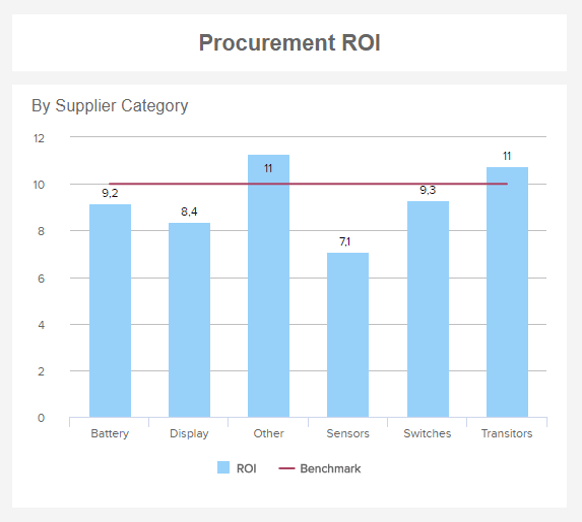
Procurement ROI
Determine the profitability of investmentsThe last of our procurement metrics, Procurement ROI is however not the least. The Procurement ROI differs from the regular ROI usually calculated with the formula ROI = (gain from investment – cost of investment) / cost of investment. For many professionals of the sector, it is the most important of all procurement KPIs, but it is not the single best and should be analyzed alongside other metrics to have the big picture. To calculate the procurement ROI, you need to divide the annual cost savings by the annual internal cost of procurement, and express it as a ratio. It is a good single metric but of course does not speak for the broader “scorecard of supply”, and does not include cost avoidance. Besides, if the procurement investments are too low, you are more likely to measure the hard cost savings mainly, without the avoidance and other value chain improvements.
Performance IndicatorsProcurement ROI should have a massive payback, and setting it 10 times higher than the internal investments for the procurement department is a good target.
Relevant Showcase Dashboard


Setup only takes a few minutes. No credit card required!