
KPI Examples for Zendesk
ZENDESK KEY PERFORMANCE INDICATORS AND METRICS
✔ See different templates & designs ✔ Find & track the right Zendesk KPIs for an outstanding customer support
A Zendesk KPI is a transparent performance indicator that can be used to reliably monitor the quality of a company's customer service department and processes. Zendesk metrics help to analyze and optimize various customer interactions to achieve better results.
Zendesk is a customer service management tool that allows support agents and business executives to manage their customer service processes efficiently. It is no secret that a good service experience can make or break a company in today’s crowded market. For this reason, companies that benefit from professional customer service reports to meet their client’s needs are the ones who achieve customer service success. Here you will find a detailed list of Zendesk metrics, created with datapine’s state-of-the-art KPI tool, covering areas such as ticket support, call center performance, and service agent performance. By utilizing these KPIs together with an interactive, dynamic Zendesk dashboard, businesses can extract real-time actionable insights that will skyrocket their customer service experience.
Here is the complete list of the most important Zendesk KPIs and metrics, that we will discuss in this article in every detail:
Tickets & Ticket-Status: What is the status of customer inquiries?
First Response Time (FRT): How quickly do you react to customer requests?
Average Resolution Time: How long do you need to close a request?
Customer Satisfaction: How satisfied are your customers with the solution?
Tickets by Types: What are the main customer concerns?
Tickets by Channels: Which contact options do customers use?
Top Agents: Who is the most effective support agent?
Average Answer Time: How quickly do your agents answer the calls?
Unsuccessful Inbound Calls: When and how are your clients failing to reach you?
Quality Rate: Are your clients happy with your calls service?
Average Leg Talk Time: How long it takes your agents to resolve a call?
First Contact Resolution Rate: How often can tickets be directly resolved?
Utilization Rate: Which employees are not fully utilized?
Net Promoter Score: Are customers recommending you to others?
Digital Assistant Engagement Rate: Are customers interacting with the bot?
Digital Assistant NPS: Are interactions with the bot successful?
Digital Assistant Referral Rate: How efficient is your chatbot?
Digital Assistant Resolution Rate: How is your chatbot performance developing?
Article Suggestions CTR: Is the bot suggesting useful resources?
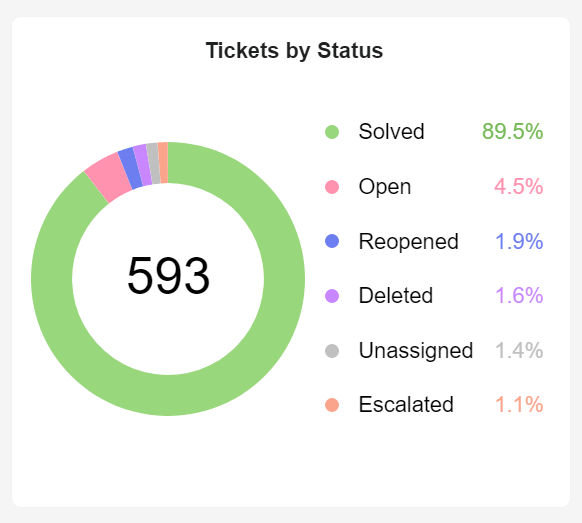
Tickets by Status
What is the status of customer inquiries?Our first Zendesk KPI is the number of support tickets received and the corresponding ticket status. You should always have an eye on these metrics in order to effectively manage the time and resources of the customer service team and to provide customers with high-quality support at all times. The categorization of a ticket to a ticket status can be set or updated either manually or automatically using defined business principles. We have shown you 6 exemplary status values of currently 593 processed tickets: solved, open, reopened, deleted, unassigned and escalated tickets.
Performance IndicatorsIf the 6 default status values in Zendesk (new, open, pending, on-hold, solved, closed) are not sufficient for you to monitor your workflow, you can add individual user or organization fields to cover them.
Relevant Showcase Dashboard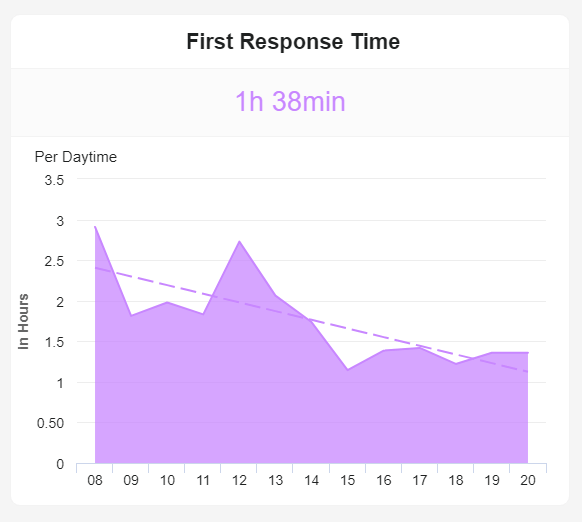
First Response Time
How quickly do you react to customer requests?Our second Zendesk metric is first response time (FRT), which is the average time between a customer inquiry to support, and a customer service representative's first response. This indicates how long a customer has to wait before being helped with their request. This has a direct influence on customer satisfaction and it is a great challenge in business practice to keep FRT constantly low, regardless of the time of day or the days of the week. As an example, we have shown you the first response time from 8 a.m. to 8 p.m. as shown in the business information section.
Performance IndicatorsFor e-mail or live chat enquiries, automated, individualized confirmations of incoming requests are very useful. You can also analyze the FRT for various times of day and days of the week to identify peaks and include them in your planning.
Relevant Showcase Dashboard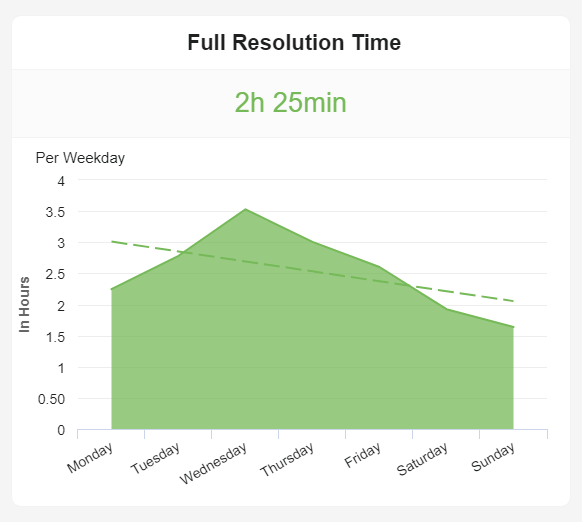
Full Resolution Time
How long do you need to close a request?The average response time (or mean time to repair – MTTR) is the average time taken by customer service to resolve a customer issue after it opens. It is usually measured in hours or days, excluding non-operating working hours. Analogous to the first response time already discussed, the average solution time is also directly related to customer satisfaction. The faster customer support is able to solve customer problems, the more satisfied they will be. In our visual KPI example, we have presented the MTTR for different weekdays.
Performance IndicatorsMonitor and analyze the average resolution time along with the first contact time to develop the best possible strategy to reduce both metrics.
Relevant Showcase Dashboard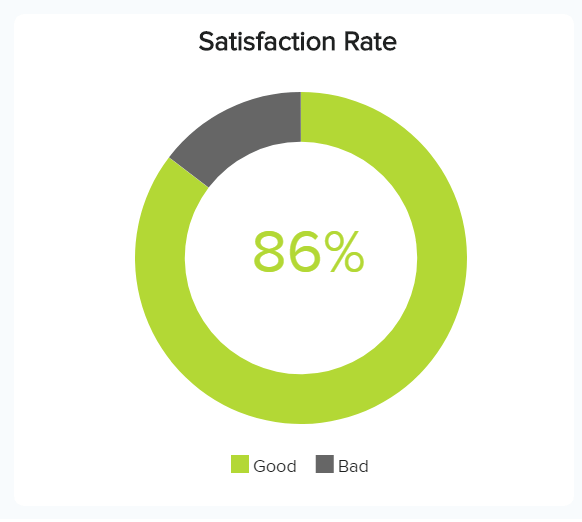
Customer Satisfaction Rate
How satisfied are your customers?In practice, the customer satisfaction score (CSAT) is a frequently used indicator to measure the satisfaction of customers with the entire company, specific products or even customer support. This is usually measured on a scale of 1-5, but sometimes scales of 1-3 or 1-10 are used due to specific requirements or cultural differences. Emoji-based CSAT questions are also sometimes used. The advantage of the CSAT is in its directness in querying customer satisfaction, which can also be a controversial disadvantage. Here the net promoter score (NPS) offers a solution (see below).
Performance IndicatorsPeriodically monitor customer satisfaction related to customer support. Analyze customer satisfaction for individual teams and support staff.
Relevant Showcase Dashboard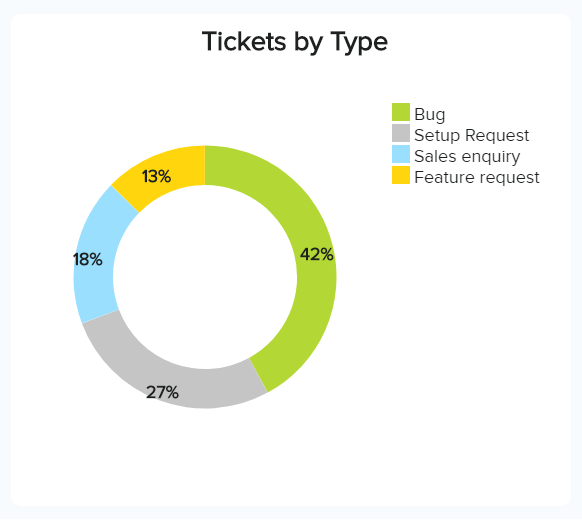
Support Tickets by Type
What are the main customer concerns?Our next Zendesk KPI is the number of different tickets by types. Of course, the possible ticket categories for each company are very different depending on the business model and industry. We have presented a possible distribution for a software company: 42% bug reports, 27% setup questions, 18% sales requests and 13% requests for specific software features. Such an overview helps support in planning resources and the necessary know-how to process the requests, but also provides product management with valuable customer feedback on the use of the software, e.g. frequently occurring user problems.
Performance IndicatorsTry to divide all customer support requests into a maximum of 5 to 6 main categories in order to conduct in-depth analyses of each category.
Relevant Showcase Dashboard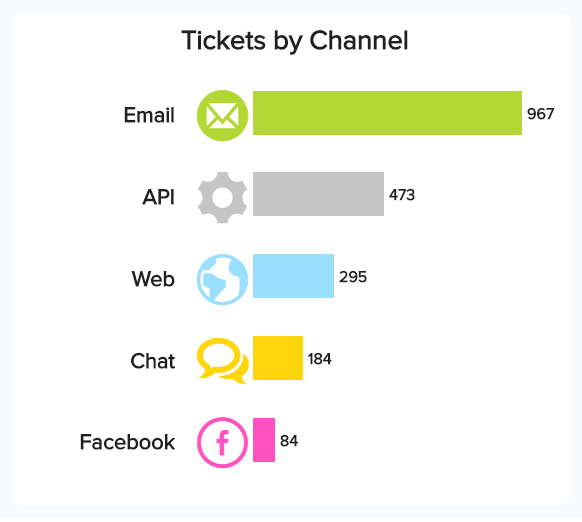
Support Tickets by Channel
Which contact options do customers use?This Zendesk KPI shows at a single glance which contact options customers most often use: do customers contact support via live chat, the contact form on the website, or directly via e-mail? Here, too, you should analyze the relevant key metrics already discussed (first response time, average resolution time, customer satisfaction, ticket types) for the individual channels in detail in order to identify optimization potential. For example, customers who use online chat could be significantly more dissatisfied with the support service than those who send their enquiries by e-mail. Then you should analyze the underlying causes in order to take appropriate countermeasures.
Performance IndicatorsAnalyze the discussed crucial success factors for the various support contact options. In addition, a trend analysis may be useful to meet future customer needs.
Relevant Showcase Dashboard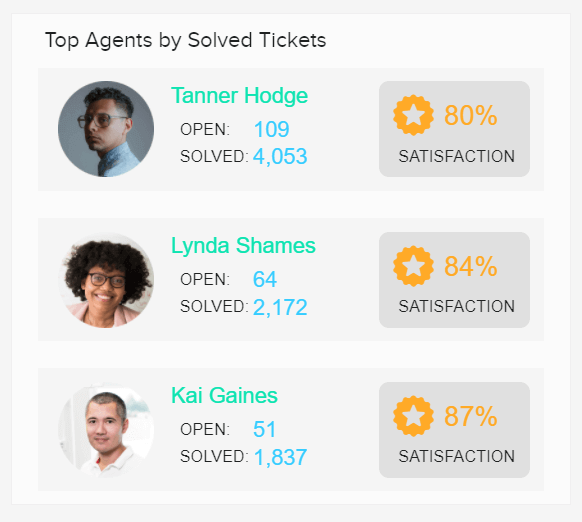
Top Support Agents
Who is the most effective support agent?As already mentioned, you should, of course, also monitor the performance of the individual support employees or teams. This helps you to analyze the quality of customer support as granularly as possible and to identify any weaknesses. For example, a support employee might have a low customer satisfaction score. However, a closer look at the customer satisfaction of this support employee by ticket category reveals that he or she does not perform well, especially with setup requests. In this case, further training of this employee regarding the setup of the software could help.
Performance IndicatorsAnalyze the approach of support staff with particularly high levels of customer satisfaction for your most common support queries. This can provide you with valuable new insights to develop best practices for the entire support team.
Relevant Showcase DashboardBecome a data wizard in less than 1 hour!
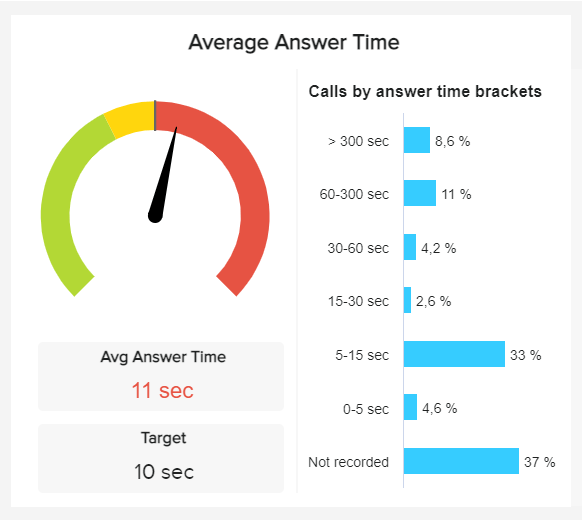
AVERAGE ANSWER TIME
How quickly do your agents answer the calls?This is a Zendesk KPI directly related to the performance of your calls as it monitors the average time it takes an agent to answer a call since it started ringing in the system. This metric is calculated by taking the total answer time of all calls and dividing it by the total number of calls answered during a specific time period. It is important to consider that if a call was not answered by an agent and it had to be passed to another one, the calculations include the separate answer time of each agent, the same thing happens for calls that had to be transferred to another agent for extra information or help. Measuring the average answer time is beneficial as it lets businesses understand if their call system is efficient when transferring incoming calls to agents.
Performance IndicatorsMeasure the average answer time and drive deeper conclusions on the overall performance of your calls team. A healthy answer time can increase your satisfaction rates significantly.
Relevant Showcase Dashboard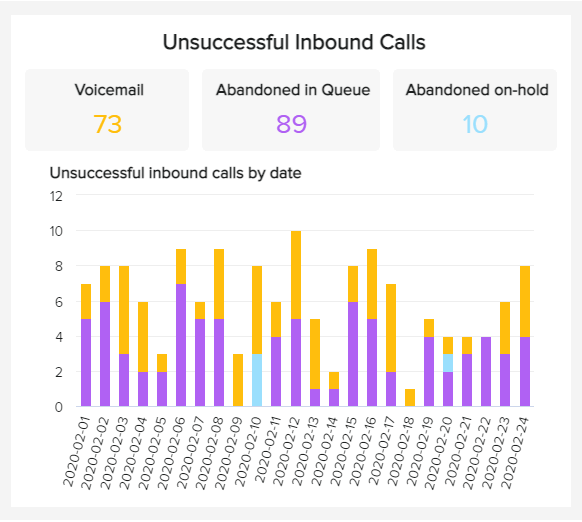
UNSUCCESSFUL INBOUND CALLS
When and how are your clients failing to reach you?The unsuccessful inbound calls KPI is another one of the Zendesk talk metrics, and it aims to measure the number of unsuccessful calls by type on each day of a set period of time. In the example on the right, we can see that the types of unsuccessful calls are voicemail, abandoned in the queue, and abandoned on-hold. The bar chart then displays these types of calls by their total amount on each day. By monitoring these Zendesk metrics on a daily basis, you can find deeper insights that can lead to a performance improvement, for example, we see that most of the days the highest abandonment is for callers waiting in the queue, this could mean you might need to hire more agents to deal with the call frequency or look deeper into your average wait time to understand why clients are leaving at this stage.
Performance IndicatorsInbound metrics like the unsuccessful calls directly influence the customer experience of your call center. If your abandoned calls are high, it might negatively impact your business reputation. Constantly monitor your unsuccessful calls and implement new strategies to keep them at a minimum.
Relevant Showcase Dashboard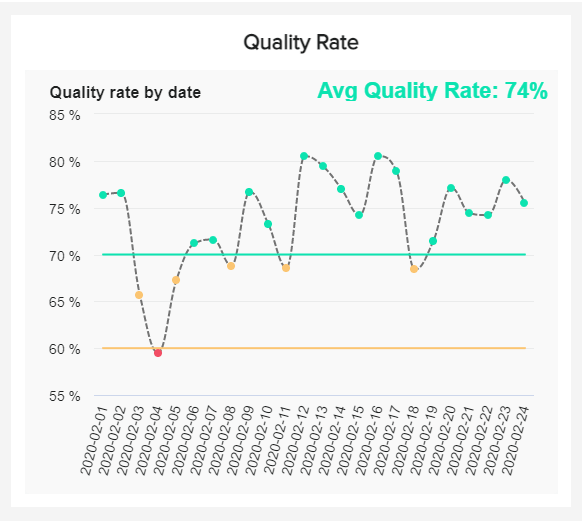
QUALITY RATE
Are your clients happy with your calls service?The quality rate is another Zendesk KPI to measure the performance of your call center. This metric is similar to the customer satisfaction metrics calculations since it depends on feedbacks to be measured. To put it simply, the quality rate is the percentage of calls that had good quality reviews from the total amount of calls in which quality was measured. In the example above we see a chart that tracks the quality rate of calls on a daily basis alongside a positive and a negative benchmark. In this case, a healthy quality rate would be over 70% which means this business is providing a good call service experience.
Performance IndicatorsSet a realistic target for your quality rate and monitor it constantly to find specific days in which your quality dropped, this way you can look into specific cases to identify patterns and workable solutions to prevent them from happening again.
Relevant Showcase Dashboard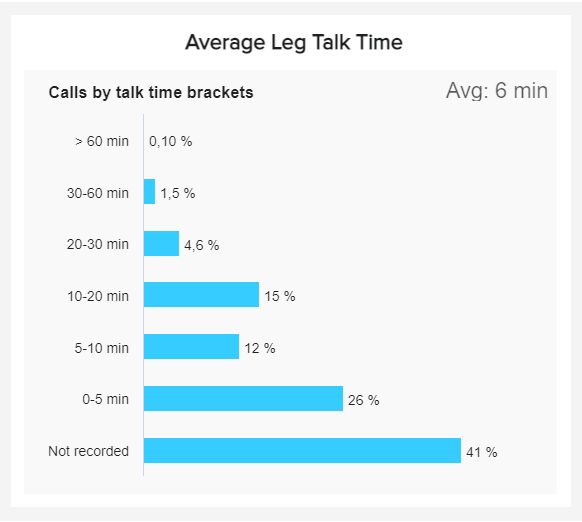
AVERAGE LEG TALK TIME
How long it takes your agents to resolve a call?Our next Zendesk metric is the average leg talk time and it aims to measure the time agents spend talking to end users on each call leg. A leg is used to mark the different stages on the call cycle so that they can be evaluated separately, this can be the time a caller spends listening to the welcome message, the time from when an agent accepts a call, an agent transferring the call to another area of the center, or others. In the example above we see that the call times are divided by brackets that show a percentage of the total calls on each time frame alongside an average of 6 minutes.
Performance IndicatorsCompare this Zendesk KPI with your agent’s activities to find out exactly what leg is taking longer than it should.
Relevant Showcase Dashboard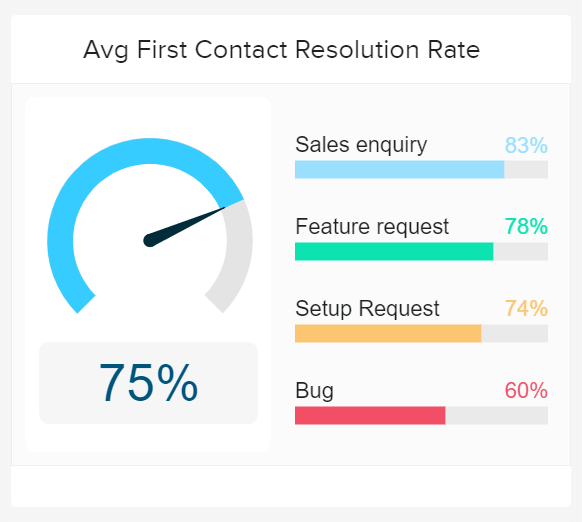
First Contact Resolution Rate
How often can tickets be directly resolved?The first contact resolution rate (ELQ) indicates the percentage of support requests or tickets that can be resolved directly with the customer's first contact attempt. An alternative name for the FCR is first fix rate (FFR). In practice, this term is used particularly frequently for telephone inquiries (first call resolution - FCR), but one common term makes sense for all support channels offered. The first contact resolution rate varies greatly from industry to industry; other influencing factors are the selected support channel and the type of ticket. A central success factor for the highest possible first contact resolution rate is a high degree of standardization and best practice guidelines for particularly frequent customer inquiries.
Performance IndicatorsThe higher the first contact resolution rate, the better. Thanks to a high first contact resolution rate, service costs can usually be reduced, scalability of the service business model guaranteed, and customer satisfaction increased.
Relevant Showcase Dashboard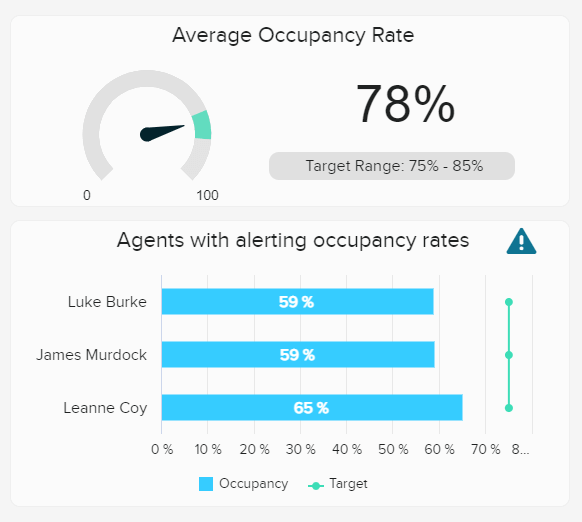
Utilization Rate
Which employees are not fully utilized?Our next Zendesk KPI – utilization rate (or occupancy rate) helps you monitor and plan the workload for the entire customer support team, as well as individual employees. Ultimately, it is a measure of how much time employees spend on truly support-related operational tasks, such as processing tickets, managing live chats or answering phone calls. Breaks, meetings or employee training, on the other hand, are not included. As shown in our visual KPI example, realistic target utilization rates for the customer support should be between 75 and 85 percent.
Performance IndicatorsMonitor the utilization rate on a team and employee basis. For significantly lower or higher utilization rates of individual employees, analyze the underlying causes.
Relevant Showcase Dashboard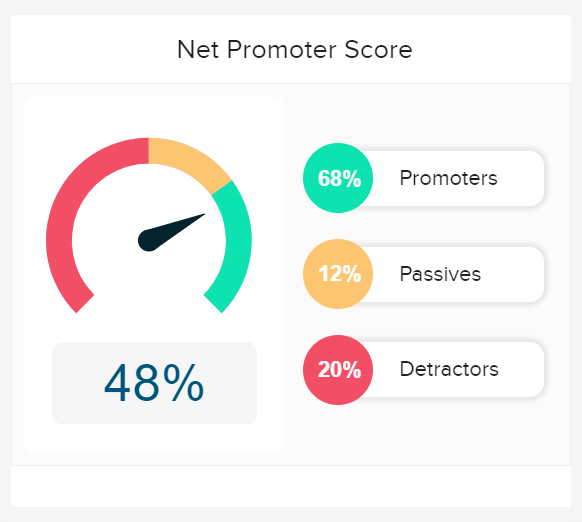
Net Promoter Score
Are customers recommending you to others?The net promoter score (promoter surplus) is another important indicator in customer support to measure customer satisfaction. In contrast to the customer satisfaction score (CSAT), the net promoter score indirectly measures the customer satisfaction with the customer's willingness to recommend a company. The following question is used: "On a scale of 0-10, how likely is it that you recommend our company to a friend or colleague? Then only answers with 9 or 10 are rated as "promoters" (advocates), whereas 0 to 6 are considered critics (detractors). Answers 7 and 8 are not considered any further, as they are undecided (passive). Subsequently, the difference between promoters and critics is formed and finally a value between -100 and +100 is obtained.
Performance IndicatorsIn addition to the CSAT, use the net promoter score to measure customer satisfaction and compare the results. With the net promoter score, values of over 40% can be rated as good, over 50% as very good and over 60% as excellent.
Relevant Showcase Dashboard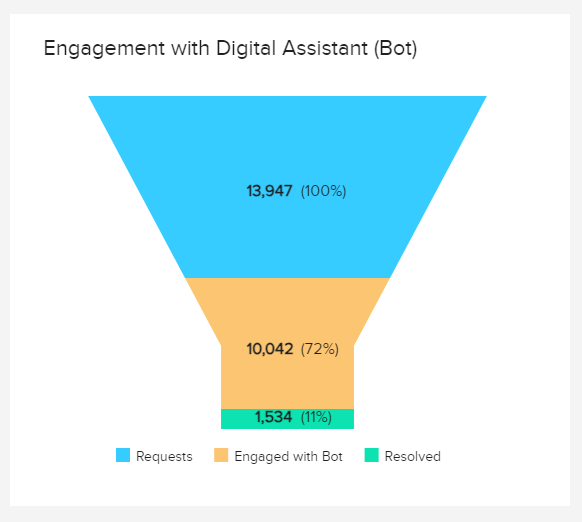
Digital Assistant Engagement Rate
Are customers interacting with the bot?This Zendesk KPI shows the percentage of users that engage with the chatbot. It lets you understand how valuable your chatbot is as well as the percentage of requests that end up being solved. In this case, the KPI is displayed using a funnel where we can see that 72% of the total requests ended up engaging with the bot. That is a positive percentage on its own; however, only 11% of those requests or issues ended up being solved. This is obviously a low percentage and needs to be looked into to ensure your bot offers the best solutions to individual requests. For instance, the bot may not be prepared to answer common questions or users are facing issues that require human interaction.
Performance IndicatorsIf your digital assistant has low engagement, consider its placement on your website or customer journey.
Relevant Showcase Dashboard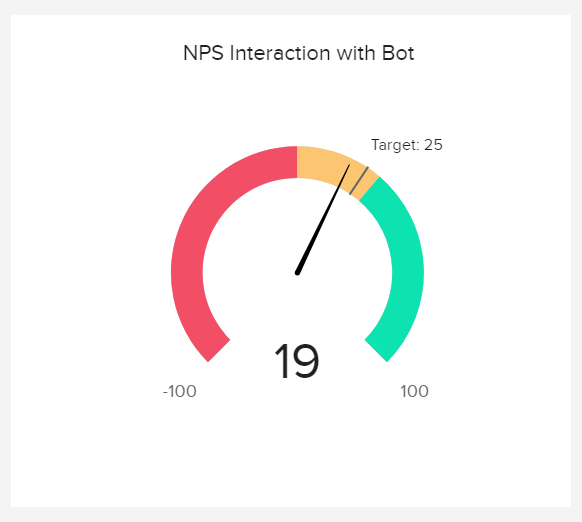
DIGITAL ASSISTANT NPS
Are interactions with the bot successful?This KPI tracks the satisfaction level after interacting with the bot. Businesses often gather this feedback at the end of the interaction by asking users to evaluate their experience with a rating or a positive or negative comment. Naturally, you want to keep your bot NPS as high as possible by tweaking its capacity to solve customer queries, requests, or issues as efficiently as possible. An effective way to do so is to carefully analyze interactions and extract improvement opportunities from them. For instance, preventing the bot from replying “I don’t understand the question” multiple times during an interaction and transferring the request to an agent.
Performance IndicatorsSet up a realistic target to measure the performance of your digital assistant NPS.
Relevant Showcase Dashboard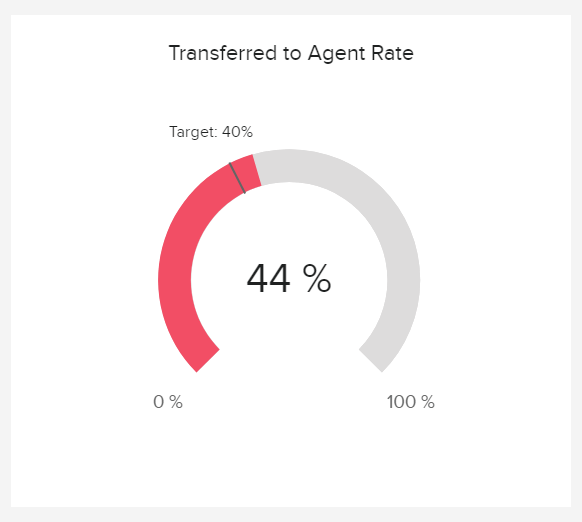
DIGITAL ASSISTANT REFERRAL RATE
How efficient is your chatbot?Moving on to another chatbot-related KPI, we have the referral rate. It basically shows the percentage of total chatbot interactions that end up being transferred to an agent. Businesses use this metric to understand the capacity and efficiency of the chatbot to solve customer queries or issues properly. That said, it is important to note that its calculations don’t consider interactions where the customer requested an agent at the start of the conversation, as this doesn’t help evaluate the chatbot's effectiveness in answering requests. A healthy referral value might vary depending on the nature of requests the business has, but it is recommended to keep it under 40%.
Performance IndicatorsTake a deeper look into the referral reasons and find improvement opportunities. It doesn’t mean the same to say a question was too hard for the bot to understand than to say it simply required further action.
Relevant Showcase Dashboard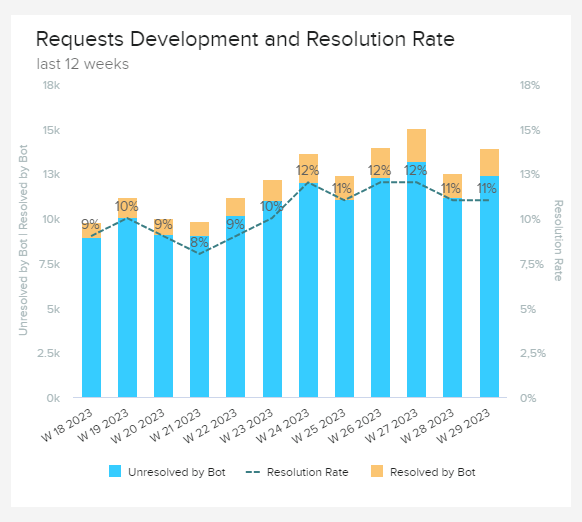
DIGITAL ASSISTANT RESOLUTION RATE
How is your chatbot performance developing?This next KPI tracks the digital assistant resolution rate. It shows the development of the chatbot’s resolved and unresolved issues complemented with a resolution trend line. It is a great indicator to track as it allows businesses to evaluate the success of their bot-related strategies and extract trends and patterns to improve. In this case, we can see that the bot has a low resolution rate with about 90% of requests marked as unsolved. Again, this could either mean that the bot is not qualified to assist users with their requests or that requests are too complicated and require human attention.
Performance IndicatorsMonitoring this KPI weekly will help you spot any issues or improvement opportunities promptly.
Relevant Showcase Dashboard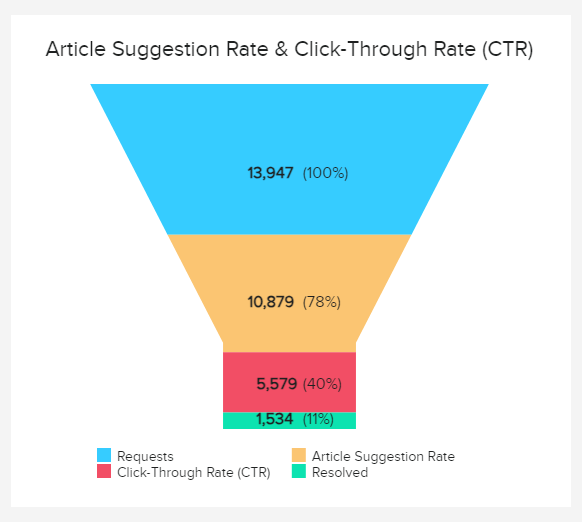
ARTICLE SUGGESTIONS CTR
Is the bot suggesting useful resources?Moving on with our list of professional Zendesk KPIs, we have another example related to chatbot performance, the article suggestion & click-through rate. Sometimes, bots direct users to useful documentation, such as articles or other pages, to help them answer their questions. This KPI helps companies understand if these suggestions are useful to users by evaluating the CTR. As seen in the funnel above, the article suggestion CTR is 40%, meaning over half of the total customers that make a request end up clicking on the article. This number can be positive or negative depending on the organization's goals, but it definitely needs to be looked into as the resolved section is still on the lower side.
Performance IndicatorsTrack the article suggestion CTR by specific request topics to find improvement opportunities.
Relevant Showcase Dashboard


Setup only takes a few minutes. No credit card required!