
KPI Examples for Twitter
TWITTER KEY PERFORMANCE INDICATORS AND METRICS
✔ See different templates & designs ✔ Find & track the right Twitter KPIs to meet your corporate objectives
A Twitter KPI or metric is a transparent way to evaluate different social media marketing efforts on Twitter concerning your individual goal attainment. Twitter metrics help social media managers to optimize Twitter campaigns and illustrate the value of their work.
Here is the complete list of the most important Twitter KPIs and metrics, that we will discuss in this article in every detail:
Average Amount of Link Clicks: How many users have clicked on my links?
Average Engagement Rate: Are my Tweets interesting to my audience?
Average Amount of Impressions: How many users have seen my content?
Top 5 Tweets by Engagement: Which Tweets perform the best?
CPM of Twitter Ads: How much do you spend for 1000 Impressions?
Results Rate of Twitter Ads: How is my campaign performance tracked?
Cost per Result of Twitter Ads: How much am I spending per tracked result?
Interests of followers: What are my Followers focused on?
Number of Followers: How many followers do I gain or lose?
Hashtag Performance: Which hashtags work best for you?
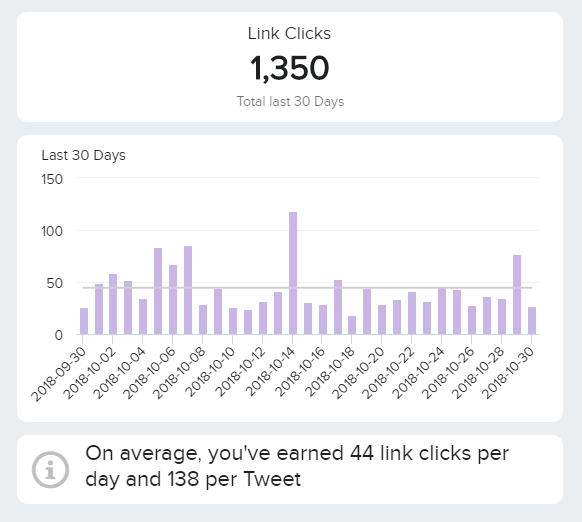
Average Amount of Link Clicks
How many users have clicked on my links?The Link Clicks metric expounds on the average number of clicks you gained per post and per day. By gaining a visual representation on which days of the month were most engaging, and which ones provided a decreasing trend, you can easily tailor your content on the specific topic or inspect in more detail how your numbers have changed. By identifying these trends, you can develop a strategy on how to increase your clicks and provide the most relevant content. By performing an additional analysis, it would make sense to look deeper into these insights on a post level so that you can get a more holistic view of your Tweets.
Performance IndicatorsThis Twitter KPI helps you to monitor which posts have obtained the highest number of clicks and implement those findings in your future posts.
Relevant Showcase Dashboard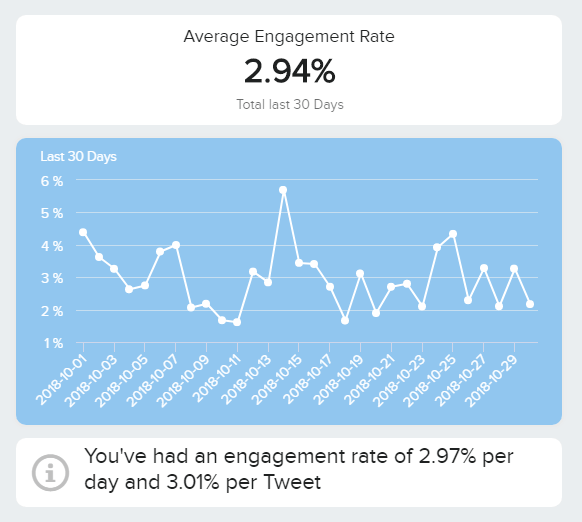
Average Engagement Rate
Are my Tweets interesting to my audience?Like other social media channels, Twitter is also important regarding engagement with your audience. Potential Engagement on Twitter are the number of Media engagements, Likes, Detail expands, Retweets, Profile clicks, Hashtag clicks, Link clicks and Replies, etc. All those metrics can answer your question if your Tweets are interesting or you should change your approach. Within a time aspect, which you can customize and adjust every single data for your specific strategy, the visual view can indicate trends or frequencies on how your Tweets are acknowledged and perceived within your audience. The Engagement Rate daily, and per Tweet, will show you the specifics of your content’s total success of interactions made on this channel.
Performance IndicatorsIncrease your overall Engagement Rate by providing content relevant to your audience and monitor your data to see how to adjust.
Relevant Showcase Dashboard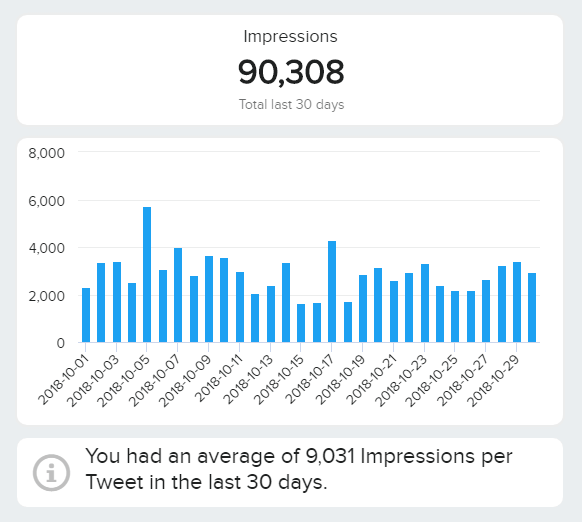
Average Amount of Impressions
How many users have seen my content?The amount of Impressions on Twitter is defined by the number of times users saw the specific Tweet. If you set a specific date range, you can see the total number of Impressions, which can help you determine if one month was more successful than the previous. It goes hand in hand with the Engagement Rate since the number of Impressions will increase if someone searches the Hashtag you have used in your Tweet, or if it’s shared or commented on - additional followers will see it, and, again, the number of Impressions will increase. Keep that in mind for your posting strategy.
Performance IndicatorsUse your Engagement findings together with the Impressions and see which kind of content works best to increase these both Twitter metrics.
Relevant Showcase Dashboard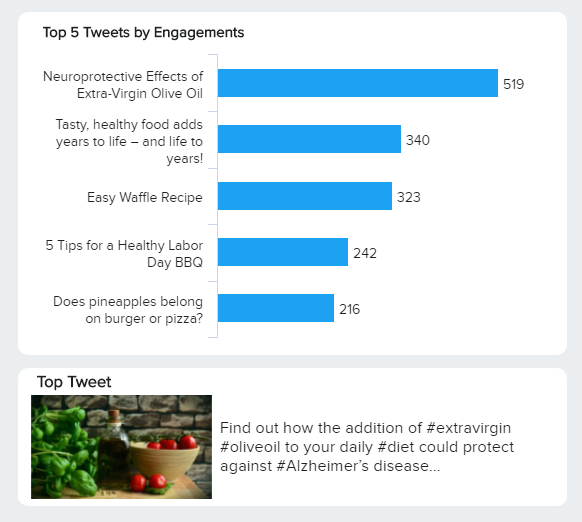
Top 5 Tweets by Engagement
Which Tweets perform the best?One of the Twitter KPIs that will show you the best results from your Tweets, is the Top 5 Tweets by Engagement. If you see in more detail how many Engagements has a specific Tweet gained, then you can use the same approach for your next Tweets. You can also inspect the Top Tweet and see the visual and text you have used for the exact post, which can help you to identify the next steps on your Twitter strategy. These 2 Twitter metrics, if approached together, can deliver a significant increase - as mentioned before, Impressions will increase if Engagement increases.
Performance IndicatorsInspect your Top 5 Tweets by Engagements so that you can get a better understanding of what kind of content is well received in the Twitter community.
Relevant Showcase Dashboard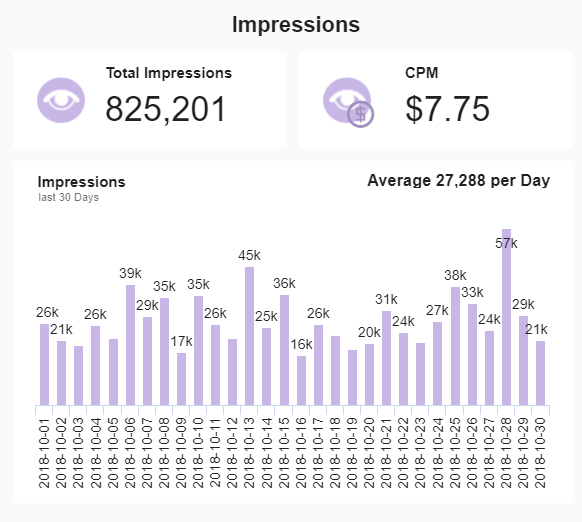
CPM of Twitter Ads
How much do you spend for 1000 Impressions?With more than 300 million active users per month, advertising on Twitter can also serve as part of your social media strategy since you have an extreme potential to reach your target audience. Twitter offers many advertising options, from promoting your Tweets to mobile apps. By establishing a campaign’s objective, you can clearly track your results and performance. After all, one of the first question you may ask yourself, when you’re identifying the performance, is how many times my Ads were seen and what was my average CPM (Cost-Per-Mille)? The cost of your advertising efforts should be viewed within your industry and benchmarks on which you can set the average amount you can spend daily.
Performance IndicatorsIdentify your goal and the maximum price you would pay per 1000 Impressions (CPM) based on benchmark data.
Relevant Showcase Dashboard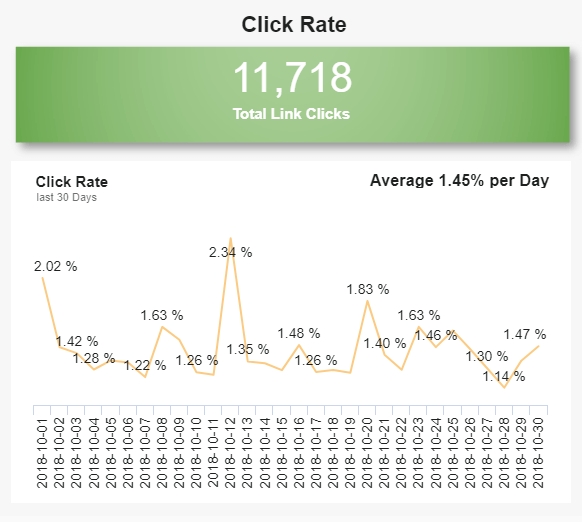
Results Rate of Twitter Ads
How is my campaign performance tracked?The Results Rate of your campaigns is tracked based on your established goal. If you set your goal as CTR of link clicks, you will perform a Link click campaign. You can also identify an average percentage to see whether your strategy is on track or needs additional adjusting. You can also see a daily view of your Click Rate performance or customize your requirements so that you can easily access every information you need. That way you achieve a beneficial view of your most important Click metrics for your advertising efforts. With datapine, that is possible within seconds and just a few clicks.
Performance IndicatorsEstablish your campaign goal and monitor your campaign performance on a specific date range or incorporate alarms into your tracking to identify particular anomalies.
Relevant Showcase Dashboard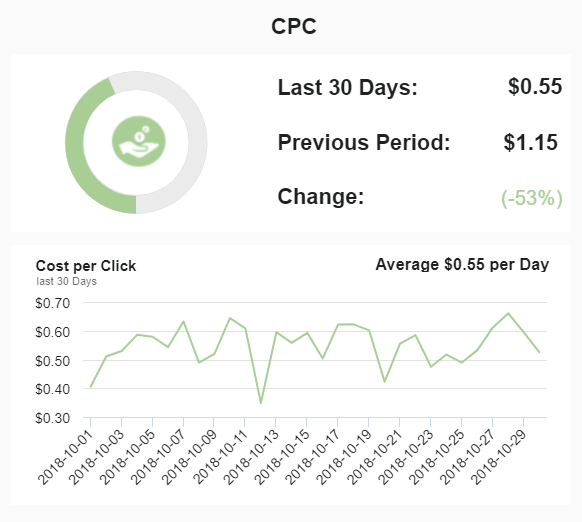
Cost Per Result of Twitter Ads
How much am I spending per tracked result?Your costs for Twitter Ads can be evaluated based on the already mentioned campaign goals. If you set a CPC performance, you can track the specific costs on selected periods. Your Cost Per Result is actually identifying how much you are paying for specific actions people are taking while interacting with your Ads. You can also see the change on specific dates and the average amount spent per day compared to the previous period. All these data can provide deeper insights into your campaign spending strategy and gained results. Use these Twitter metrics examples as a roadmap to define your own advertising strategy.
Performance IndicatorsIn this example, we have shown the CPC cost, but identify which kind of payment method works best for your industry and, also, compare your results over time.
Relevant Showcase DashboardBecome a data wizard in less than 1 hour!
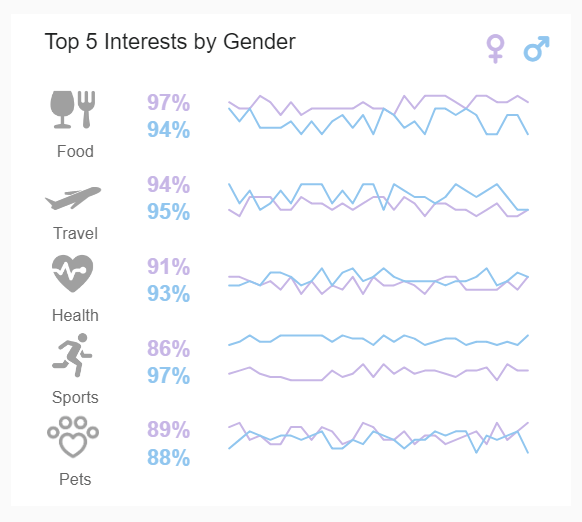
Top 5 Interests of Followers
What are my Followers focused on?Knowing your audience on Twitter is one of the main indicators on how to manage your overall content strategy. On this visual, Twitter KPI examples which we show represent the demographics on the top 5 interests by gender and trends. Interests of the gender metric will vary, likewise, the percentage on which they are displayed, so you can easily spot what kind of audience you attract the most. Additionally, it would be interesting to analyze the country, language and region, metrics on which you will base your content production: do you need translations, what kind of tone works best and what culture am I reaching to?
Performance IndicatorsTrack your demographics and audience interests to see what kind of content will attract even more of your target audience.
Relevant Showcase Dashboard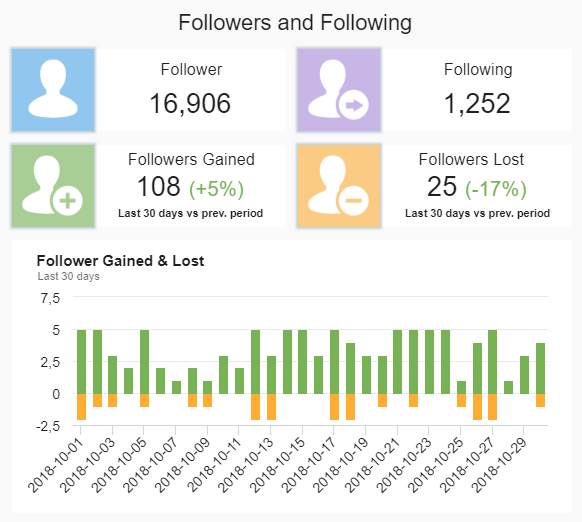
Number of Followers
How many followers do I gain or lose?When you have a clear view of the number of followers, how many you have gained or lost over a specific period, you can easily recognize a trend that is occurring on your Twitter channel. Comparing these results with the previous period will identify if your followers’ growth is on track or needs additional adjusting. You can also see the exact amount of the accounts you follow, which is a useful metric to see what kind of content will be delivered to your Twitter feed. These numbers are useful since the followers’ count is still an important part of a social media strategy.
Performance IndicatorsDefine how many followers you want to build over a specific period and compare the results you gained.
Relevant Showcase Dashboard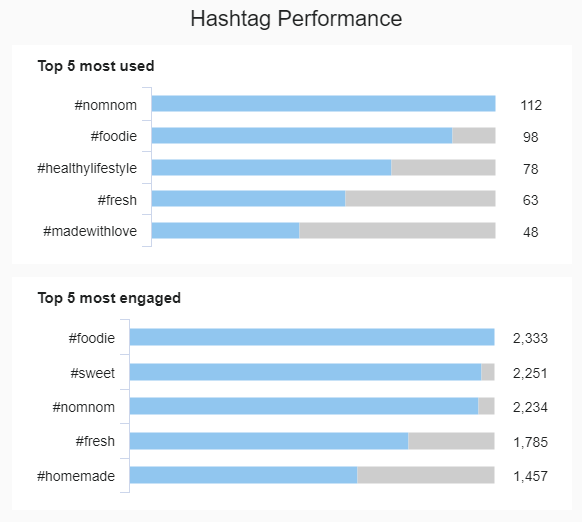
Hashtag Performance
Which hashtags work best for you?When you set your specific hashtags on which you want to build your Twitter channel, identifying the performance will be of utmost importance. Your most used hashtags compared to the most engaged ones can make or break your Twitter performance. After all, this social media channel was the first one to utilize hashtags and changed the way we search social media content. When you compare the performance of your hashtags, you can easily spot which ones you can use for your future postings, if they perform well. Always accommodate your analysis to adjust and optimize your Twitter strategy so that you can build more relevant results.
Performance IndicatorsAnalyze your most used and engaged hashtags to help you appear in the search results as a relevant profile and test over time.
Relevant Showcase Dashboard


Setup only takes a few minutes. No credit card required!