YouTube Dashboard examples
A YouTube dashboard is a valuable tool to track the success of your channel, the performance of your videos, the behavior of your viewers, and provides an all-around monitoring view, and insights, on how to optimize your video social media strategy.
Video content is growing more and more by the day, and YouTube is the preferred platform for users that want to find product reviews, travel tips, and any other kind of useful information. With that in mind, extracting the maximum potential out of your channel by using the power of data is the path to success. datapine’s dashboard software allows you to connect all your YouTube information and visualize it together in a professional business dashboard filled with your most important YouTube KPIs. This way, you will get to know your viewers on a deeper level and identify the types of content they enjoy the most while securing yourself with great results.
Let's take a look at these 4 professional YouTube dashboard examples covering different video analytics areas:
Video Performance Dashboard - Channel Performance Dashboard - YouTube KPI Dashboard - YouTube Growth And Revenue Dashboard
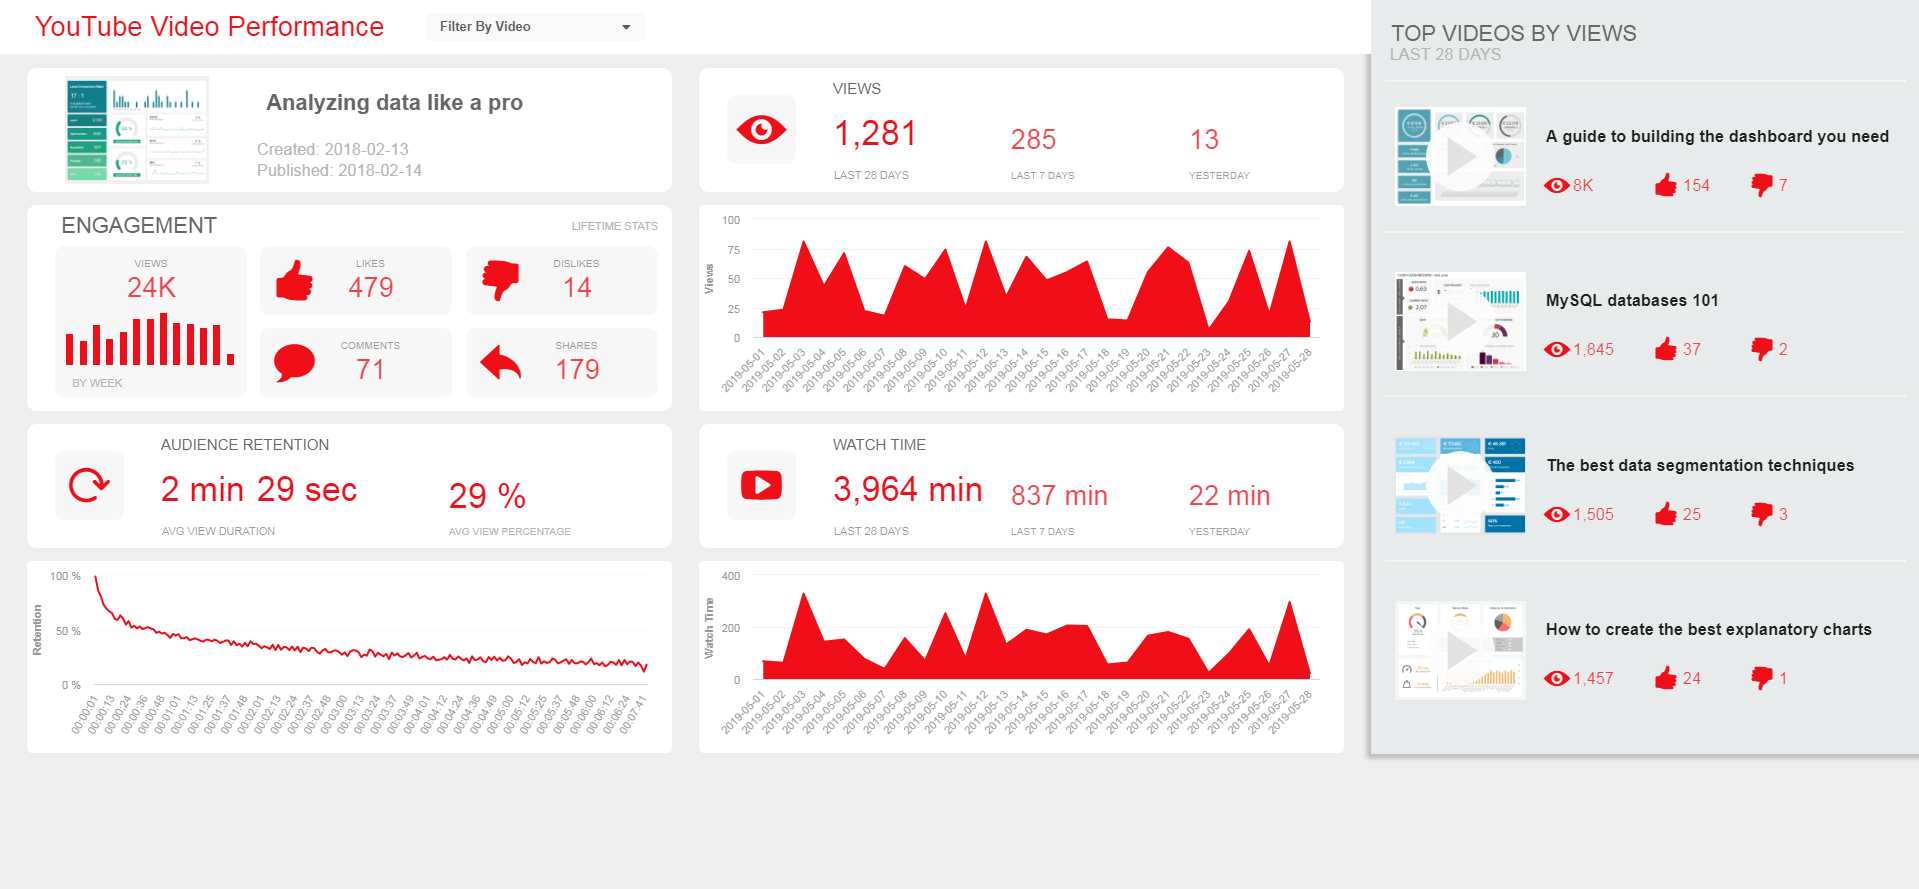
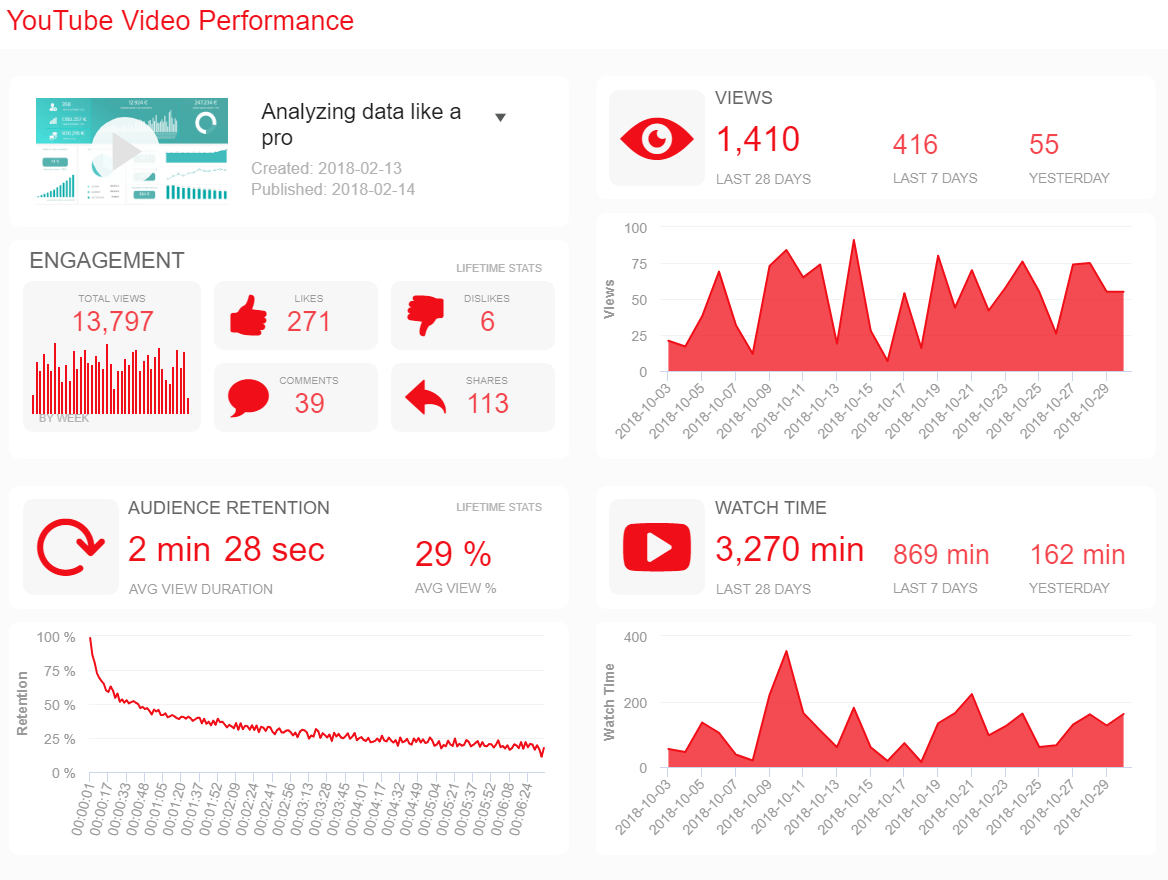
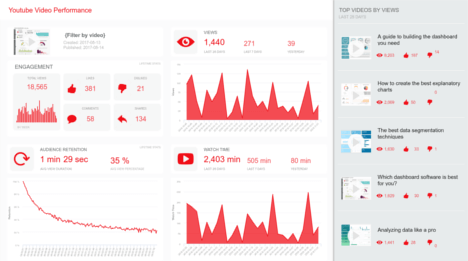
YouTube Video Performance Dashboard
Open YouTube Video Performance Dashboard in Fullscreen

To understand how your content echoes within your community, it is good to analyze specific video related metrics that will translate your video’s data-story. By analyzing single YouTube videos in detail (topics, technical differences, format, etc.), comparing and identifying the best versus the worst working ones, you can use those insights to optimize your content strategy and develop best practices. Besides, tracking the performance of your videos is the only way to improve your YouTube marketing strategy, so it is of utmost importance to do so.
On our YouTube video performance dashboard, we are focusing our analysis on a single video, instead of having the broad overview as in the other 2 dashboards we will discuss afterward. This YouTube dashboard example shows the total number of Likes, Dislikes, Comments, and Shares, along with the number of Views. This whole dashboard can provide you with a simple overview, and spotting any spikes, with datapine, can be made instantly, without exporting and filtering several spreadsheets at once.
Below, the Audience retention tells you more about the Average view duration of your video, and how your retention performs. The drop-off point should be analyzed in more detail since it will tell you the exact second people stopped watching. Pay close attention to your first 15 seconds of the video, that’s when viewers are most likely to drop-off, according to YouTube. By experimenting and optimizing your content, you can increase retention and attract users to watch as many seconds or minutes as possible. The last section of this YouTube dashboard example will tell us more about the total amount of Watch Time, in the last 28 days, last 7 days and what happened yesterday. This metric is interesting to follow since you can easily spot the amounts in a simple visual and see how your video is performing. The higher the amount of Watch time, the better the chance that users will perform additional actions and your other metrics can increase in their values.
By tracking a single video performance, it is easy to evaluate how your content is perceived by your viewers. While setting your own important indicators to follow, you can build a complex YouTube Ads dashboard with simple clicks, and evaluate your advertising efforts, also. Our examples will show you how you can utilize datapine to the best of use with cost-effective and clear insights, and maximum insights into one simple interactive place.
When you start a YouTube channel, the excitement and thrill are directed towards the videos you make, the first Likes and Comments you get, and all the new creative ideas you have day after day that you want to implement. However, once you are up and running, to ensure that your content is performing the best way it can, and that you are in line with your audience, you will need to go beyond producing videos: you will need analytics.
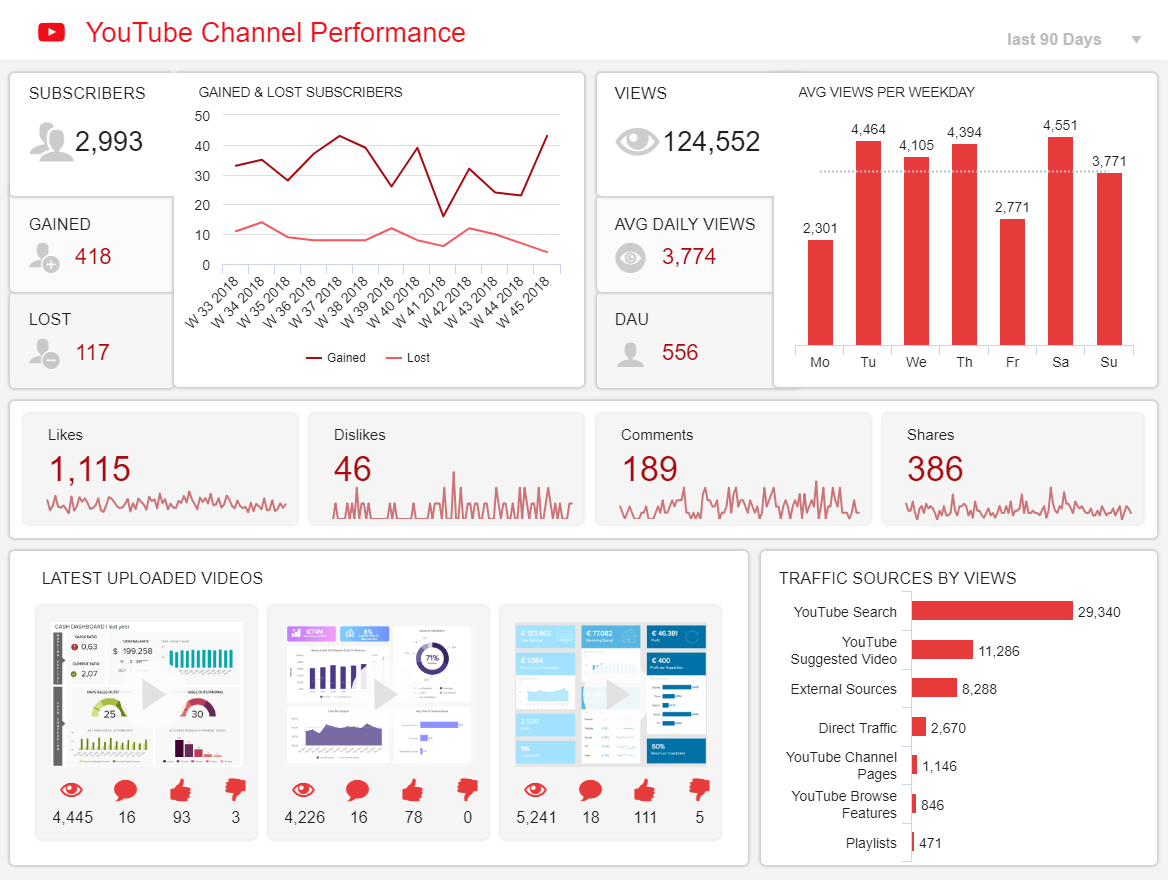
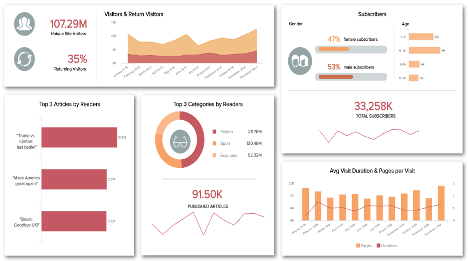
A YouTube channel performance dashboard is what you need to dive into your channel results and understand how to improve them. In our example, the top left part of this dashboard focuses on Subscribers: how many there are in total, how many were gained and lost over a certain period, in this case, 90 days. An evolution, visible on the line chart, compares both types so you can get a neat visual overview. Next to it, the Views activity is detailed: how many were gained in total, the average daily views and the average daily active users (DAU). The bar chart provided in this section expands on the Average views per weekday. This metric is interesting for you to know when your viewers and subscribers are more likely to be connected on YouTube – you can adjust your publishing schedule accordingly, to reach as many people as possible.
Below, other social media metrics are displayed: number of Likes, Dislikes, Comments, and Shares. These metrics show the Engagement of your audience – most interesting to analyze is particularly the social Shares. Sharing is an active Engagement, while a Like/Dislike is passive, and does not involve anything else than viewers simply clicking. Shares will grow the reach of your videos to other circles that would otherwise not be reached, and this means that the person finds your content interesting enough to endorse you and share with their friends. Likewise, Comments also hold a particular interest since the viewer takes time to write something – even though, indeed, most YouTube comments are not a well-researched and thought out satire of your work.
Finally, the last section of this YouTube dashboard represents the Latest uploaded videos and the source of your Traffic by Views. Your most recent videos will get a clear overview and you can easily spot any insights that can easily draw your attention to your recent uploads. Also, the Traffic will provide you with a detailed outline of your most important sources and where people find out about your content. With datapine, that is possible within minutes.
By understanding your audience, you can share specific content that can match their interests, and cultural background and outperform your previous videos by leveraging gathered data. Knowing who are you reaching out to and what you expect from them is one of the most important insights that you have to consider when preparing your next content to share. Your ability to connect with the right viewers can define the optimization level of your overall marketing strategy, so you need to be prepared to know what content suits your target audience best.
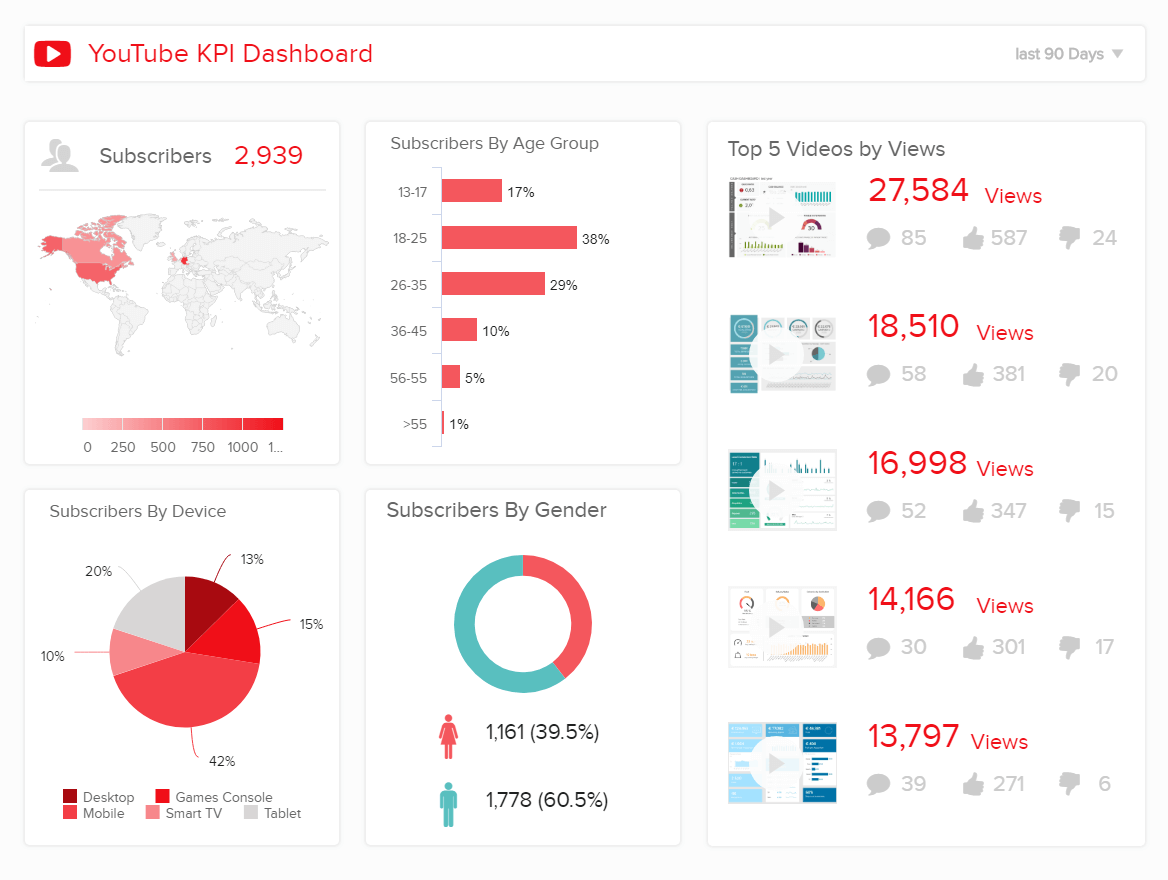
That being said, our next YouTube KPI dashboard example expounds on the source of your Subscribers in terms of geography, demographics and Top videos. Knowing who follows you and where they are from will help you understand them better: you have a cultural and linguistic comprehension, on top of time-zones mostly represented in your audience. If you are a European YouTuber with many South-American viewers, you might want to adapt your publishing schedule so that it matches their time online, and don’t post in the middle of the night. The Device metric will help you understand how to adjust your production process so that you can concentrate on viewers from devices where you get the most traffic from.
The central part of this dashboard will show you the Age group and Gender. Think about those metrics before you post your next video since it will tell you about the style, jargon and overall design you might want to implement to target the main part of your audience. Teenagers have different interests than Millennials, as Seniors will have different points of view of how a good video should be made to increase your other metrics, for example, Retention rate (you might want to check other dashboards for more details). Therefore, when you see how many Views you have generated, Likes, or Comments, by simply adjusting to the needs and requirements of your audience, you can easily spot what works and what not. That way your content can perform better and your YouTube strategy will stay on its track.
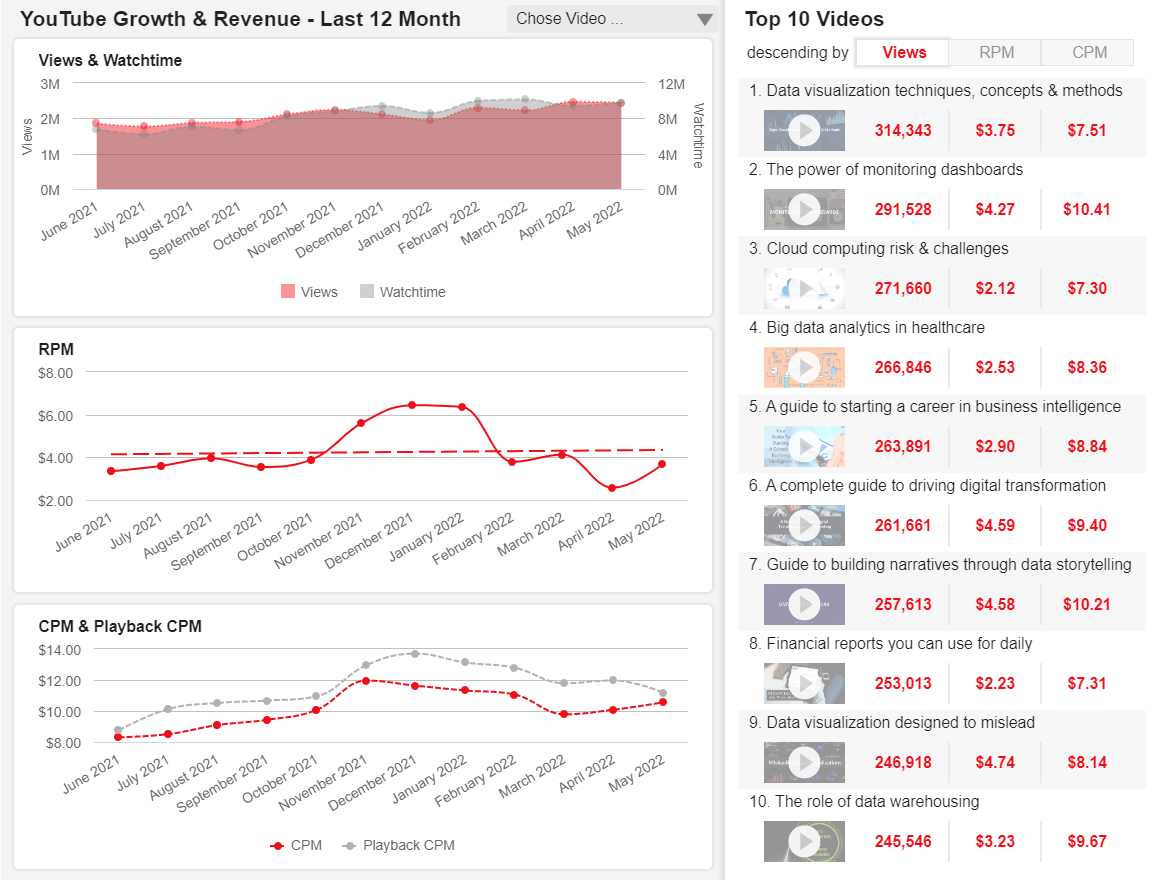
Our final YouTube Dashboard template has a long-term focus and it is aimed at professional Youtubers that monetize their content. With metrics related to growth and revenue, channel owners can identify which content their viewers enjoy the most as well as its monetary value. The general view of the dashboard provides insights for the entire channel; however, you can filter it for a specific video to dig deeper into each indicator. Below, we will discuss the sections of this dashboard more in detail, we recommend you to open the full-screen version to see the complete scope.
Starting at the top, we have straightforward KPIs regarding the development of the channel. On one hand, the views and watch time are important indicators of the quality of your content. You can analyze the aggregated data for all videos or also look into individual ones to understand which type of content works best for your subscribers. Along that same line, the gained and lost follower chart is another way to understand how your content is perceived. If you notice a pick in new followers after publishing a new video, then you are on the right path.
The Revenue Per Mille (RPM) is a financial metric that monitors the money you earned per 1.000 views after subtracting YouTube’s revenue share. It reports revenue coming from various sources including YouTube premium, Channel Memberships, Super Chat, and Super Stickers. The RPM is directly connected to the CPM, which tracks how much advertisers paid for 1000 ad impressions before subtracting YouTube’s share. Another difference between the two is, that the CPM considers views coming only from monetized videos, while the RPM includes views from all videos, therefore it will always be lower than the CPM.
To understand your CPM properly, you should also observe your Playback CPM. CPM tracks individual ad impressions, while Playback CPM tracks all views with ads. Since a video can have more than one ad, the Playback CPM is usually higher than the actual CPM. Due to the high advertising activity during Christmas, both RPM and CPM are higher in December, as can be seen in the dashboard.
The template also offers two charts relating to comments. Here, you can quickly understand the share of negative vs positive ones and extract conclusions about the sentiment of your subscribers. Paired with this, you see an overview of the top positive and negative comments which is valuable information to have. Looking into negative feedback can let you understand what can be improved to keep satisfaction levels high. Lastly, the dashboard offers the possibility to see the development of all these metrics together by specific videos. This way, you can see the share each of your videos brings to them and extract useful conclusions.
Throughout this list of professional dashboard examples, we have shown you video and viewers metrics that you should keep in mind when creating, optimizing and analyzing your YouTube content. In a market that is getting more crowded and profitable by the day, you can no longer afford to shoot in the dark when it comes to making strategic decisions. If you want to tackle deeper into your video strategy and skyrocket your performance, datapine can help you get the most out of your YouTube channel, with a 14-day trial – completely free!
Setup only takes one minute. No credit card required!