Take Advantage Of Operational Metrics & KPI Examples – A Comprehensive Guide
Table of Contents
1) Metrics Definition & Importance
3) Strategic & Operations KPIs Difference
4) Top Operations KPI Examples
Using data in today’s businesses is crucial to evaluate success and gather insights needed for a sustainable company. Identifying what is working and what is not is one of the invaluable management practices that can decrease costs, determine the progress a business is making, and compare it to organizational goals. By establishing clear operational metrics and evaluating performance, companies have the advantage of using what is crucial to stay competitive in the market, and that’s data.
We have written about management reporting methods that can be utilized in the modern practice of creating powerful analyses, bringing complex data into simple visuals, and employing them to make actionable decisions. Now we will focus on operational efficiency KPIs that can ultimately bring indispensable value out of the overall business development by concentrating on the most important business question: what can I do to perform even better?
But let’s start with the basics of business operations and provide foundations for analyzing your own KPIs while focusing on industry and department-specific examples that a business can use for its own development. We will discuss marketing, retail, human resources, sales, logistics, IT project management, and customer service examples that can grow operational efficiency and decrease costs. But first, let's begin with a general understanding of key metrics and their usage in business.
What Are Metrics And Why Are They Important?
Business metrics are used to evaluate performance, compare results, and monitor relevant insights to improve business outcomes. They are commonly used by operations managers, strategic leaders, financial professionals, or analysts to tackle insights and improve performance. Essentially, they can learn from historical data and adjust for present and future operational and strategic actions.
To understand what a metric is, it's important to remember that they come in many varieties, depending on the industry or function where they are needed. In other words, by analyzing KPI examples for a specific industry or function, a business can reduce the number of hours needed to evaluate the overall performance. Another important thing to consider is which one business should implement to gain sustainable success and maintain its competitiveness in the market.
In practice, that means that executives will focus on strategic progress and longer periods of analysis while operational efficiency metrics and KPIs focus on shorter periods.
A metric is important for multiple reasons; it helps professionals and leaders to optimize online analysis, monitor closely day-to-day business management, and see where the team stands in terms of reaching and exceeding business goals:
- They reveal the true state of your progress: As we mentioned, performance is one of the pillars of succeeding in our cutthroat business environment, and you need to identify what works and what doesn't. By setting operational performance measures, you will know what is happening at every stage of your business.
- They help in making the right decision: To ensure positive business results, data-enabled decisions are critical. What are key metrics in this case enabling - is an environment that focuses on making the right decision at the right moment since they will present the data and help you derive insights.
- They help you monitor your financial health: To safeguard the financial progress of your company, monitoring financial indicators is essential. Every business needs to focus on finances, and by doing so, you will have the opportunity to keep your cash flow steady and sustainable.
- They keep your operations on schedule: While some metrics examples focus on strategic initiatives, as we mentioned, they will also help you in measuring day-to-day or weekly activities, which, in turn, will help you in keeping your operations on schedule and optimize them to improve results. Operations KPIs are the backbone of any successful business, and you need to focus on them to ensure sustainable business development.
We have expounded on the meaning of metrics, but what are operational metrics specifically? Let's examine this last notion in more detail through the operational metrics definition, examples, and key takeaways.
What Are Operational KPIs?
An operational KPI is a performance indicator that shows the progress and development of a business’s day-to-day operations. They are used to track organizational strategies and processes to improve efficiency and understand and reflect on the outcomes to boost growth.
For example, retail KPIs that fall under operational, such as the order status, which we will cover in more detail later in the article, are critical to monitor daily since you will have deeper insights into a real-time update on the different status of your order - is it shipped, canceled, received or still in the packaging process. Depending on the industry and function, you will want to monitor the right KPI at the right moment.
Try our professional reporting software for 14 days, completely free!
What Is The Difference Between Strategic & Operational Metrics?
Performance tracking using metrics and KPIs is a complex process that can confuse organizations. Before diving into our list of 32 powerful operational KPIs examples, let’s see the scope of these indicators in a business context. We will do this by illustrating the difference between strategic and operational performance measures.
To do so, it is also important to understand how metrics and KPIs differ from each other. To put it simply, KPIs track more long-term company goals while metrics monitor the progress of different measures implemented to achieve those goals. This leads us to the main difference between strategic and operational processes.
On one hand, strategic indicators track core company goals that are usually long-term, such as increasing revenue by a certain percentage in a defined period. On the other hand, operations indicators measure the progress of different activities that work towards that strategic goal. For example, lead conversion ratio, net profit margin, or lead to opportunity ratio, just to name a few.
It is fundamental that strategies and operations metrics are directly connected in order to achieve a successful analysis process. This is because tracking KPIs at different levels allow you to spot improvement opportunities and ensure goals are being met easily. For instance, if your strategic goal is to improve customer satisfaction and you are not reaching the expected goal, you can drill down into smaller operational metrics and understand which area is lacking and affecting the general strategy.
That said, let’s dive into the examples to keep putting all of this into perspective.
Top Operational Metrics Examples For Different Departments & Industries
While there are a number of operational indicators to choose from, a company needs to be careful which one will be of utmost importance and value. That being said, we will discuss operational metrics examples that can be used in business processes and outline the most prominent ones while using business analytics tools as our invaluable assistance.
1. Marketing: CPC (Cost-per-Click)
Establishing specific operational efficiency metrics and tracking their efficiency creates invaluable results for any marketing campaign. Let's see this through an example.

The CPC (cost-per-click) overview of campaigns is an operational metric that expounds on the standard pricing model in online advertising. While comparing different campaigns in the CPC section of the overall strategy, you can easily spot which one had the lowest price and tackle deeper into the details. While this marketing KPI is priceless regarding advertising, it should be viewed in relation to other important operational indicators. Below in the article, you can find a holistic overview of different kinds of KPIs that are used in standard marketing practice.
2. Marketing: CPA (Cost-per-Acquisition)
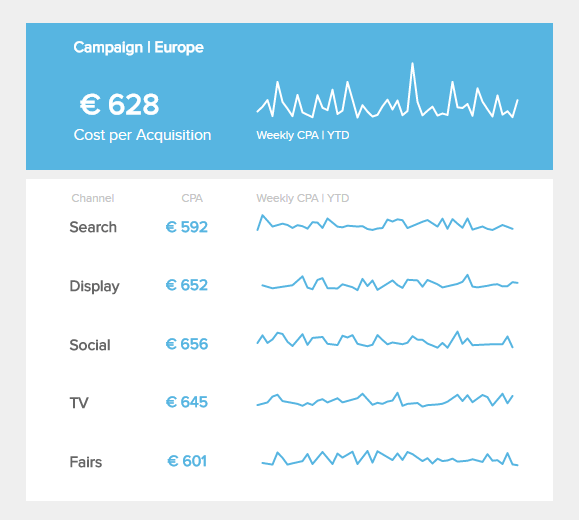
Another example we could analyze is the CPA (cost-per-acquisition) in correlation with the specific marketing channel, as presented in the visual above. The CPA metric is even more performance-based since it's concentrated on the price of acquiring a customer, not clicks made to a website. Using these indicators to reflect on the outcomes of a campaign and establish future processes can be of invaluable significance.
3. Marketing: Goal Conversion Rate
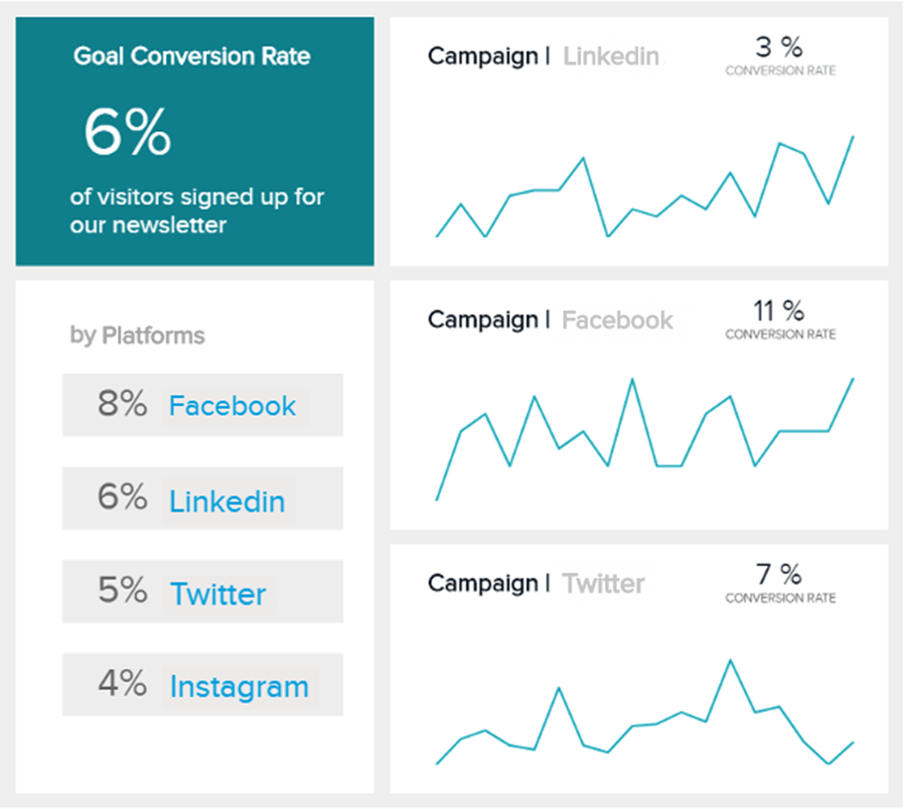
Conversions refer to the desired actions your customers take on a specific channel. For example, if your goal is to increase email newsletter signups, a successful signup counts as a conversion. Your website is filled with different conversion opportunities: lead collections, downloads, sales, and signups, to name a few.
To start using conversion rate as an indicator of success, begin by defining your goals. Based on what you want to achieve, you can start tracking the conversion rate of each channel and each type of activity. You can compare this metric to others, like bounce rate, read time, or session duration, to figure out what’s working and what can be improved.
4. Human Resources: Absenteeism Rate
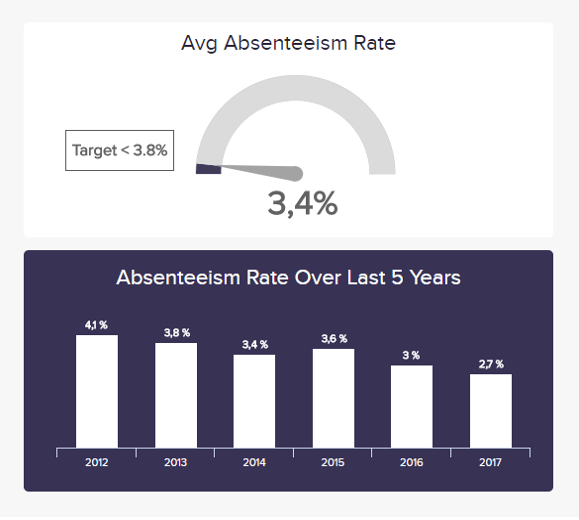
Another example comes from the HR industry and considers the engagement of the employees. This is an extremely important HR KPI since it concentrates on the main workforce actions needed to establish a successful HR strategy - the number of employees calling sick, missing work, or skipping can tell the organization what kind of impact it will have in the long run.
This is one of the KPIs for operations that can directly affect the general well-being of your company, and it makes sense to compare it with historical data to evaluate whether the absenteeism rate is specific for one department or the company as a whole. That way, you will be able to incorporate measures and improve the overall situation.
5. Human Resources: Overtime Hours
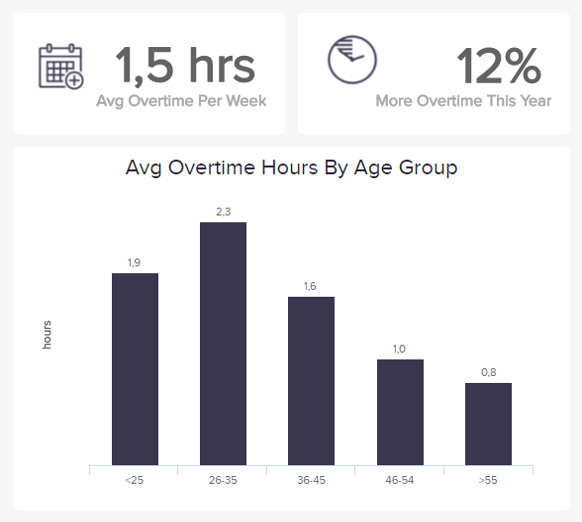
The workload of employees is a KPI for operational excellence that can impact the absenteeism rate if the workforce is understaffed and deals with higher amounts of pressure. This indicator should be monitored in detail since it can be interpreted differently according to the context (for example, is the economic growth or high volume of orders causing overtime hours, or something completely different?).
This is one of the metric examples that can also help in recruitment processes since you will know what kind of atmosphere is present in the company and use this as an argument for hiring negotiations with potential candidates. If you want to tackle deeper HR topics, you can read our comprehensive guide on recruitment metrics.
6. Human Resources: Employee Turnover Rate
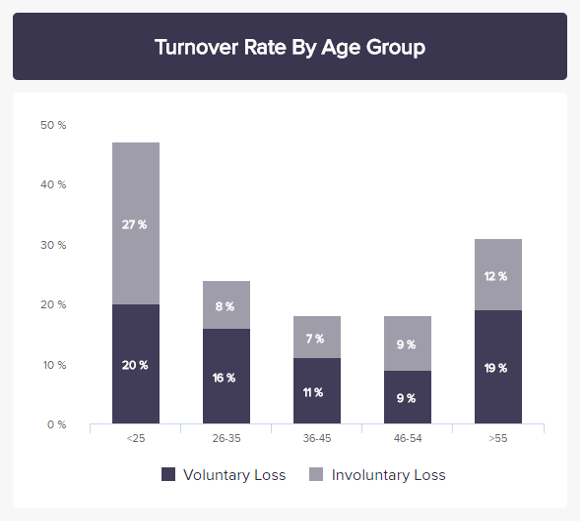
Turnover isn’t necessarily a bad thing; ideally, people who are not a good fit for your company will leave naturally. That said, the rate at which employees leave can be a testament to how people-friendly your company is. The turnover rate measures how many of your workers leave (regardless of reason). A high turnover rate indicates there’s some work to do in retaining employees and can help you predict future talent needs.
7. Retail: Order Status
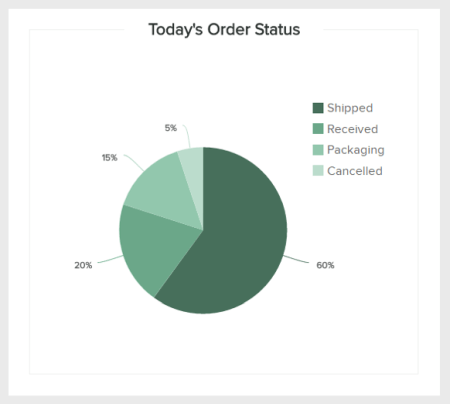
In retail, every order counts, and that's why it's important to track during shorter periods the status of your orders, whether it's shipped, received, in the packaging process, or canceled. This kind of ad hoc analysis will tell you whether you risk customer complaints if they never received their package or if you need to push up your supply chain game. In case of slow processing, you will immediately know which part of your chain needs further adjustments and whether you need to expand your business if you don't have the operational means to follow the high amounts of orders. This is one of the operating metrics critical for ensuring your customers are satisfied, but it also gives you an idea of whether your business is growing and if you need further assistance. Remember that in case of growing orders, you should be able to see revenue growth as well and then connect these operations KPIs with strategic ones.
8. Retail: Sales by Region

One of the operations metrics essential to establishing great sales processes, the total sales by region, will help you determine which locations have the best performance. This is one of the operational excellence metrics that should be followed both on an operational and strategic level since it's important to know whether your sales activities bring results or if you need additional adjustments. But let's focus on operations.
If you track this operation KPI in shorter periods, such as daily or weekly, you will have an idea of how your specific campaigns are doing and whether they continue bringing positive results. Moreover, your sales managers will have better chances to optimize their future targeting and deliver better results. Speaking in more detail, you will have the possibility to evaluate which locations perform the best, where your products are considered most valuable, and compare between locations to understand what works and what doesn't. For example, if you see a certain spike on Fridays across different states, you can investigate further and see if you can implement the same strategies in other locations as well. Keep in mind the differences and particularities of each location.
9. Retail: Sell-Through Rate
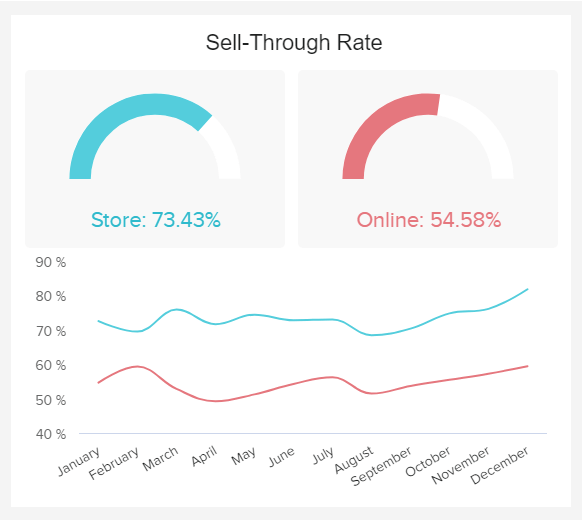
The sell-through rate indicates how quickly you’re selling through inventory within a specific time period. This metric compares the amount of inventory sold with the amount of inventory received and can be useful in maintaining ideal stock levels to avoid sellouts or spoilage.
Many companies calculate the sell-through rate on a monthly basis, but you can adjust this metric to suit your needs. The goal is to minimize the amount of inventory sitting stagnant in your warehouse, as any inventory on your shelves costs you money in terms of space and lack of sales.
10. Sales: Lead-to-Opportunity Ratio
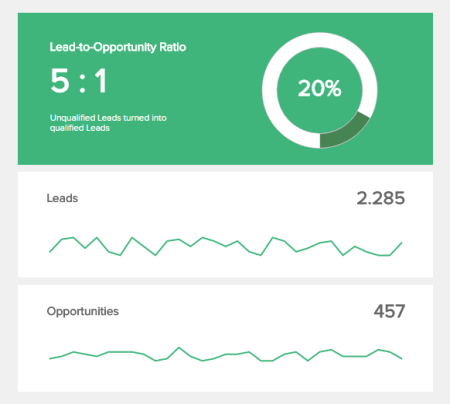
In this sales example above, the lead-to-opportunity ratio provides insights into the number of leads a sales professional or manager needs to stay on target with revenue goals. Since this is the first part of the sales funnel, you can easily spot which leads have turned into qualified ones and easily calculate the ratio. It would make sense to dig deeper into the exact source of qualified leads so that you can guide the marketing and sales team even better. To fully understand operational performance indicators in sales processes, you can take a look at our comprehensive article on sales graphs and charts.
11. Sales: Lead Conversion Ratio
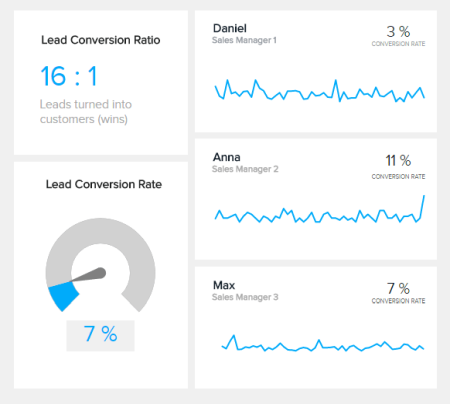
One of the most important sales KPIs is the lead conversion ratio - it defines the number of interested people that turned into actual paying customers - a magic sales number indeed. After finding your baseline, you will understand how many leads you need to obtain for a healthy sales pipeline. If the conversion rate is low, you can be sure that the pipeline and your target metric need additional adjusting.
12. Sales: Sales Opportunity Score
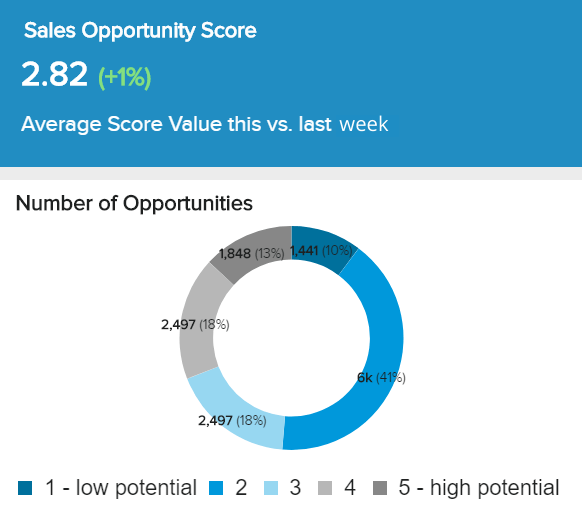
Opportunities that land in front of a salesperson need to be qualified in order to move forward. Once they pass this test, there are still some leads who are “better” than others in terms of readiness to buy. One way to tell the difference is to check their Sales Opportunity Score, which indicates how likely a person is to say yes quickly.
This metric is based on a scale of 1 to 5, where 5 indicates the highest level of interest and readiness to buy. Salespeople can prioritize their higher-scoring leads before they have time to cool, leading to more closed deals and greater revenue. Put this metric together in a sales dashboard and get a complete view of your sales cycle.
13. Logistics: Delivery Time
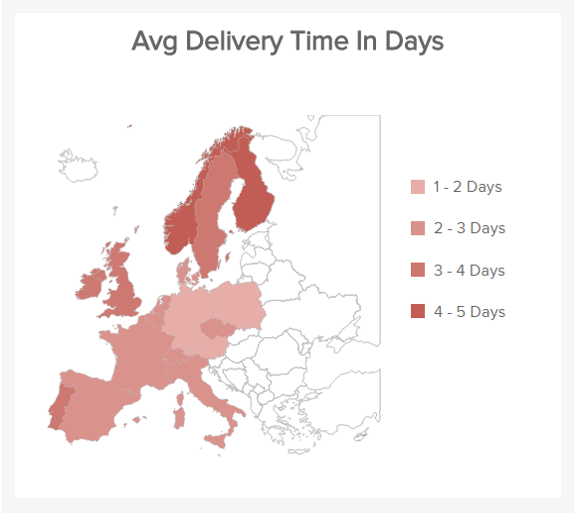
A standard logistics KPI, delivery time, measures the days between an order being placed to be shipped and when it is delivered to the customer or the post office. The average amount will then show you where you need to decrease these values and provide a base for specifying the exact day your customers can expect their package. This is an important indicator that you can incorporate into your logistics operations to ensure the best possible results for your company and establish a lucrative rapport with your customers.
14. Logistics: Transportation Costs
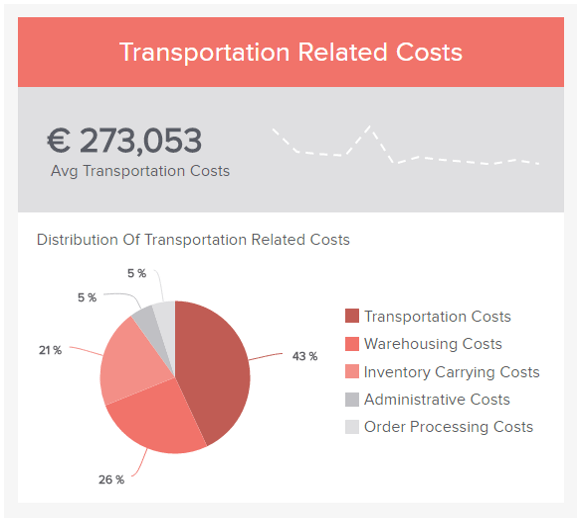
All the costs related to the transportation process can be seen in the example above: order processing, administrative costs, inventory carrying, warehousing, and, finally, the actual transportation costs. This will determine the average numbers and the distribution expressed in percentage, a critical component of successful logistics analytics process optimization. The final goal is to decrease costs while maintaining a high-quality delivery process. Operational excellence KPIs for logistics will help you determine the health of your supply chain, transportation, and warehouse performance.
Try our professional reporting software for 14 days, completely free!
15. Logistics: Picking Accuracy
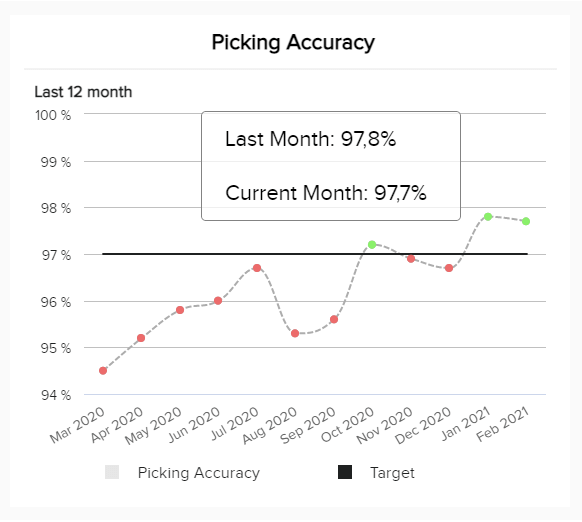
Our next example aims to monitor the percentage of orders picked without errors from your total number of orders. It is calculated with this simple formula: (Total orders – Returns due wrong item) / (Total orders). This is an important metric to track since a low picking accuracy means your customers will receive the wrong item and be unsatisfied with the service offered by your company. For this reason, you should always have in place picking strategies that will also save costs in relocating wrong shipped items.
16. Logistics: Pick & Pack Cycle Time
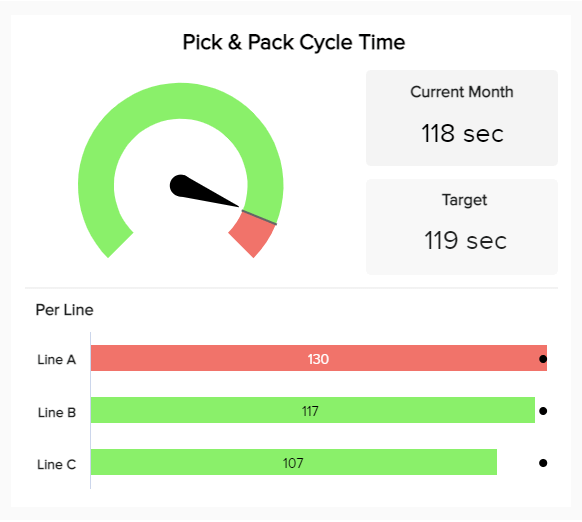
Our next operational KPI template is the pick & pack cycle time. This logistics metric monitors the seconds it takes an employee to pick and pack an order, from the moment an item is picked from the shelf to when it's packed and ready to be shipped. In the example above, we see that the cycle length is tracked in three different lines of work based on a target of last month’s results. Tracking each line of work separately enables you to implement different picking and packing strategies on each line and test which one is the most time-efficient.
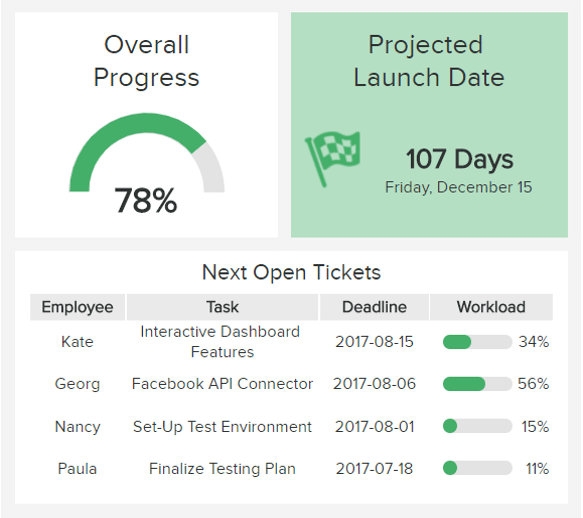
17. IT: Total Tickets vs Open Tickets
The overall progress of the project is one of the top IT KPIs to measure. When visualizing the overall progress in the correlation of the launch date, the management can easily spot if there are issues across the system. That's why it is also important to monitor the workload of staff and their deadlines, as displayed in one of our examples above. Measuring the open tickets vs. completed ones can set benchmarks for project management and assist in the optimization of the overall ticketing system.
18. IT: Average Handle Time
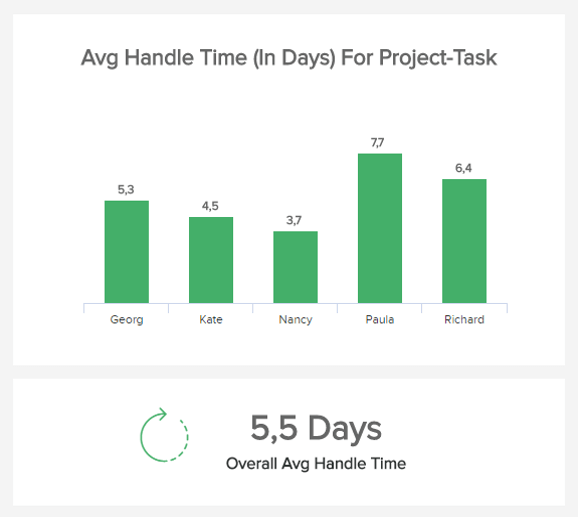
Another example from the IT project management function is the average handle time of tasks. It helps in the process of monitoring planned projects, tasks, and/or Sprints. By evaluating each member of the team, alongside the overall average handle time of tasks, you can easily spot if any deficiency is occurring in the system and, therefore, adjust accordingly. This is one of the indicators that are critical for project managers as well as the whole team since you will have details about how well people assigned to the project handle their workload.
19. IT: Server Downtime
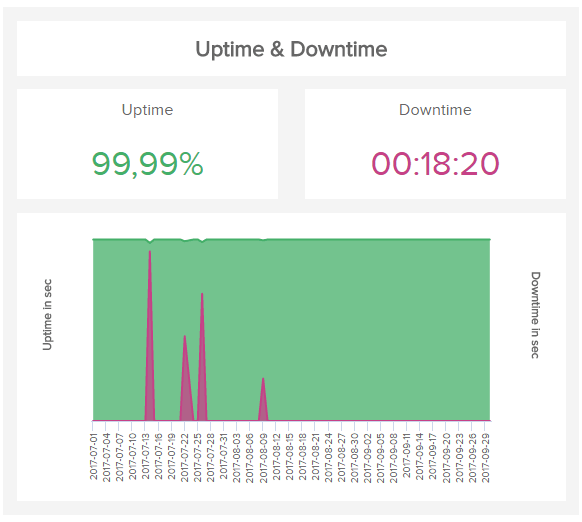
Server downtime can happen for a myriad of reasons (planned maintenance, updates, or reboots, for example). But for every second it’s down, businesses risk losing sales, customers, productivity, and profitability.
Tracking server downtime as a KPI is a great way to understand how often your server is down and why so you can mitigate negative impacts. Measuring this KPI often gives you greater visibility into how your server downtime affects other areas of your business and may identify problems and their root causes.
20. Manufacturing: Production Volume
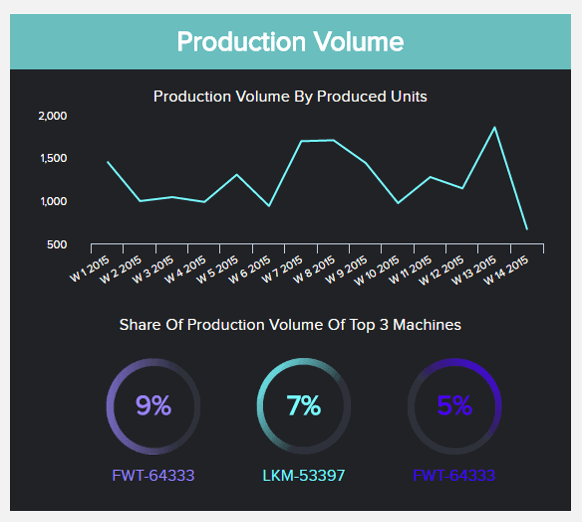
The first manufacturing KPI example for operational metrics is the production volume. This metric gives you an overview of what your factories are able to produce in one month, semester, or year, depending on the data you need to visualize. By tracking this operational KPI, you can understand if a machine is underperforming and slowing your production processes or identify which machines are performing in the most efficient way and plan your production strategies accordingly. A good benchmark for your production volume should satisfy demand but don't leave a lot of inventory in stock.
21. Manufacturing: Production Downtime
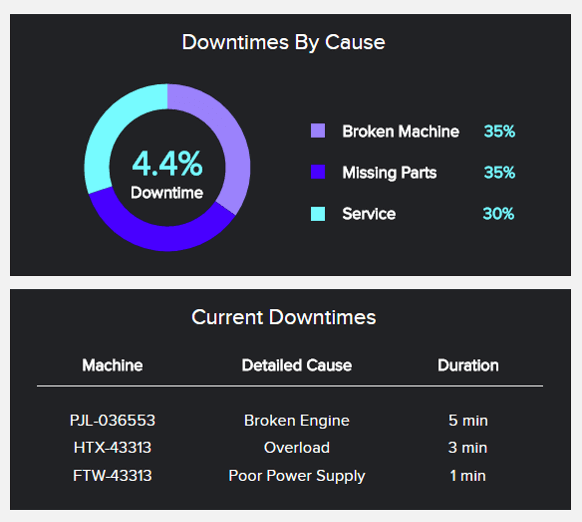
Next, we have the production downtime. This is one of the most relevant operational metrics templates to track in the manufacturing industry, as production downtime means your business is making less money. To keep your downtimes as low as possible, you need to constantly monitor the performance of your machines and find any inefficiencies before they become bigger problems. Your production downtimes can also be scheduled in order to prevent any surprises that affect the overall production process.
22. Manufacturing: Throughput
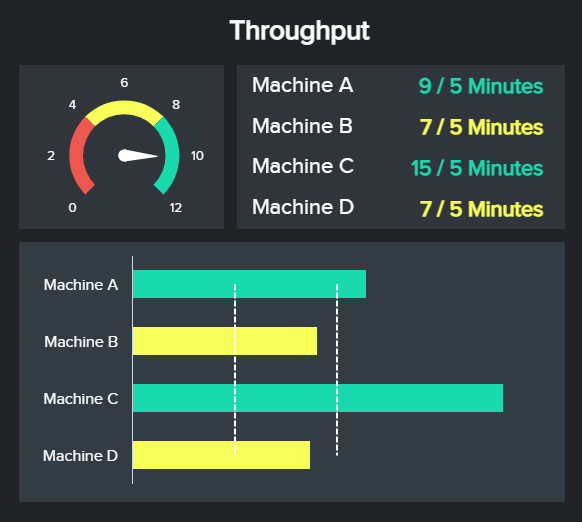
Manufacturing companies rely on their machines to produce a certain volume of goods within a given time. Measuring throughput ensures your machines meet that challenge so you can deliver on your promises to your customers.
This metric should be monitored in real-time to ensure deadlines are being met. Even missing a few counts per cycle or per hour could significantly throw off production schedules at the end of the day.
23. Manufacturing: First Pass Yield (FPY)
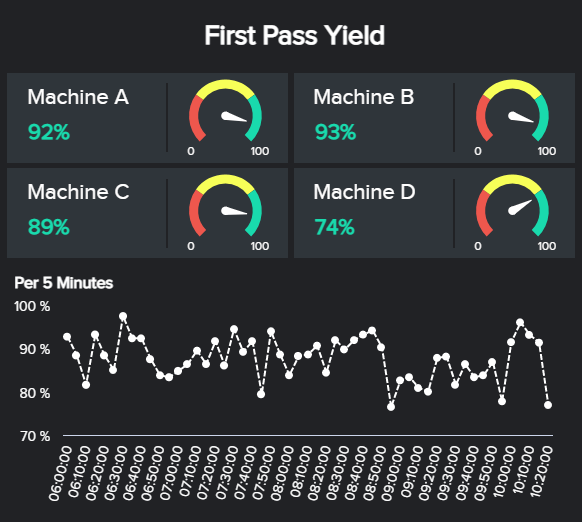
Also called the throughput yield, first pass yield refers to the quality and development of your manufacturing processes. It divides the number of perfect units (ones that are not defective or require no reworks) by the total number of units passing through the same process within a specific time period. The higher the FYP, the more reliable and efficient your production processes are assumed to be.
24. Finance: Accounts Receivable Turnover
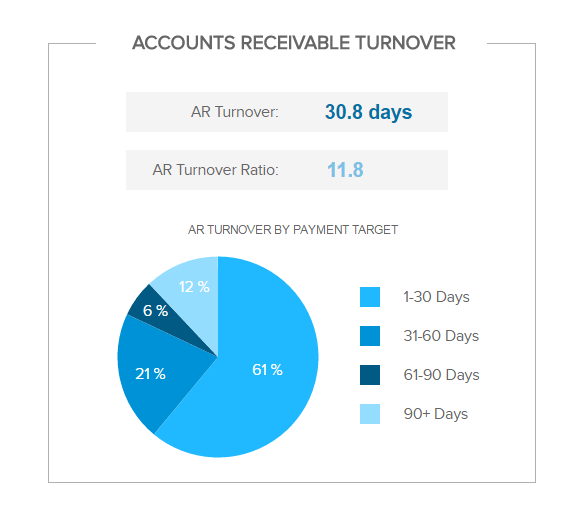
Moving on with a financial analytics example, the accounts receivable turnover is a KPI often used by financial and operations managers to understand how quickly the company is at collecting its receivables. Essentially, this indicator measures how efficiently a company manages the credit they extend to its customers and how much it takes for it to be collected or paid. The faster your business can turn its credit into cash, the higher your liquidity. Therefore, it is important to keep this ratio as high as possible. A low accounts receivable turnover ratio means something in the company’s credit policies is not working properly and needs to be optimized.
25. Finance: Current Ratio
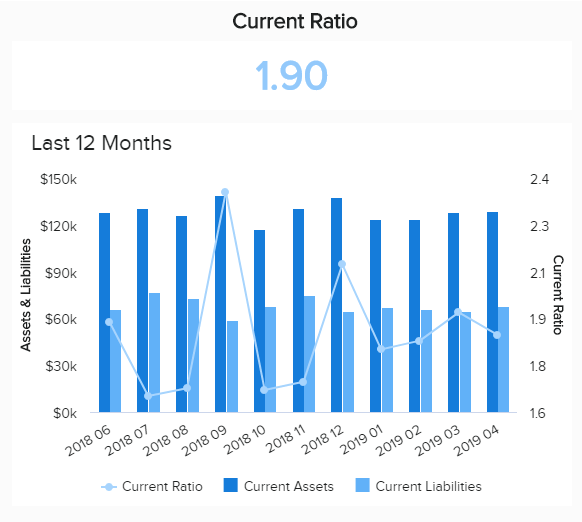
The current ratio is another financial operations KPI that focuses on liquidity. It measures an organization’s ability to pay its obligations in a short-term period, typically within 12 months. And it gives investors a bigger picture of the business's financial health by telling them how capable the company is at maximizing its current assets to pay its debts. Unlike other liquidity ratios, the current ratio includes all current assets and liabilities in its calculation. Ideally, you should keep your current ratio higher than 1, as a lower number means you might be unable to pay your debts when they come.
26. Finance: Operating Profit Margin
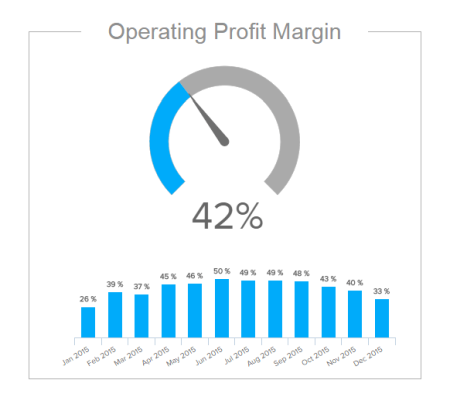
The “earnings before interest and tax” (EBIT) is one of the most important financial KPIs from an operational level. It shows the percentage of total revenue earned, which is your operating profit margin. It does not take into account any revenue made from investments or tax assistance. To find the operating profit margin, divide your operating profit by your total sales revenue. This represents the portion of your revenue that is left over after operating expenses.
27. Healthcare: Patient Wait Time

The patient wait time is one of the most straightforward healthcare KPIs that tells a lot about the operational efficiency of a hospital or care facility. As its name suggests, it tracks the average time that patients need to wait from the moment they register to when they actually see a doctor or get treatment. This metric is highly linked to patient satisfaction. Therefore, it is important to measure it for the different hospital divisions. For instance, a high ER waiting time can mean that there is understaffing. To solve this problem, you can identify rush hours and plan staffing schedules accordingly.
28. Healthcare: Hospital Readmission Rates
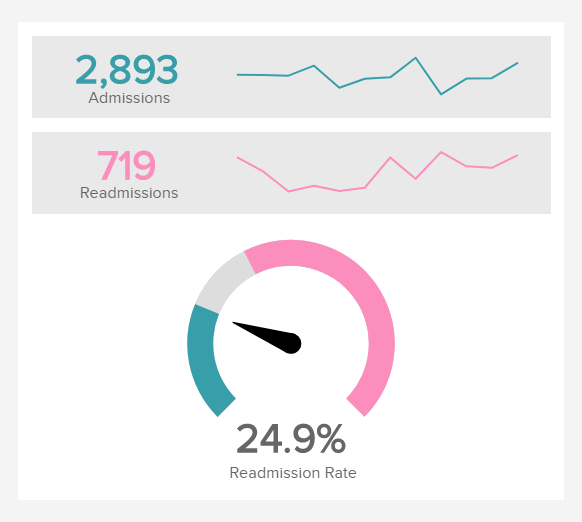
Moving on with the types of operational metrics from the healthcare industry, we have the hospital readmission rate. It provides insights regarding the number of patients that return to the hospital after being released in a short period. It is a fundamental indicator as it measures the ability of a healthcare facility to offer quality care to its patients. Naturally, you want to keep this ratio as low as possible. A high readmission rate can shine a light on many other problems, such as a lack of staff or appropriate material or overloaded staff neglecting details. By optimizing your readmission rates, you will not only ensure you are providing the best care to patients but also avoid extra expenses on unnecessary readmissions.
29. Healthcare: Bed Occupancy Rate
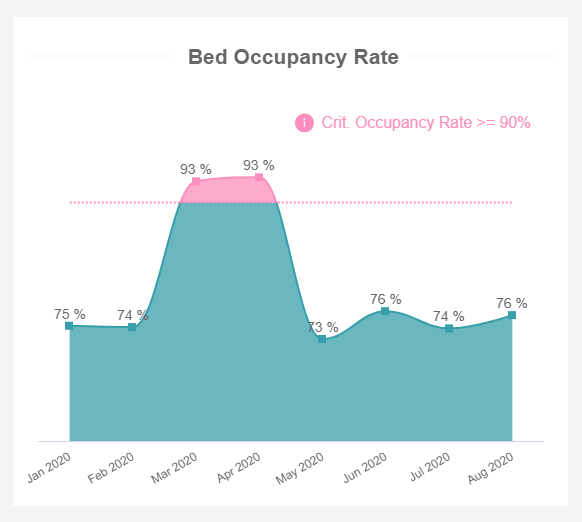
Bed occupancy rate became a key factor during the Covid pandemic, but it’s also a good metric for any healthcare facility to see at a glance. This metric shows how many beds were occupied during a specific time period. The higher the bed occupancy rate, the more patients a facility serves and the more resources it will require to provide adequate care. This metric is useful in employee scheduling and resource planning during healthcare analytics.
30. Customer Service: First Call Resolution
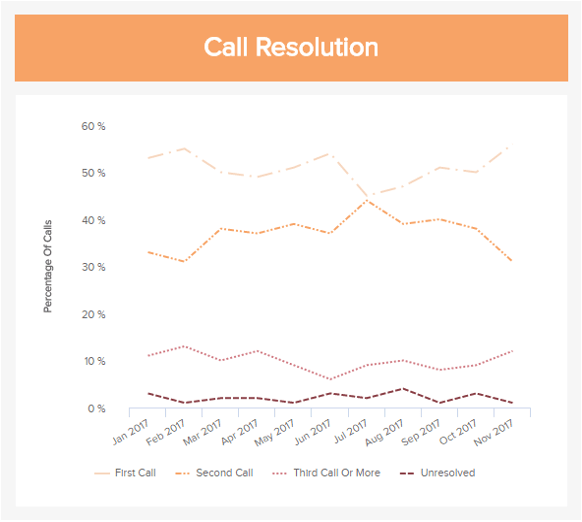
Another important area to track when it comes to operational KPIs and performance management is customer service. And to put this into perspective, we selected the first call resolution metric as an example. This indicator tracks the percentage of support calls that are solved within the first call. Nobody wants to call several times to solve one single issue; therefore, it is a fundamental KPI to track not only customer satisfaction but also team progress. In the example, we can see that there is a high percentage of second-call resolutions. A way to optimize this is to offer support agents with training instances to tackle the most common issues quickly and efficiently.
31. Customer Service: Average Response Time
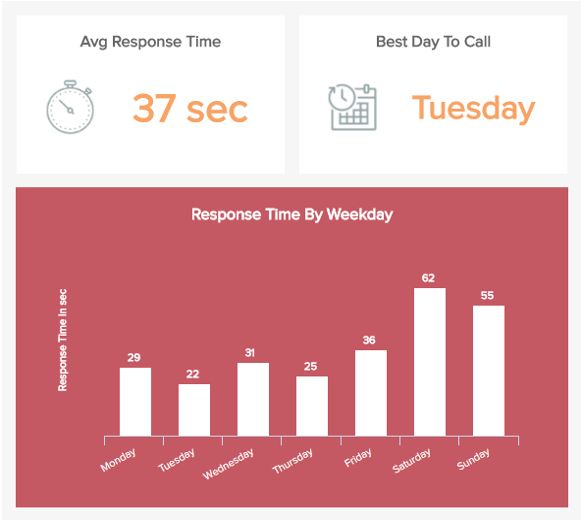
Following in the same line as our previous example, the average response time is one of the customer service KPIs that monitors the time between the moment a customer calls with an issue and the time an agent responds to it. It is an important indicator to track as it significantly affects customer satisfaction levels. A short response time means you respect your customer's time and want to provide them with the best support possible. To keep your response times as low as possible, make sure you analyze the times when customers are calling the most and prepare your stuffing schedule to cover the demand.
32. Customer Service: Total & Solved Issues By Channel
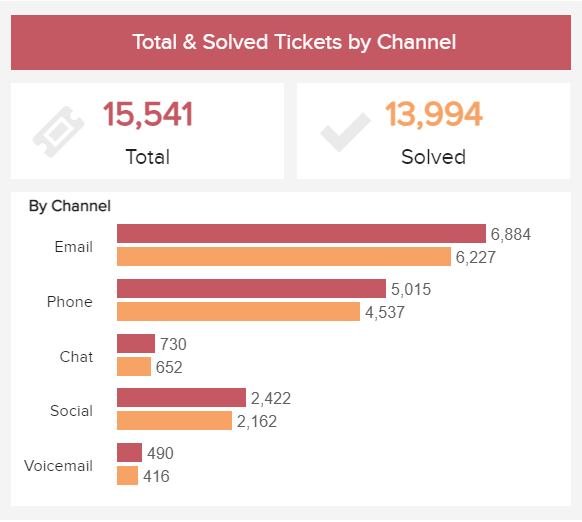
Having lingering tickets isn’t good for business; this means customer issues have been forgotten or otherwise unresolved. Seeing total and resolved issues alongside each other can give you a better idea of which channels are the most effective in helping customers, what channels customers prefer, and how quickly your team responds to issues. A significant difference between total and solved issues could indicate more resources are needed to address customer needs.
Try our professional reporting software for 14 days, completely free!
Interconnected Operational Metrics And KPIs
After we have provided specific KPIs from industries and functions, we will now focus on a holistic overview and how they are interconnected into an overall operational process. Let's analyze this through examples.
Marketing: Is my budget on track?
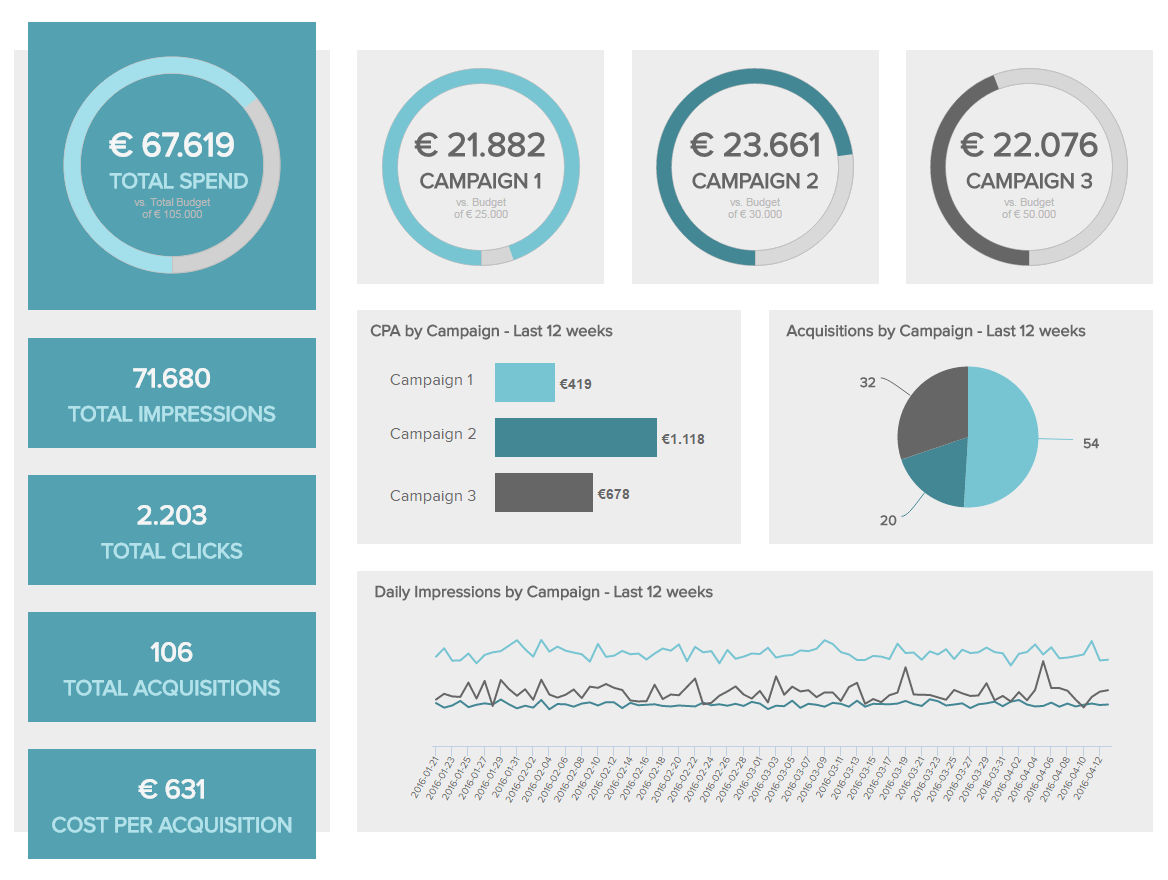
**click to enlarge**
The operational KPIs examples presented above focus on the marketing performance of specific campaigns on an operational level. The significance lies within the fact that this clear overview can assist marketing managers and professionals in developing a comprehensive data-driven marketing strategy. Changes will alert the marketing team, which can then optimize the campaign and makes sure the budget stays on track.
Human Resources: Is our productivity on track?
The second of our operational metrics examples we will focus on is employee performance, shown through an HR dashboard presented below.

**click to enlarge**
This interactive dashboard example shows relevant indicators to consider while analyzing employees’ performance and behavior. The absenteeism rate metric should be monitored since it can affect the financial state of a business (holistic view, remember?), but, most importantly, it can provide insights into the potential causes and reasons for absence. This can be used then to improve business operations and productivity and subsequently reduce costs.
Another interesting metric to take into account is the overtime hours. That way is easy to spot if employees are understaffed or lack training, which can also affect productivity. The main focus is not to put workers under pressure which can lead to demotivation. A comprehensive HR report can utilize all the effectiveness needed to develop and maintain a sustainable workforce in a company.
Retail: How is my online sales performance?
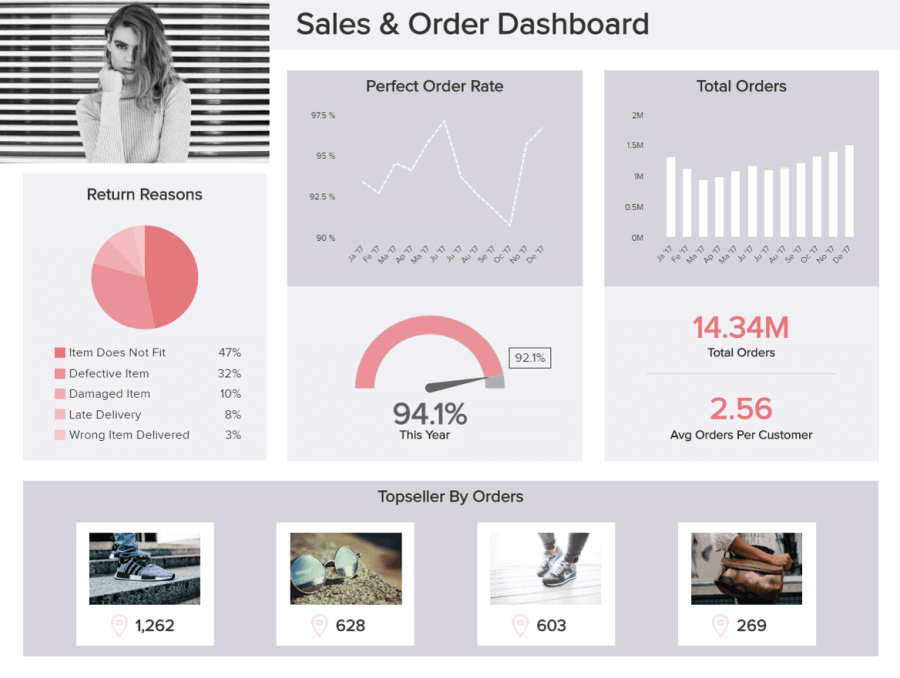
**click to enlarge**
Our next example was created with retail analytics software, focusing on online sales. Full of operational metrics, this visual tool gives you an overview of aspects such as your total orders for a year, paired with a perfect order rate so you can assess the success of your entire sales and delivery process. A lower perfect order rate means your customers face issues at some point in their ordering process, affecting your business reputation.
Paired with this, you get other retail KPIs related to returns and top-selling items. On one hand, looking deeper into the reasons for returns can help you spot any inefficiencies in your processes and tackle them to avoid unhappy customers and extra costs. And on the other hand, having a clear understanding of your top sellers can help you plan inventory according to the expected sales and plan publicity strategies to take advantage of the hottest-selling products.
Sales: What details should I keep an eye on?
One of our operational metrics examples we will focus on next is sales. When considering the sales cycle process, it is of utmost importance to compile a succinct operations monitoring process to ensure all the sales stages leading to conversions are covered.
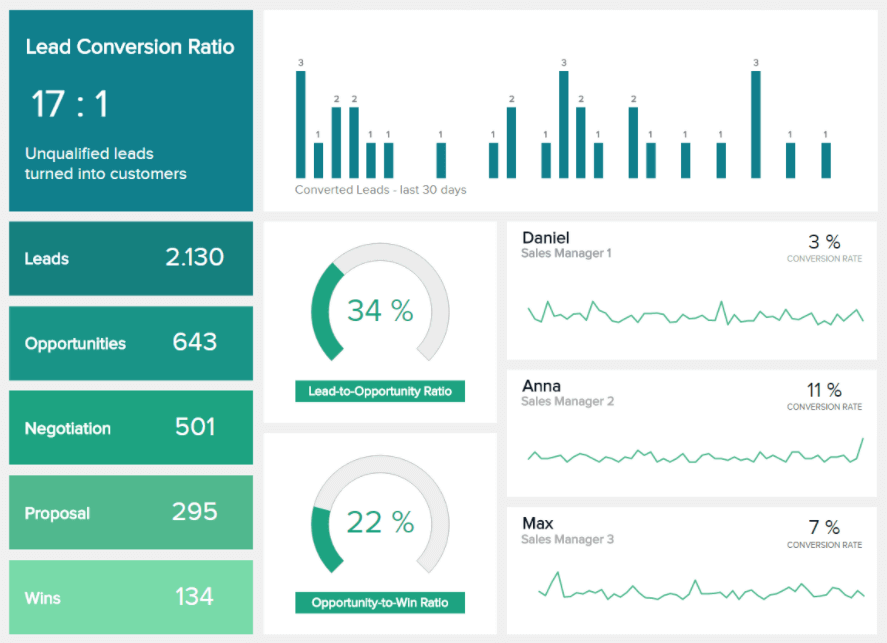
**click to enlarge**
The KPIs shown in the example above provide the operational details needed to compile a holistic overview of the sales conversion rate cycle. Leads don’t always turn into opportunities, and proposals don’t always yield wins, but the monitoring process of your indicators can easily identify if the overall performance is on track and developing as planned. The magic is in the details, and this dashboard presentation can effectively round up the data story you need.
Compiling information into a visual narrative can help organizations decipher all the raw waves of data since the human brain can process visuals 60.000 times faster than numbers, which can then enable the connection of multidimensional relationships between operational metrics, KPIs and make sense of interdepartmental and different organizational levels.
Logistics: How efficient is my transportation process?
The next example that we will discuss concentrates on the logistics level of operating transportation. Monitoring the fleet efficiency on a detailed performance level – how much is on the move and how much is in maintenance, will help you collect data needed to create a sustainable strategy or to monitor if the KPIs are on track.
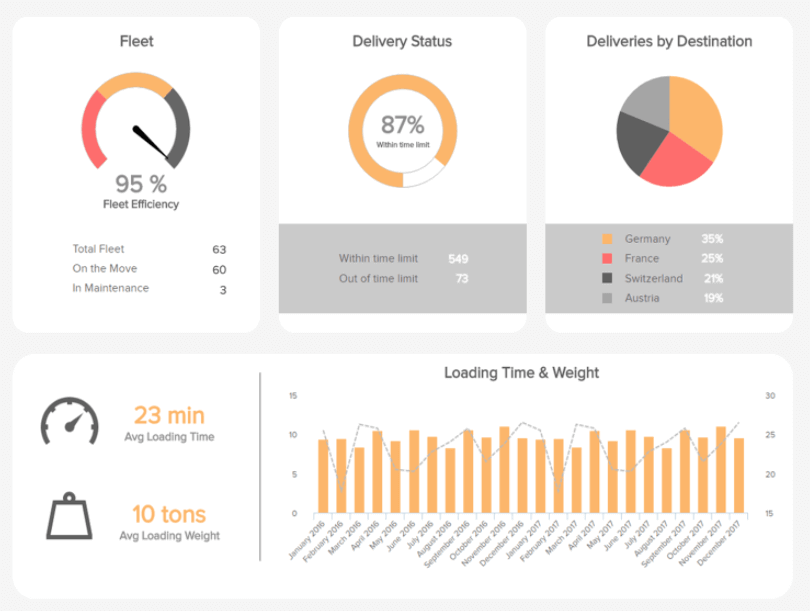
**click to enlarge**
The loading time and weight viewed over a set time frame will provide you with insights into the average amounts and controlling points of the transportation process and the efficiency you are running your operations.
IT Project Management: Is my project on target?
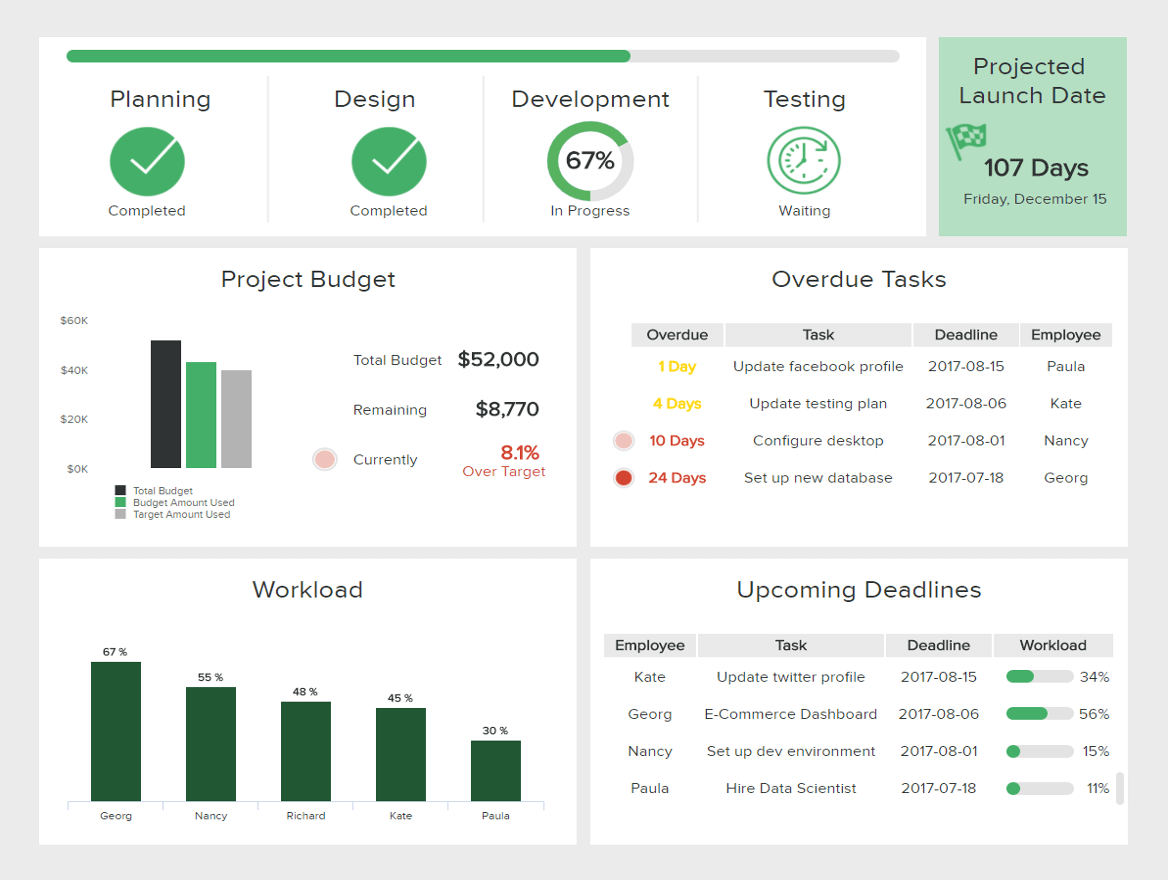
**click to enlarge**
By gaining insights into the project management of the IT performance, this IT dashboard example above provides a holistic view of the KPIs and metrics needed to obtain a sustainable level of efficiency. The overview of the project management can deliver fast and accurate knowledge to establish a smooth operational performance. Consequently, it will reduce costs since any changeability will be clearly visualized in this simple interactive dashboard.
Customer service: How is my team performing?
The team's performance in a customer service setting is critical in delivering growth for companies that want to survive in our competitive economy. The importance of understanding what are metrics in business, especially customer service, lies within the ability to react swiftly, access information immediately, and that each person has the right information at the right time. That's why a customer service dashboard is a critical tool in assessing multiple touchpoints of sales, orders, and overall operational performance metrics.
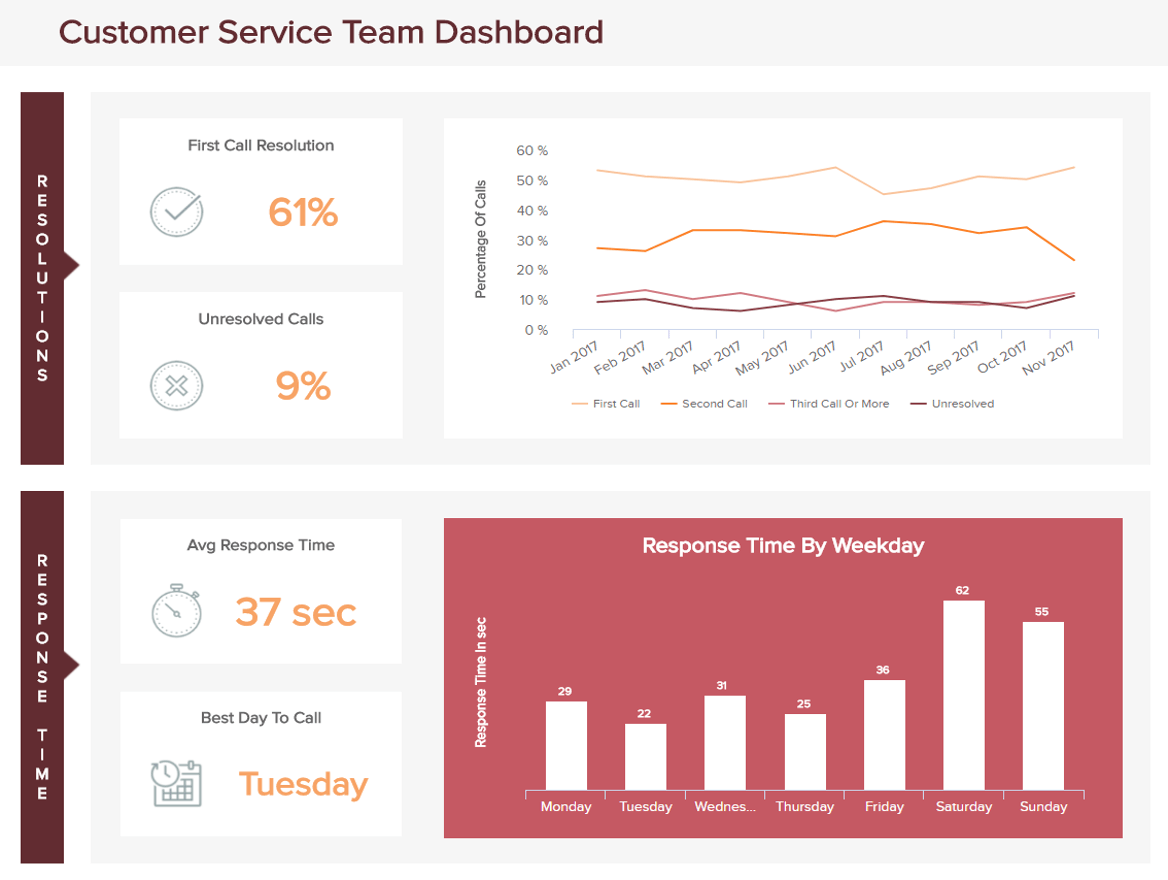
**click to enlarge**
Such business intelligence dashboards empower teams to have a clear overview of the most critical metrics for operations managers and streamline resolutions and response time. From essential metrics such as the first call resolution, unresolved calls, response time by weekday, and best day to call, operational teams have the power to monitor and optimize their processes in order to increase customer satisfaction levels.
Manufacturing: Ensure an efficient production process
In the manufacturing industry, operational efficiency is key. Getting a bigger picture of metrics such as the production volume paired with the quantity order and your machine's capabilities can help you understand how prepared you are to face your production goals and implement strategies to be as productive as possible.
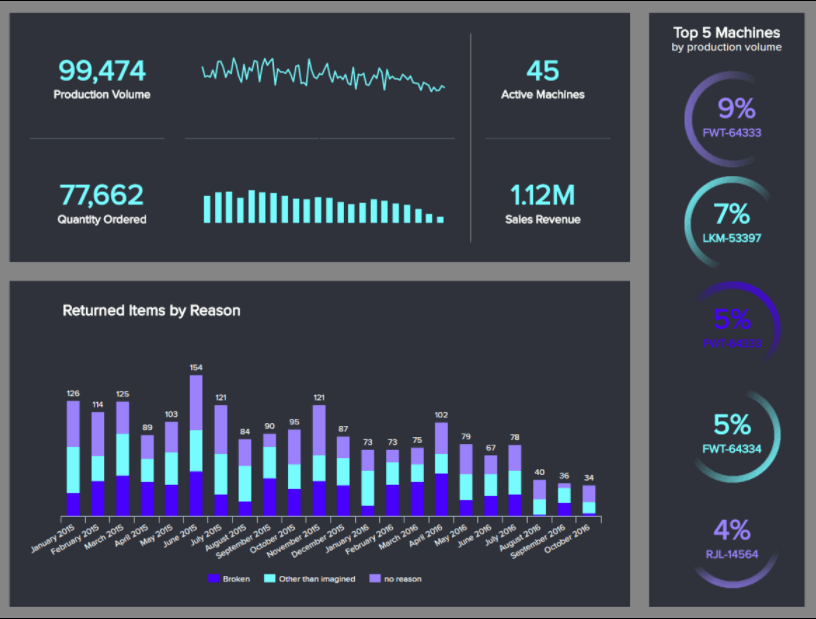
**click to enlarge**
Inefficiency is the biggest enemy of manufacturing. For this reason, monitoring these operational metrics together in a professional manufacturing dashboard can help you optimize processes, spot any hidden trends or inefficiencies and keep everyone informed about the status of production. Next to all the production metrics, this template also tracks the returned items by reason, and this will help you delve deeper into the causes and find solutions to lower the number of returns and save significant costs on dealing with damaged items.
Logistics: How efficient is your picking & packing process?
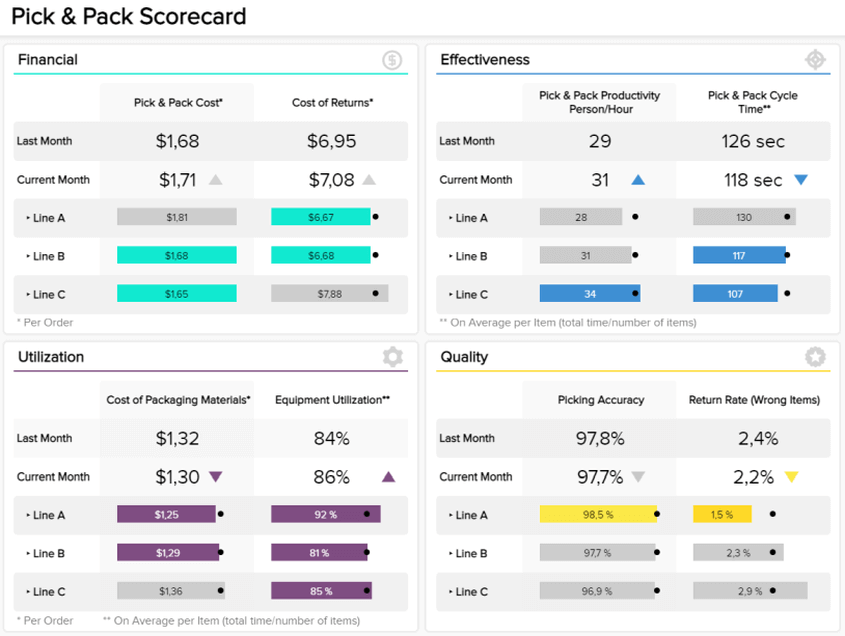
**click to enlarge**
Our final example is a logistics dashboard that focuses directly on the operational efficiency of the picking and packing process. With operational KPIs divided into four big categories financial, effectiveness, utilization, and quality, this template gives you a bigger picture of the performance of all relevant areas related to order processing.
On one hand, tracking metrics like the use of packing materials or the costs of return can help you implement strategies to keep costs at a minimum. On the other hand, tracking the equipment utilization as well as the pick and pack cycle length will help you find any inefficiencies that might be affecting productivity and find efficient solutions in time. In the long run, you will be able to optimize all relevant processes and lower your costs while still delivering a quality service.
Finances: Ensure efficient cash management
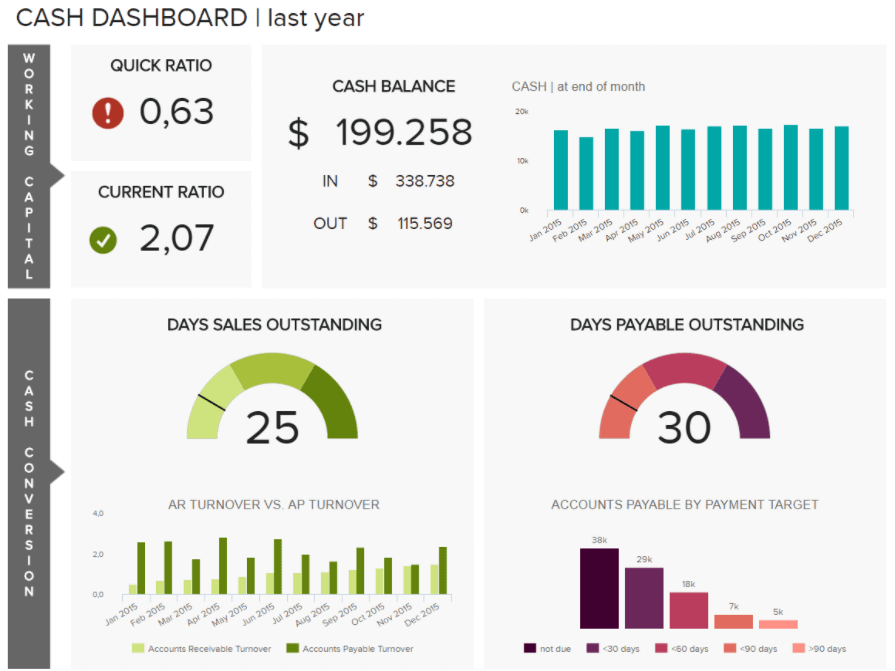
**click to enlarge**
We are moving on with a financial dashboard example focusing on achieving an efficient cash management process. It does this by providing an overview of your business liquidity and current cash flow through metrics such as accounts payable and accounts receivable, cash balance, current ratio, and more.
For this purpose, the dashboard is divided into two sections. On the top, we have the working capital, which provides insights into how capable your company is at paying its debts in a short-term period. This allows you to understand the overall financial health of the organization. On the bottom side, we have cash conversion metrics that directly influence your business cash flow. Here we get data on accounts payable and account turnover, which measure the speed at which you pay your own bills and how fast you are collecting your payments owed, respectively.
Healthcare: Are you providing quality care?
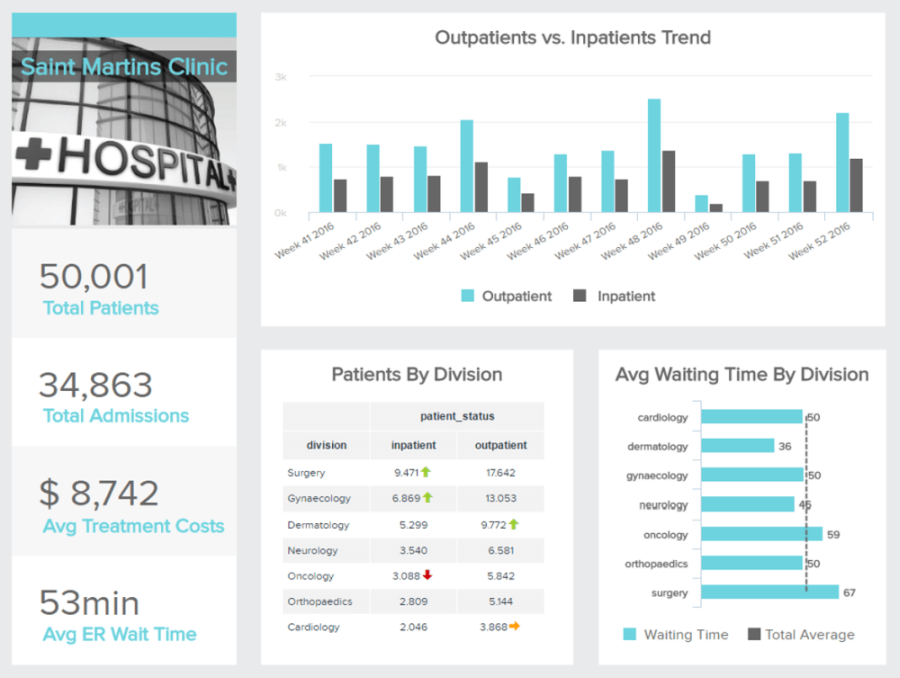
**click to enlarge**
Last but not least, we have a healthcare dashboard tracking various operational metrics regarding hospital performance. This example is a centralized tool that allows hospital managers to get a complete view of every relevant aspect to ensure efficient facility management. With this kind of real-time access to data, managers can spot trends and improvement opportunities to ensure the facility is providing excellent care to its patients.
As we saw in our list of operational KPIs in healthcare examples, tracking indicators such as the patients by division and comparing them to the average waiting time can shine a light on some issues that can be easily optimized. For instance, we can see that inpatients for the surgery division are the highest; this coincides with the fact that this same division has the highest waiting time. Therefore, something needs to be done to ensure an average waiting time for surgery.
How To Select Operational Metrics And KPIs?
Since every business is different, it is essential to establish specific metrics and KPIs to measure, follow, calculate, and evaluate. As mentioned earlier, both are used to measure business performance, so use these tips to decide which ones should be used in which scenarios and what to be careful about when selecting the right one for your business.
- Understand the role of business KPIs, what they can tell you, and what you will do with the information you collect. This will allow you to make informed decisions regarding which KPIs and metrics to track and what you hope to learn from them to improve your company’s operations.
- Decide what needs to be measured—you don’t have to (and shouldn’t) measure everything. Operational KPIs and metrics can be immense and boundless if not defined and used properly, so taking care of the basics we have outlined should be one of the top priorities when deciding on which one to use.
- Take a holistic approach when deciding which operating metrics and KPIs to use. A business cannot track only one and expect to obtain sustainable development. By using multiple types of metrics and professional operational reporting tools, companies can leverage more data and acquire insights needed for success.
- Assign someone to measure it, ideally, someone who has the power to make an impact on that KPI. This ensures that monitoring is accomplished and doesn’t fall by the wayside when things get busy. It also creates a go-to resource for questions about that KPI.
- Select the time interval between measuring each KPI. With some KPIs, it might make sense to evaluate your data on a rolling monthly basis to detect trends and changes. Others you’ll want to evaluate in real time because they may require quick action.
- Understand who will benefit from the KPIs and ensure you share your information with those people. Storing your KPI data on a shelf to collect dust won’t drive longstanding change and impact. Rather, the people involved in those functions and processes have the power to change how things are done and need to understand why change is necessary.
- Decide how frequently to send this information to the management level. Managers and other stakeholders should be informed about any progress being made and any issues your KPI monitoring has surfaced. But they may not need to know every time you run a report. Work with stakeholders to see how often they prefer to be looped in.
- Re-evaluate your KPI monitoring over time. Just as your business needs change from time to time, so might your KPIs and metrics. Many companies start with just a few KPIs, then add more as they mature. In other cases, you might get new machinery, a bigger workforce, or more products or services that require you to monitor more areas that you didn’t need to monitor before.
- Turn your datasets into a business dashboard to effectively track the right values. The analysis of operational KPIs and metrics can be accomplished by turning raw data into an interactive online dashboard with the right KPI software. This can provide insights that may otherwise be overlooked when creating traditional means of reporting and analysis, like spreadsheets or simple written reports.
Try our professional reporting software for 14 days, completely free!
Metrics Meaning In Business - Key Takeaways
We have presented the key metrics definition, focused on operations management metrics, and delivered visual examples followed by their interconnectivity in certain use cases. Now you can select from multiple examples of operational KPIs, adjust based on your function in a company, and create an operational metrics dashboard that will contain all essential information to generate long-term business success.
By collecting the right data, visualizing, taking advantage of real-time updates, and sharing insights with relevant stakeholders, each member of the team has the opportunity to outperform their goals, immediately act on inefficiencies, and establish a positive, data-driven culture that will benefit the company as a whole. A KPI for an operations manager is an invaluable tool that will ensure the operating level of a business is functioning in a healthy way and each part of the business puzzle has the means to monitor, analyze, evaluate, and generate actionable insights. That way, the company can grow, the team can know exactly what to focus on, and the results, such as increased productivity and efficiency, will follow.
To conclude, the aspects of operational metrics and KPIs, viewed from different industries, levels of operations, and specific processes needed to establish sustainable development, can be effectively managed if you set valuable indicators to track the performance of a company. It is not just about collecting data, it is also about interpreting them in the right context and organizing them to complement the companies’ intelligence performance to deliver positive results and growth. To successfully define metrics, you need to take a closer look into your business, and
To put things into perspective, here are 32 key operational efficiency metrics from different functions and industries:
- CPC
- CPA
- Goal conversion rate
- Absenteeism rate
- Overtime hours
- Employee turnover rate
- Order status
- Sales by region
- Sell-through rate
- Lead-to-opportunity ratio
- Lead conversion ratio
- Sales opportunity score
- Delivery time
- Transportation costs
- Picking accuracy
- Pick and pack cycle time
- Total tickets vs. open tickets
- Average handle time
- Server downtime
- Production volume
- Production downtime
- Throughput
- First pass yield
- Accounts receivable turnover
- Current ratio
- Operating profit margin
- Patient waiting time
- Hospital readmission rates
- Bed occupancy rate
- First call resolution
- Average response time
- Total & solved issues by channel
To get started with your own operational data story, try our software for a 14-day trial completely free!