What Is Ad Hoc Reporting? Your Guide To Definition, Meaning, Examples & Benefits

Table of Contents
3) Benefits Of Ad Hoc Reporting
5) Static vs. Ad Hoc Reporting
6) Challenges Of Ad Hoc Analysis
7) How To Create Ad Hoc Reports
Digital data is all around us. In fact, we create around 2.5 quintillion bytes of it every single day, with 90% of the world's digital insights generated in the last two years alone, according to Forbes.
If utilized correctly, data offers a wealth of opportunity to individuals and companies looking to improve their business intelligence, operational efficiency, profitability, and growth over time. In this day and age, a failure to leverage digital data to your advantage could prove disastrous to your business – it’s akin to walking down a busy street wearing a blindfold.
With the rate of available data growing exponentially, it's crucial to work with the right online reporting tools to not only segment, curate, and analyze large data sets but also uncover answers to new questions that you didn't even know existed. And when it comes to finding actionable answers to specific questions, ad hoc analysis and reporting are essential. We will explain the meaning, benefits, and uses in the real world. Let's kick it off!
What Is Ad Hoc Reporting?

**click to enlarge**
Ad hoc reporting is a branch of business intelligence used to generate one-time reports in the form of dynamic dashboards with real-time data. With the help of self-service BI tools, users can easily create ad hoc reports as required without technical knowledge.
Working alongside recurring or ongoing (daily, weekly, or monthly) data reports, ad hoc reporting forms a vital part of any business, brand, or organization’s growth and sustainability by offering a level of insight that adds an extra layer of substance and success to the data-driven decision-making process.
While these reports are typically developed using SQL (structured query language) by an IT department, which can take several days, some tools and platforms allow non-technical business users access to these most precious insights simply using a SQL report generator. And this lies in the essence of the ad hoc reporting definition, providing quick reports for single-use without generating complicated SQL queries.
Moreover, a host of ad hoc analytics or reporting platforms boasts integrated online data visualization tools to help enhance the exploration process. This reduces the reliance on software developers or IT personnel for simple reporting.
After explaining the report's meaning, we will take a closer look at the analysis part in more detail.
What Is Ad Hoc Analysis?
Ad hoc analysis is a business intelligence (BI) process companies use to answer critical one-off questions in real time. It allows for spontaneous and agile decision-making during strategic discussions, making the reporting process flexible at the risk of less accuracy.
With ad hoc analysis tools, users often create a report that does not currently exist or drill deeper into an existing dashboard report to achieve a deeper level of insight that ultimately benefits the ongoing success and sustainability of the organization.
Ad hoc data analysis is the discoveries and subsequent actions a user takes as a result of exploring, examining, and drawing tangible conclusions from a report.
Typically, ad hoc data analysis involves discovering, presenting, and actioning information for a smaller, more niche audience and is slightly more visual than a standard static report. Now that you know the two main definitions, it is time to look into the benefits and, afterward, real-world and practical examples.
The Benefits Of Ad Hoc Reporting And Analysis
Now that we have answered the question, ‘What is an ad hoc report?’, let’s look at the clear-cut benefits of using these types of data reports:
1. Reduces the IT workload:
The self-service nature of ad hoc reporting catalyzes the report creation process by allowing end-users to work with customized reports on niche areas of the business without relying on the technical assistance of developers. This saves time and costs while minimizing any potential interdepartmental roadblocks.
2. Easy to use:
As ad hoc data analysis platforms or dashboards are intuitive and visual by nature, uncovering the right answers to the right questions is simpler than ever before, allowing users to make decisions and roll out initiatives that help improve their business without the need for wading through daunted streams of data.
3. Ensures flexibility within the constantly changing business environment:
Ad hoc analytics offers an interactive reporting experience, empowering end-users to make modifications or additions in real-time. As report elements are picked individually, users can ask questions and customize their needs and goals. It is of utmost importance to answer business questions as quickly as possible, and one of the benefits of ad hoc reporting provides just that - the possibility to follow the ever-changing business environment as the business moment requires and continually evolves.
4. Saves time and costs:
Modern ad hoc reporting tools are designed to save countless hours since their interface is designed to be simple yet powerful. The intuitive nature helps users create interactive visuals without waiting for a professional analyst or, as mentioned, the IT department. This self-service BI nature that enables a data-driven system completely in control by the user ultimately saves countless working hours and costs since users don't have to wait for reports and build as many types as needed.
Moreover, the team will be more engaged if they can immediately manipulate formulas and avoid multiple spreadsheets to consolidate data or static presentations that are fixed upfront and give no possibility to dig deeper into the data.
5. Completely customizable:
While ad hoc enterprise reporting is focused on gaining and keeping visibility across a large organization, it's important to consider the customization possibilities that these solutions have on offer. Some of the tools offer built-in dashboards, for instance, that already have templates that you can use and adjust based on your needs. That way, you can save even more time and focus on what truly matters: the business answer you were looking for. But not only that, the possibility to build your queries within the advanced SQL box, as mentioned, will provide you with even more freedom if you're an experienced analyst and looking for modern software solutions.
Types Of Ad Hoc Reports Examples - Analysis Applied To The Real World
There’s no doubt about it: ad hoc analysis offers a wealth of value to businesses across industries and sectors. To demonstrate its potential, let’s delve deeper into the practical applications of this invaluable data-driven initiative in the business world.
- Ad hoc financial analysis:
The first in our list of ad hoc reporting examples is focused on finance. By its very nature, the financial industry (or the financial departments) is rife with facts, figures, financial KPIs, metrics, and data. Ad hoc data analysis has offered businesses the means to drill down deep into very concentrated segments of data – or business aims – gaining the ability to spot trends that will provide the best return on investment (ROI).
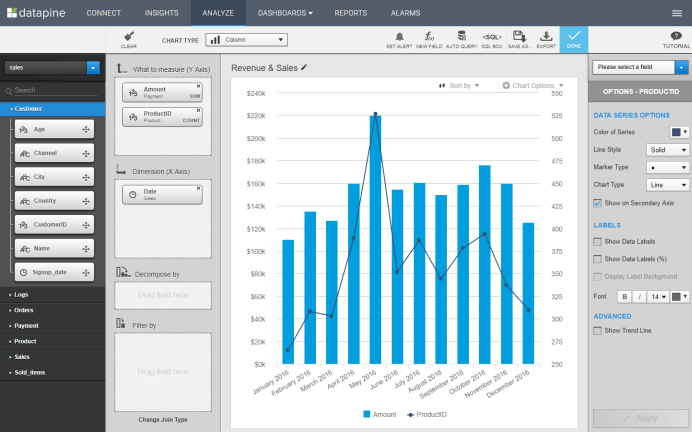
In essence, you perform ad hoc financial reporting whenever you need to better understand your financial data. For instance, at the end of the month, you need to find out how much revenue you have left after deducting your direct costs. Essentially, you (or a stakeholder) want to know your gross profit margin ASAP.
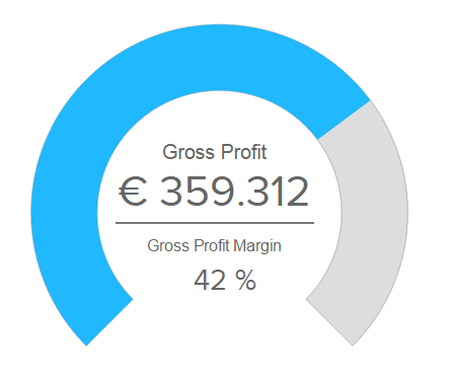
What ad hoc reporting brings here is an immediate answer, without waiting for days from the IT department to generate a simple visual like the one above or complete ad hoc dashboards if you have a specific meeting or presentation planned.
While these are the primary industries that benefit from this analytical practice, regardless of your sector, by utilizing reports like this alongside interactive business intelligence dashboards, you will see notable improvements in key areas of your business by utilizing reports like this alongside interactive business intelligence dashboards.
- Ad hoc reporting in sales:
Ad hoc reporting and analysis can be used in a company with a large sales database. Let's say a user wants to determine the outcome of a specific sale related to a particular scenario. S/he would build a single report, used only once, to provide that result. This scenario can be found in companies with a large outside sales force, which then can export an ad hoc report showing results from their territory (number of clients visited or leads generated) against overall sales goals.
- Ad hoc reporting in healthcare:
Another area we can focus on is healthcare. A physician may not know how to build an HTML report or run a SQL query, but a reporting tool can easily generate data that are needed quickly and only once - a blood test report, for example, or how many people were admitted to the ER on a specific day/week.
Ad hoc analysis has served to revolutionize the healthcare sector. Utilizing healthcare analytics software by providing greater data visibility and improving accuracy while helping senior stakeholders in such institutions make swift and accurate decisions that ultimately save lives, improve operational efficiencies, and decrease mortality rates.
- Government:
Governmental entities deal with a wealth of critical information, insights, and decisions that ultimately affect many people. By gaining the ability to hone in on very specific tasks or challenges and reach the level of insight needed to make accurate, prosperous decisions while automating manual data-gathering tasks, governmental bodies across the globe enjoy improved public fund allocation while boosting productivity. A testament to the power of ad hoc analysis.
- Ad hoc recruiting reports:
Running personalized, quick, and accurate recruiting reporting is paramount in our competitive business environment. Using an ad hoc reports example from HR, companies have the chance to spot deficiencies within their human resources management and improve employee satisfaction levels, which is critical considering the lack of talent across industries.
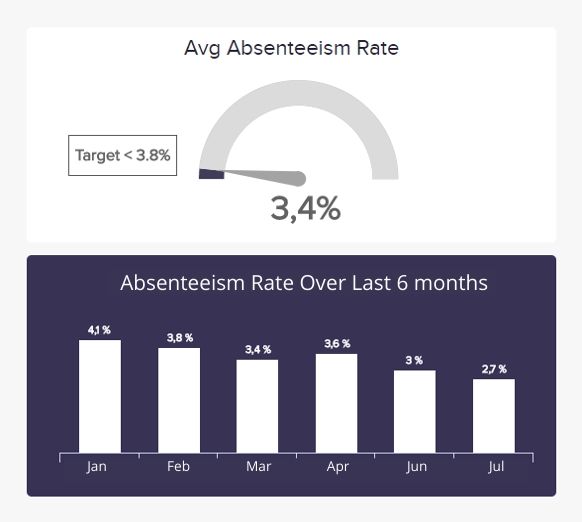
In a practical sense, you could suspect or assume a higher absenteeism rate over a year or six months. Investigating further by generating an ad hoc reports example similar to the one above could prove to be extremely advantageous. The company can identify if the assumption was correct, meaning if rates went higher, were stable, or decreased. If there is an increment, you can easily determine the cause by engaging with employees and finding an appropriate solution to your problem. To create such visuals, you can explore our article on the most prominent recruitment metrics.
- Retail:
These types of solutions prove particularly effective in loss prevention in the retail sector. Through store-specific retail analytics tailored to particular areas of loss prevention, such as shoplifting or employee theft, a host of notable retailers have been able to track inventories and spot trends that have saved them a great deal of money (and time) in the long run.
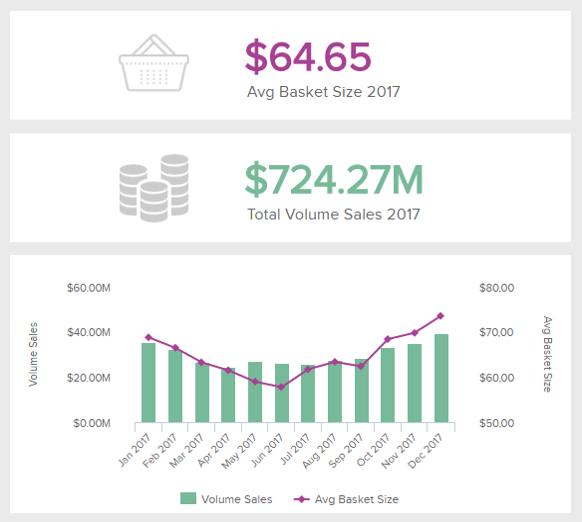
In retail, it's important to regularly track the sales volumes to optimize the overall performance of the online shop or physical stores. An ad hoc report example such as the one above could pinpoint specific weeks where the sales volume was lower than usual. By examining the column chart deeper, you can conclude that the demand was lower due to external conditions, for example, such as a heavy storm that postponed deliveries and caused many cancellations.
- Education:
The educational sector is vital to the future of our society, and ad hoc data analysis has played a significant role by streamlining a host of processes through focused data and analytical reporting. It also facilitates the sharing of information between departments to help engage students on a deeper, more personal level. This level of initiative results in improved success for faculty, students, and, in turn – the economy.
What these types of reports bring to the table is simple: efficient decentralization of data management and transferring the analytical processes directly to the end-user. While you can utilize numerous data analysis methods you can utilize, an ad hoc reporting system will enable you to perform analyses on the spot and immediately answer the question you have asked. This is not only critical in business intelligence but, as we have seen, in other areas such as education or government services.
- Customer service:
Maybe more than any other department, customer service can benefit from a one-time report to answer critical questions that will guide them on the path to offering the best possible support to customers. For instance, a support manager might need to generate a report to understand how many tickets were solved in the past week and on what communication channels so they can plan their strategies accordingly.
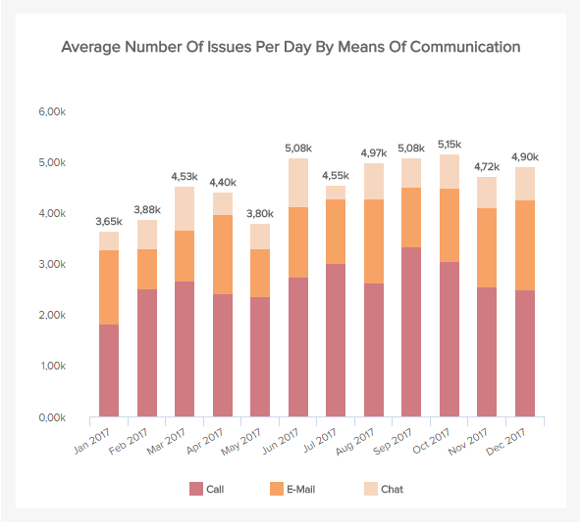
A deeper drill down into this data can shine a light on other elements that are interesting to look at. For example, by comparing the peak times in which customers are most likely to call, managers can ensure that agents are available at those times to cover the demand. Additionally, you can look into the average time to solve an issue and tackle any inefficiencies.
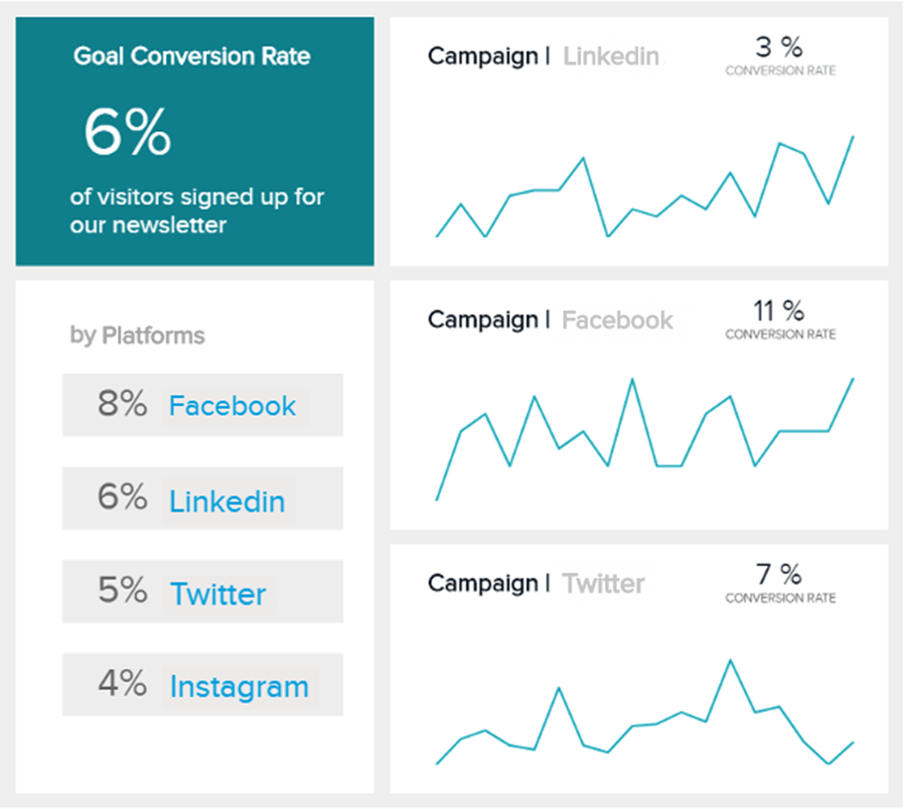
- Marketing:
As seen throughout this post, ad hoc reports present data visually, making it easier to analyze and extract actionable insights on the spot. This is particularly true when it comes to making the most out of your marketing efforts. When dealing with promotional campaigns, you need to make the most out of your available resources. When a promotional campaign was launched in the past, it was not known whether it was successful or not until a report was generated after a few weeks. Thanks to the speed of this kind of report, marketers can now understand in real-time how a campaign is being perceived and adapt it accordingly to avoid wasting resources.
- Manufacturing:
In the manufacturing industry, the use of real-time data provided by an ad hoc report proves to be extremely useful. Knowing the status of the different production stages allows businesses to stay on top of any issues and ensure production runs as planned to meet customer shipping deadlines.
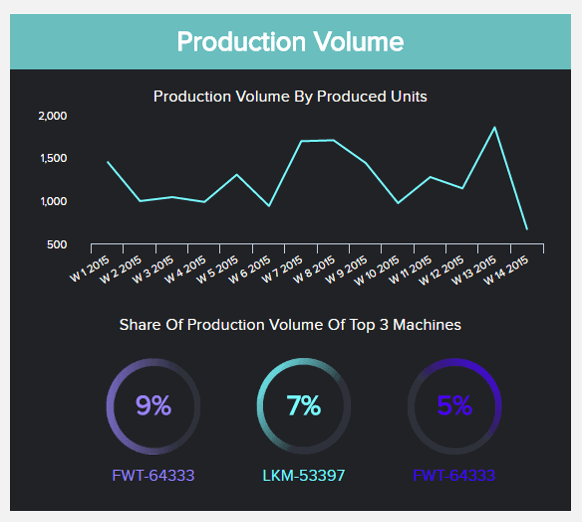
For instance, a manufacturing company with a big delivery coming can create an ad hoc report to understand the share of production for the different machines. If a machine is observed to be underperforming, the report will show it, and corrective measures will be implemented.
11. Logistics
Probably more than any other industry on this list, logistics is the one that can benefit the most from ad hoc analysis and reporting. Getting on-the-spot information about several operational processes, such as the number of orders, inventory labels, machine performance, workforce availability, and much more, enables logistics managers to find any potential bottlenecks to ensure the daily operations are running smoothly and customer deadlines are being met.
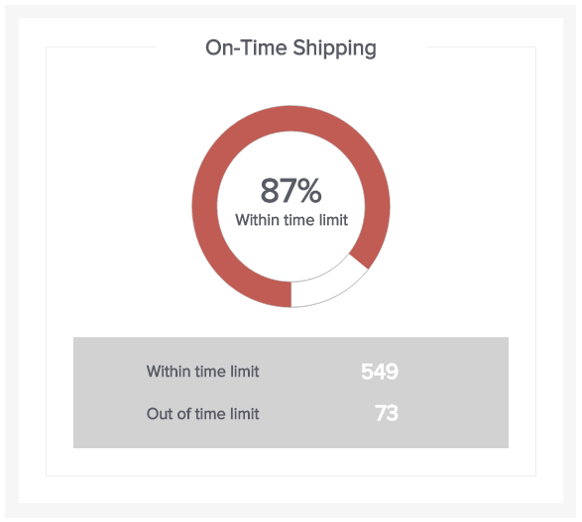
The ad hoc report sample above tracks the on-time shipping. This is one of the most important logistics KPIs to track, as it directly influences customer satisfaction. Generating an ad hoc document for this KPI daily to understand how the warehouse performed is a great way to spot improvement opportunities and tackle any inefficiencies.
12. Procurement
Last but not least, we have procurement. Just like all other industries, the procurement department can benefit from ad hoc management reports to identify weak areas and streamline their performance in real time. This level of insight enables them to uncover trends and patterns to negotiate better contracts with suppliers and obtain the best materials and services.
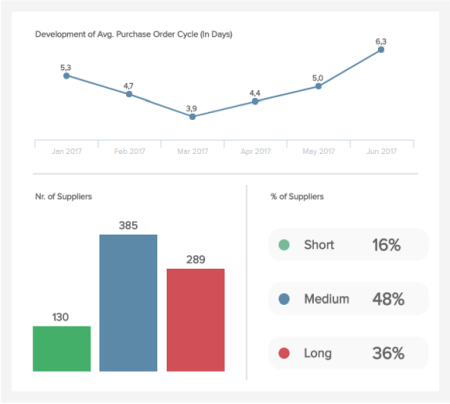
The image above shows an example of how the department can benefit from these kinds of tools during its procurement analytics process. For instance, if the CPO needs to send an urgent order to a supplier, he or she can generate an ad hoc report about supplier purchase order cycle time and identify the supplier with the shortest cycle.
Static Reports vs. Ad Hoc Reporting: Key Differences
So far, we’ve covered some definitions and benefits and looked at practical examples of how ad hoc reports can facilitate the way average business users can manage data on their daily activities. To keep putting their value into perspective, we will compare them to a more traditional approach to data management: static reports.
Also known as canned reports, this traditional way of reporting has been performed for decades and used by businesses to assess their past performance. These documents are usually generated by data analysts or the IT department and handed to decision-makers on a weekly, monthly, quarterly, or annual basis, depending on previous requirements. Some of the main differences between these two include:
- Generation: The first difference between these two analytical tools is the way they are generated. As mentioned, static reports are usually created by the IT team upon request of the different departments that use them to answer vital questions. Due to their static nature, the information on them can’t be explored, which makes them less versatile. On the other hand, ad hoc reports are easily generated by the average business user on a need-to-know basis and used to make important decisions. The learning curve for users with no experience can indeed be a challenge, but with the help of the right self-service tool, it is fairly easy to manage.
- Usability: Next, we have usability. As mentioned, static reports can’t be navigated or manipulated to respond to a specific question on the spot as they are generated with a specific aim in mind and for a wider audience. If a different need arises, a new report needs to be ordered, which can take hours or days to be completed as the IT department might already be busy with other tasks. On the contrary, ad hoc reporting has interactivity and real-time data as a base. They can include various levels of data and are easily navigable to answer any vital question that arises. This is possible thanks to interactive filters and visualizations provided by a dashboard tool.
- Format: The format in which reports are utilized is another huge difference between these two methods. On the one hand, static documents are usually sent via email in the form of a spreadsheet or PowerPoint presentation. On the other hand, ad hoc analysis can be accessed online from any device with an internet connection. This is one of the multiple BI features you can enjoy if you pick the right solution for your organization.
- Accessibility: Following the same line as the last point, accessibility is a key element when comparing the two. As mentioned above, a static report is usually shared via email in traditional formats such as an Excel sheet. If something is changed, the user needs to browse through several versions of the same document, which makes it confusing and harder to collaborate. Ad hoc reporting has shearability and data transparency at its core. Thanks to their online nature, reports can be easily shared between departments to implement a collaborative data-driven environment.
All these points are not to say traditional reporting is bad. In some cases, static documents are useful for businesses, such as showing financial compliance to authorities. That said, their static nature can seem tedious and repetitive for the daily decision-making process. Not to mention, it burdens the IT department with a load of work that is not even as efficient as it could be. For this reason, BI solutions with a self-service approach present a way to manage data in a way that is time-efficient, accessible, and interactive. Regardless, the use of these technologies also comes with challenges for organizations. We will explore some of them in the next section.
Challenges Of Ad Hoc Analysis & Reports
While implementing ad hoc reporting and analysis in the organization might seem perfect on paper, it doesn’t come without challenges. Although the use of data has become a mandatory practice for modern businesses, there is still a big knowledge gap for average users that make it a bit harder and intimidating to use data for their decision-making process. This is paired with other limitations that we will explain below.
- Lack of literacy: Studies say that 90% of company leaders cite data literacy as a driver for overall success. However, only 25% of employees say they feel confident working with it. Considering the self-service nature of ad hoc analysis, the lack of knowledge or confidence can present a big challenge. Paired with the lack of general data knowledge, it is also possible to face challenges with employees that are simply not tech-driven or don’t have the initiative to learn. To tackle this problem, implementing training instances to show the friendlier side of analytics is a good way to start empowering employees to implement this practice into their regular workflow.
- Incomplete data: Having all your data in one centralized location is a key element to ensure a successful ad hoc reporting system. If your information is spread across multiple locations, it can make the report-generation process a lot more difficult. Luckily, BI dashboard tools offer fast and efficient integration of multiple sources that can be visualized in an interactive report with just a few clicks.
- Lack of governance: Not having an appropriate system to manage the massive amounts of data coming into your organization is another great challenge of ad hoc analysis. Data governance is the practice that ensures data remains secure, available, and usable. Therefore, it is fundamental to implement it to ensure efficiency across the entire reporting process.
- Covering the needs of all departments: Another challenge is to cover the needs of all departments. This point is related to the stage in which company leaders are deciding on what tool to invest in. As mentioned earlier, traditional reports were meant for wider audiences, while ad hoc ones are more specific and required to answer particular departmental needs. To tackle this challenge, it is necessary to generate an outline in advance and select the tool with the features that will serve all organizational needs the best. To assist you with this task, you can find key features below.
How To Create An Ad Hoc Report
Now that you know the ad hoc meaning in business, benefits, and challenges of implementing these kinds of reports into your organization, we will dive into some best practices you should follow to ensure you are extracting the maximum potential out of them.
- Define the question you want to answer
Since the end goal of an ad hoc report is to answer a question that is not already answered in an existing report, it is a crucial step to think carefully about that question before diving into the actual generation. This practice should be followed for any kind of report, especially for ad hoc analysis, as you don’t want to waste time answering a question already covered in previous reports. Plus, knowing what question or end goal you are trying to analyze will help you pick your data and layout more efficiently. This leads us to our next point.
- Select your data
One of the benefits of modern data analysis is the fact that you can gather data from multiple internal and external sources to get a 360-view of product performance, customer behaviors, and various internal processes. That being said, gathering too much data can be a double edge sword, as having a lot of information can mislead your analysis. This is especially true for ad hoc analysis, as those reports aim to answer a specific question quickly and efficiently. Therefore, you should start by defining the question or discussion you want to explore and select only the data that will help you find the answers you are looking for.
- Use the right visuals
As we saw in the challenges section, the lack of technical skills can often present a challenge for these reports. This lack of skills can translate into using the wrong data or visuals and extracting the wrong conclusions. While the self-service nature of these reports significantly mitigates this issue, it is important to carefully pick your visuals considering the end goal of your analysis. That way, you can tell a compelling and engaging story. Setting the tone to build agile and efficient strategies.
- Prioritize simplicity
This is a best practice that can be applied to any type of reporting-related area but is especially important in an ad hoc environment due to the need for agile and efficient analysis. When we talk about prioritizing simplicity, we mean avoiding overcrowding the report with unnecessary data but, most importantly, considering design best practices. Choose a smart layout to tell an engaging story with your KPIs, use only a couple of colors that are not too strong or vibrant, and stay away from 3D effects and any other distracting elements, among other things. This is not to say that you should generate a boring report. It is about being smart and only placing the elements to make your process more interactive and efficient.
- Collaborate with your team
Once you have generated your reports following the best practices we mentioned above, it is of utmost importance to make the process as collaborative as possible. Share your findings with team members and other relevant stakeholders and support any discussions that might arise during meetings and other instances. This is a fundamental part of successful analysis, as collaboration and communication will ensure your business is continuously growing and exceeding its targets.
Now, you might be wondering, how do I make all this happen? Luckily, modern ad hoc reporting tools provide a wide range of functionalities that will enable you to not only visualize your data but take your insights one step further. To help you understand a bit more about these solutions, below we will dive into the main features and functionalities you should be looking for.
What To Look For In Ad Hoc Reporting Tools?
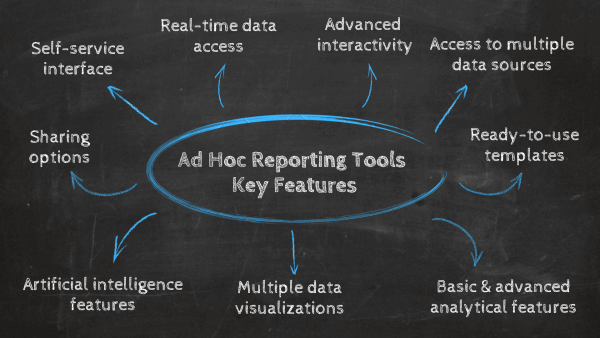
To create the best possible reports, there are some features that these solutions should have on offer to ensure maximum application value. Here we list the most critical ones:
1. Self-service reporting interface
Considering that ad hoc reports are generated for one-time use, it is of utmost importance to invest in a tool that offers a self-service interface and features. In the past, reports were created by the IT department, and it could take hours or even days to get them. That is no longer enough in today’s fast-paced business environment, where decisions must be made as quickly as possible. A self-service tool enables all users, regardless of technical knowledge, to generate reports and extract valuable insights to boost their strategies.
2. Real-time access to fresh data
As mentioned a couple of times already, the true value of ad hoc reports lies in their interactivity and agility. Therefore, a professional ad hoc analysis tool should offer real-time data at the center of its functionalities. Our reporting tool offers users complete access to fresh data as soon as it is generated. This way, decision-makers can generate reports in a matter of seconds and answer any critical questions that might arise efficiently. All the user needs to do is connect the data sources, and the tool will update them every couple of minutes to show any relevant insights that might arise. After all, the true value of modern reporting solutions over traditional tools such as Excel is agile and flexible decision-making.
3. Advanced interactivity features
It's fairly easy to generate a spreadsheet, but if that spreadsheet doesn't give you the answer you're looking for, then you will have thousands of rows and columns that will cannot easily manipulate with. Interactive ad hoc reports will enable you to drill into bits and pieces of specified data analysis and ensure you can interact with your report using advanced interactive features of professional business intelligence dashboard software.
From advanced chart options and sophisticated filters to time intervals and chart zooms, the possibilities to interact with your data are immense. Besides, overcrowding your screen space is a thing of the past - interactivity features of the modern dashboard software continue to evolve and adjust to the users.
4. Access to numerous data sources
By having access to different data sources in one single place, a report can easily answer current and upcoming business questions with every piece of data a company has.
With solid ad hoc reporting software, it's possible to apply controls to specific dashboards by adding elements like screen filters, sliders, conditional formatting for filtering, and link reporting dashboards for direct comparison. That way, all data can be easily accessed and managed.
5. Basic and advanced analytical possibilities
These reporting solutions need to offer basic and advanced analytical capabilities. No matter if you're an average business user that needs to extract a simple report or an advanced analyst that creates custom queries, ad hoc analyses should cover both. That way, the business user has a chance to utilize a drag-and-drop interface where you simply need to drag the values to be able to analyze them, and the analyst has a special SQL box where s/he can build queries on their own.
6. Data visualization capabilities
It's a scientific fact that humans are visual learners since half of the human brain is devoted to processing visual information. Data visualization helps understand larger or smaller volumes of data much faster than the written or spoken word. In other words, charts are much more powerful than pure numbers, columns, or rows of raw data. For example, a sales graph will immediately show you the main developments in your sales processes compared to simply presenting a spreadsheet filled with numbers or a PowerPoint presentation clogged with bullet points and sentences.
7. Professional ready-to-use templates
By now, you already know that one of the biggest benefits of using ad hoc reports is that they provide a flexible and agile means of making strategic and operational decisions. That is possible thanks to interactive, ready-to-use templates offered by these modern solutions. Ad hoc analysis providers think of common questions businesses must answer during their analysis process and offer extensive template libraries for different scenarios, areas, and departments that users can select and start analyzing with just a few clicks.
8. Artificial intelligence features
Operational ad hoc reporting oftentimes also includes questions about the future. Professional software has built-in predictive analytics features that are simple yet extremely powerful. For a practical ad hoc analysis example, let's say a stakeholder wants to know what kind of revenue they can expect in the next 6 months based on the specified marketing channels. The tool will automatically calculate predictions based on selected past data points, and you have your answer within minutes. Remember that although these features are extremely advanced, no one can predict the future with 100% accuracy. The point is to gain a data overview to better prepare for potential business changes.
9. Numerous sharing options
One of the goals of business intelligence and ad hoc reporting is to simplify the decision-making processes while enabling a collaborative culture between colleagues and departments. The creation of reports is fairly easy, but the sharing process should be as well. Professional business reporting software will cover multiple sharing options:
- sharing through e-mails immediately or within a specified time interval
- viewer area that enables external parties to manipulate the dashboard based on filters you have assigned
- public URL will enable you to send a simple link
- An embedded dashboard that you can insert within an application or website, e.g.
Ad Hoc Reporting Tool Example
It's clear that ad hoc reporting offers many benefits to the ongoing success and growth of any ambitious modern business. And when it comes to ad hoc reporting software that offers freedom, flexibility, and usability while helping answer critical questions both swiftly and accurately, datapine's data visualization and reporting tool ticks all the boxes.
Aimed specifically at the end user, our different types of dashboards and self-service reporting tools are intuitive and accessible, so you don’t have to possess a wealth of technical knowledge to utilize our platforms. The drag-and-drop interfaces make handling important data sets both logical and digestible. Moreover, our cutting-edge algorithms run in the background of our applications to fortify our interface with enhanced built-in intelligence to help you during every step of your ad hoc data analysis journey.
For reporting on the go, our tools, applications, and dashboards also allow you to monitor data and generate fresh insights anytime, anywhere, with your web browser or tablet, safe in the knowledge that your data privacy and security are being preserved to the highest standards.
At datapine, we've invested an incredible level of time and effort in developing an enterprise-level security layer akin to core banking applications. As a result, it’s possible to copy existing data into our data warehouse to speed up your workload or retain your data in-house by connecting datapine to your server remotely. And as you’re free from the shackles of managing your data from one specific location, sharing your dashboards, KPI reports, discoveries, and insights with colleagues are possible with just a few clicks.
To discover more about our tools, solutions, and services, explore our business intelligence features page.
If you want to delve deeper into the power of superior data analysis, then our completely free 14-day trial will help you to start your journey towards data-driven enlightenment!