10 Case Studies On The Benefits of Business Intelligence And Analytics

Table of Contents
1) Why Is Business Intelligence So Important?
2) What Are The Benefits of Business Intelligence?
Using business intelligence and analytics effectively is the crucial difference between companies that succeed and companies that fail in the modern environment. Why? Because things are changing and becoming more competitive in every business sector, the benefits of using business intelligence and proper use of data analytics are key to outperforming the competition.
For example, in marketing, traditional advertising methods of spending large amounts of money on TV, radio, and print ads without measuring ROI aren’t working like they used to. Consumers have grown increasingly immune to ads that aren’t targeted directly at them.
The companies that are most successful at marketing in both B2C and B2B are using data and online BI tools to craft hyper-specific campaigns that reach out to targeted prospects with a curated message. Everything is being tested, and the successful campaigns get more money put into them, while the others aren’t repeated.
But what is the true value of BI? In this post, we will explore ten advantages of business intelligence supported by real-world BI case studies. By the end, you’ll need to double down on creating a data-driven culture at your company, and you’ll have some hard evidence you can use to persuade skeptical teammates.
Let’s get started!
Why Is Business Intelligence So Important?
The main use of business intelligence is to help business units, managers, top executives, and other operational workers make better-informed decisions backed up with accurate data. It will help them spot new business opportunities, cut costs, or identify inefficient processes needing reengineering.
BI software uses algorithms to extract actionable insights from a company’s data and guide its strategic decisions. BI users analyze and present data in the form of dashboards and various types of reports to visualize complex information in an easier, more approachable way. Business intelligence can also be called “descriptive analytics,” as it only shows past and current state: it doesn’t say what to do, but what is or was. The responsibility to take action still lies in the hands of the executives.
This “test, look at the data, adjust” methodology is at the heart and soul of business intelligence. It’s all about using data to understand reality better so that your company can make more strategically sound decisions (instead of relying on gut instinct or corporate inertia).
Ultimately, business intelligence and analytics are about much more than the technology used to gather and analyze data. They’re about having the mindset of an experimenter and being willing to let data guide a company’s decision-making process.
Experience the power of Business Intelligence with our 14-days free trial!
What Are The Benefits of Business Intelligence?
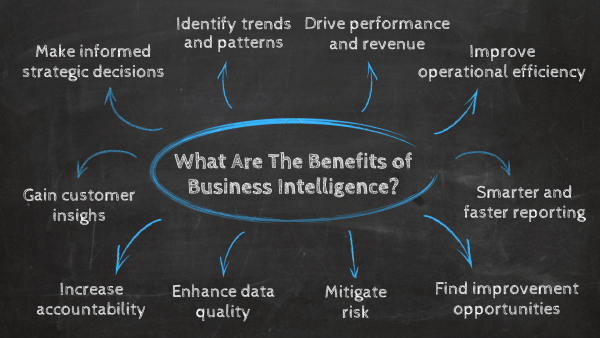
The benefits of business intelligence and analytics are plentiful and varied, but they all have one thing in common: they bring power. The power of knowledge. Whichever unit they impact, they can deeply transform your organization and how you do business. Here is an overview of 10 main business intelligence benefits:
- Make informed strategic decisions: Business intelligence and analytics provide valuable data insights, empowering decision-makers to make more informed choices.
- Identify trends and patterns: By analyzing data from multiple sources, companies can delve into customer behaviors, business performance, and the industry landscape. This deep dive allows them to hone their competitive advantages and identify areas for improvement.
- Drive performance and revenue: Using targeted strategies, businesses can identify new revenue opportunities, optimize pricing, and maximize profitability.
- Improve operational efficiency: BI tools offer a bird' s-eye view of all operations, allowing companies to identify bottlenecks, streamline processes, and optimize performance.
- Find improvement opportunities through predictions: Businesses are better positioned to anticipate market changes and project needs and proactively adjust their marketing and operational strategies using predictive analytics.
- Smarter and faster reporting: With data and analytics in a single place, users can quickly and easily report on performance and progress, share with stakeholders, and choose their next best actions.
- Mitigate risk: Analyzing trends and historical data can better understand risks and potential threats.
- Enhance data quality: BI initiatives often require data cleansing and standardization exercises, both of which can ensure you’re collecting accurate and usable data.
- Increase accountability: BI provides transparency into key performance metrics and business processes, which can foster accountability within organizations.
- Gain essential customer insights for ongoing growth: Learning more about customer preferences, behaviors, and needs can lead to more targeted marketing and positioning and greater customer satisfaction.
Benefits Of Business Intelligence: 10 Real-World Valuable Use Cases
Here are ten use cases that illustrate the different benefits of business intelligence.
1) Informed Strategic Decisions
As the first and most impactful of all benefits of analytics, we can make informed strategic decisions backed by factual information. Experts say that BI and data analytics make the decision-making process 5x times faster for businesses. Let's look at our first use case.
Renowned author Bernard Marr wrote an insightful article about Shell’s journey to become a fully data-driven company. Although the oil company has been producing massive amounts of data for a long time, with the rise of new cloud-based technologies and data becoming increasingly relevant in business contexts, they needed a way to manage their information at an enterprise level and keep up with the new skills in the data industry.
In order to do this, they first defined what data was the most relevant for the company. As Dan Jeavons, Data Science Manager at Shell, stated: “What we try to do is to think about minimal viable products that are going to have a significant business impact immediately and use that to inform the KPIs that really matter to the business”. With this information in hand, the company started thinking about how to invest in data quality standards, and the required technology to support it.
Skills were a big challenge for Shell. However, the company developed tailored training programs for its employees so that they could learn to use data to solve problems. Additionally, it invested in professionalizing the core work of data scientists for more complex operations.
Shell’s initiatives were successful because they implemented a data-driven culture in their entire organization. Empowering all levels of employees to use data for their decision-making process means extracting relevant insights at every level of the company. Undoubtedly, one of the big benefits of data analytics and professional self-service BI tools is the democratization of data.
2) Identify Trends and Patterns
As mentioned above, one of the great benefits of business intelligence and analytics is the ability to make informed, data-based decisions. This benefit goes hand in hand with the fact that analytics provide businesses with technologies to spot trends and patterns that will optimize resources and processes. Business intelligence and analytics allow users to know their businesses more deeply. Let’s see it with a real-world example.
The famous Boston Celtics basketball club hopped on the analytics bandwagon, too, so as to understand how their market evolves and also so as to evaluate their players.
Thanks to the data they collected on their customers, they have been able to analyze who they are, where they sit, and how much they pay. That is precious insight for the sales team, who can look into the data in real time and understand its leverages. It helped them quickly create promotions to sell more tickets and conduct revenue analyses based on these trends.
Moreover, visualizing their data helped them see how much revenue a given seat is producing during a season and compare the different areas of the stadium. Given that the Celtics have a very complex ticket pricing structure (over a hundred different prices depending on the package, section, individuals, students, competitive games, etc.), it is all the more important to understand at a glance which seat brings what, to make decisions on the fly for promotions.
A simple example is: If many low-cost seats are still available for an upcoming game, the sales team can send a customized email offer to local students.
The results?
Regular “five-figure” returns from promotions are based on analytics, according to Morey, senior VP of operations at the Boston Celtics. But it is just the beginning. After analyzing the fans’ seating plan, the sales team can redraw the lines for price breaks for the next season.
Of course, the purpose is to make more money, but it is not just for money’s sake. The money they get from these analytics will be reinvested in the players and their training, which means that players will get better, and so will the games.
3) Drive Performance And Revenue
Driving performance and revenue is one of the relevant benefits of business analytics for companies. McKinsey realized a business intelligence case study on a fast-food chain restaurant company with thousands of outlets worldwide. That company wanted to focus on its personnel and analyze deeper any data concerning its staff to understand what drives them and what they could do to improve business performance.
After exhausting most of its traditional methods, the company was looking for other ways to improve customer experience while tackling its high annual employee turnover, which was above the average of its competitors. The top management believed that tackling this turnover would be key to improving the customer experience and that this would lead to higher revenues.
To do so, the company started by defining the goals and finding a way to translate employees’ behaviors and experiences into data to model against actual outcomes. The goals were multiple: revenue growth, customer satisfaction, and speed of service. They then analyzed three areas: employee selection and onboarding, daily staff management, and employees’ behaviors and interactions in the restaurants.
The restaurant used the data collected to build regression and unsupervised learning models to determine the potential relationship between drivers and outcomes. They then started to test over a hundred hypotheses, many of which had been championed by senior managers who strongly believed in these methods after their experience. That was a powerful experience as it confronted senior managers with evidence against what they believed was true and practiced for years.
The results?
All the insights they gleaned challenged their beliefs and experience, but the results after implementing new measures, according to their findings, were indisputable: customer satisfaction scores had increased by more than 100% in four months, the speed of service improved by 30 seconds, attrition of new hires had decreased considerably, and sales went up by 5%.
4) Improve Operational Efficiency
Technology giant Microsoft was looking for a way to improve productivity and collaboration in the workplace. For this purpose, a senior researcher from the company conducted a study to understand the common problems faced by remote work on Microsoft. The findings showed that the main challenges included “communication in planned meetings, ad-hoc conversations, awareness of teammates and their work, and building trust relationships between teammates.”
These findings validated the theory that team members' awareness degrades with physical distance. The study even showed that employees who are situated in the same building but on different floors are less likely to collaborate. With this issue in mind, Microsoft came up with the idea of moving 1,200 people from 5 buildings to 4 to improve collaboration.
As a result of the relocation, the analytics team analyzed metadata attached to employee calendars and found a 46% decrease in meeting travel time, translating into estimated savings of $520,000 per year in employee time. As seen in the chart below, the team found out that “minutes saved for each employee equates to hundreds of thousands of dollars in cost-savings for an organization over time.”
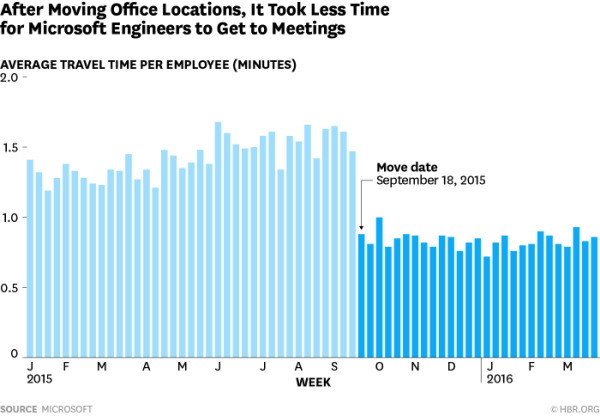
**Source: hbr.org**
The analysis also showed that the number of weekly meetings per person increased from 14 to 18. Overall, data analysis in this use case showed a significant increase in employee collaboration and operational efficiency for the company. Chantrelle Nielsen, director of research and strategy for Workplace Analytics, said, “Companies must take these metrics and direct them thoughtfully towards the design of office spaces that maximize face time over screen time.” This is a great way to illustrate the operational benefits of business intelligence.
5) Find Improvement Opportunities Through Predictions
The fifth benefit of implementing business intelligence and data analytics into your company is using predictive analytics. A great use case of this benefit is Uber. This company was originally founded in 2009 as a black car-hailing service in San Francisco. Although the service costed more money than a regular taxi ride, customers were attracted to the experience of ordering a car from their smartphones.
Now, you might be wondering how this small San Francisco start-up turned into the successful global company it is today. The answer is data analytics and business intelligence.
Uber has an algorithm that takes valuable data from every driver and passenger and uses it to predict supply and demand. The gathered data includes everything from customers’ waiting times, peak demand hours, traffic for each city, a driver’s speed during a trip, and much more. All this data is then used to set pricing fees, meet demand, and ensure an excellent service for both their drivers and clients. For example, by using prediction models, they can generate a heatmap to tell drivers where they should place themselves to take advantage of the best demand areas.
According to this case study on business analytics, one of the most interesting uses of data from Uber is its surge pricing method. The algorithm makes Uber more expensive during peak traffic hours, holidays, rainy days, etc. Uber has made this system using real-time predictions based on traffic patterns, supply, and demand. While this is a successful pricing system that other enterprises praise, the higher fares have brought the company a lot of backlash for trips that are twice as expensive. To avoid this issue, Uber has recently announced that they will use machine learning technologies to predict future demand and ensure that more drivers are redirected to the high-demand areas to avoid surge pricing and offer their clients a fair fee.
This is a clear example of the advantages of business analytics and how predictive analytics can help businesses spot improvement opportunities, optimize their processes, and ensure higher customer satisfaction levels.
6) Smart and Faster Reporting
Next, in our rundown of the top benefits of BI and analytics, we discuss data management and visualization. One of the powers of BI tools is that they open the door to a more efficient reporting process, which also makes data analytics accessible for everyone without the need for prior technical knowledge. Let’s put this into perspective with a success story from datapine.
Lieferando is a European online food-ordering service acquired by Just Eat Take Away in 2014. The brand, which operates mainly in Germany, the UK, and Sweden, has a clear mission of providing a fast and easy way for its 98 million customers to get food from their favorite restaurants. With millions of consumers and more than 580,000 partner restaurants within 25 countries, the company faced issues related to data management and access to massive amounts of enterprise-level information.
Their main challenges were combining different data sources in real-time in one central location, optimizing their marketing campaigns with data-based insights, and getting a comprehensive view of their entire customer lifecycle. Additionally, they needed a tool that allowed all employees in the company to deal with data without involving the IT department.
With the implementation of datapine's BI reporting tool into their system, the company was able to manage large amounts of data in real-time while significantly cutting the time they spent on report generation. This allowed for a faster decision-making process, streamlining of their marketing and sales activities, and the overall optimization of several processes at an internal and external level.
Team members at Lieferando said that “our new real-time dashboards allow us to monitor all major business operations through customized Key Performance Indicators. We can instantly act on changes and can now better adapt to new business challenges right when they occur, not weeks or even months later.”
7) Risk Mitigation
Businesses like to see risks coming a mile away, or at least in enough time to devise a defense strategy. That’s why companies are increasingly interested in applying BI to their risk mitigation efforts. Data can tell a number of compelling stories, including those that are on the brink of coming to life.
To better understand how it works, we can review a case study on business intelligence based on using BI in agricultural insurance. BI tools are essential for effective risk management, leveraging organizational data to minimize uncertainties and improve decision-making. They play a role in developing early warning systems, which are common tools in industries that regularly deal with crises.
Gaining a heads-up about potential risks was essential to the Iran Agricultural Insurance Fund, the only active insurance company in the country's agriculture sector. The fund aims to protect farmers and ranchers whose crops become damaged by pests, weather, drought, disease, and other disasters. It’s essential to understand the capacity of this fund, paid compensations each year, and the need to increase and improve existing agriculture insurance products based on risk, all of which can be solved with BI.
Model development involved creating a multidimensional online analytical processing (MOLAP) architecture using SQL server analysis services (SSAS) and BI tools. MOLAP for risk management identified financial risks and predicted trends in premium earnings and paid compensation, aiding decision-making for agricultural insurance branches. Predictive analyses based on historical data offered insights into future trends, enabling insurers to manage their risk management strategies proactively.
8) Enhanced Data Quality
Companies are increasingly dependent on their data and need to be able to trust that data in a moment of need rather than spending time fact-checking it. When you have good data, you can make good decisions that ultimately lead to good outcomes. The opposite is also true: when you have bad data, it can lead to a catastrophic series of events.
This was the unfortunate case for Unity Technologies, which experienced a data quality issue that cost them $110 million and a 37% drop in share price. The 3D content platform attempted to use its Audience Pinpoint tool to help game developers target and acquire players. However, after ingesting bad data from a large customer, the effectiveness of its tool eroded significantly. They targeted the wrong audiences because the machine learning algorithms were trained on inaccurate data, which yielded poor results.
CEO John Riccitello said the blunder cost them a combined $110 million in revenue losses, model rebuilding and retraining, and delayed launches of new revenue drivers. Investors also lost faith in the company, causing share prices to tumble.
It was an eye-opening experience for Unity, prompting them to focus more on data quality as the costs of not doing so became glaringly evident. A well-implemented BI system and software can ensure a level of data quality that will drive accurate and successful decision-making.
9) Increased Accountability
Data transparency can create a sense of belonging and ownership. Employees no longer work in the dark, pushing buttons and pulling levers to make things happen. With data, they can understand how their actions create subsequent events and the overall impact they make.
To see this in action, we look to Customer Alliance, a long-time datapine customer. The company provides a rating system for hotels to review and analyze customer data. By learning more about customers’ experiences, they can better attract website visitors and drive bookings. CEO Moritz Klussman said this visibility has made all the difference in their sales teams’ efforts.
They now have an easy way to provide management teams with access to all data and dashboards. They can filter to their level of interest and drill into reports for more details. Reviewing relevant customer data is faster, and data can be combined from multiple sources to generate new insights for the sales team. In Klussman’s words, it “has increased the number of closed deals significantly.”
10) Gain Essential Customer Insights
The more you know about your customers, the better you can adjust your messaging, products, and acquisition techniques to attract and retain them. Ideally, you can look at your existing customers to find common denominators: What industry are they in? How did they find you? How much are they spending with you? What do they buy from you? What makes them choose you vs. a competitor? What makes them stop doing business with you?
These are all essential questions with answers that directly impact your growth potential. To answer them, we can use BI to find patterns, trends, and other connections between data that would be too time-consuming or complex for humans to identify alone.
Deloitte shares this case study about how they helped a major media company develop a customer insights platform to turn data into business value. The organization knew it had valuable data but lacked an efficient way to utilize it. The company built a platform using Amazon Web Services to improve customer segmentation, predict churn, and quantify total customer value for millions of global subscribers. The platform aggregates data from disparate legacy systems and uses AI to analyze the data and develop insights.
The new models and dashboards accelerated growth by identifying customer trends. Improved segmenting led to hyper-targeted campaigns and better content delivery, increasing customer satisfaction. Clean and accessible customer data, coupled with AI utilization, enables the client to extract actionable insights and drive real business value—in this case, that value turned out to be worth millions of dollars.
Now that you understand the value that BI and analytics can bring to your organization, let’s examine some practical examples of how it would look in practice.
Experience the power of Business Intelligence with our 14-days free trial!
Business Intelligence and Analytics Benefits: Practical Examples
Business intelligence is key to monitoring business trends, detecting significant events, and, thanks to data, getting the full picture of what is happening inside your organization. It is important to optimize processes, increase operational efficiency, drive new revenue, and improve the company's decision-making.
We’re living in the most competitive business market in history. Technological advances and a global economy have created a pressure cooker of competition, with weaker companies being swallowed or broken down. Luckily, business intelligence tools have developed the necessary technology for companies to manage their data efficiently. BI dashboards like the ones presented below provide a centralized view of the most important metrics businesses need to stay ahead of their competitors. Not only that but getting a visual overview of the performance of several areas also empowers employees to use data for their decision-making process.
Let’s review a few examples of this:
1. Sales KPI Dashboard
With the essential sales dashboard at your fingertips, you can understand the current state of incoming funds and see whether you’re on target to meet company goals.
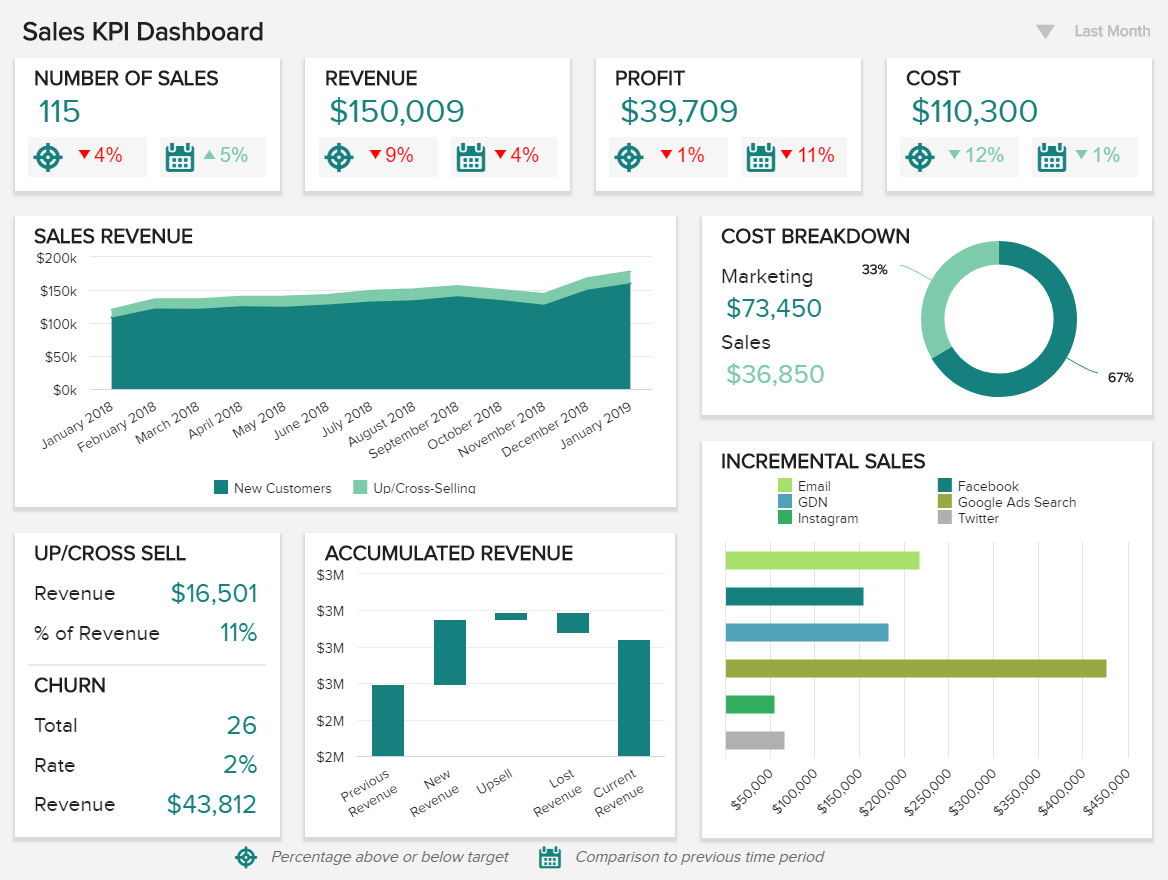
**click to enlarge**
Comparison data helps you see trends and patterns, allowing you to understand where to adjust to stay on track. For example, if customer churn suddenly spikes, you can start looking at other areas to figure out why and find creative ways to plug the holes. Having these insights at a glance is useful in mitigating risk, making informed decisions, and gaining essential customer insights that directly impact your top line.
2. Financial KPI Dashboard
Our financial dashboard answers your most pressing questions about invoicing, budgeting, and overall financial stability. Get a glimpse of your working capital, assets, and liabilities in a single snapshot to gauge your financial health at any given moment.
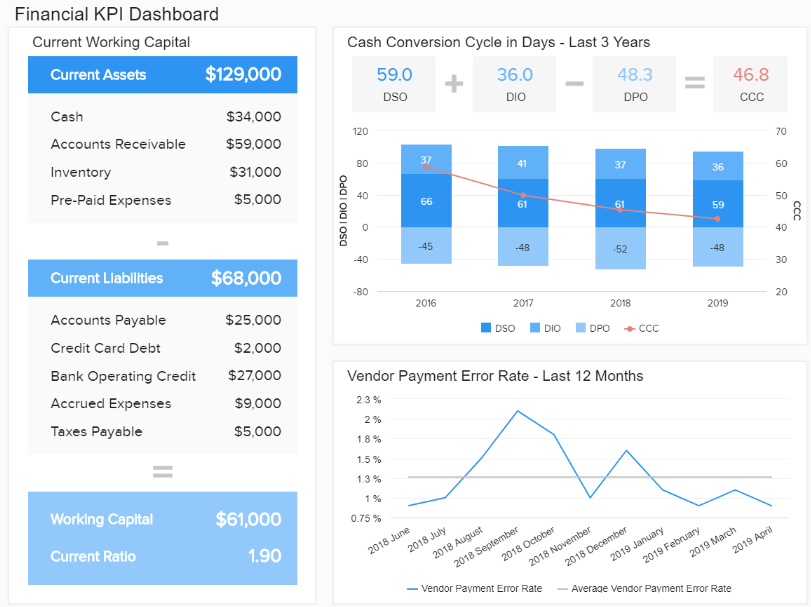
**click to enlarge**
Having these insights is a key piece of risk mitigation. For instance, if your cash conversion cycle is upward trending, your risk of running into a cash flow issue is higher. We can also see use cases for improving operational efficiency and accountability. Take the vendor payment error rate, for example. Things like duplicate payments, wrong addresses, and incorrect amounts can all affect vendor payment error rates, and these spikes may show where the accounts payable department can improve its processes.
3. Marketing KPI Dashboard
Lastly, we have a marketing dashboard, which ultimately ties back to your bottom line. Here we see some important figures showing us how marketing efforts are paying off, which can provide jumping-off points to dive deeper into other data.
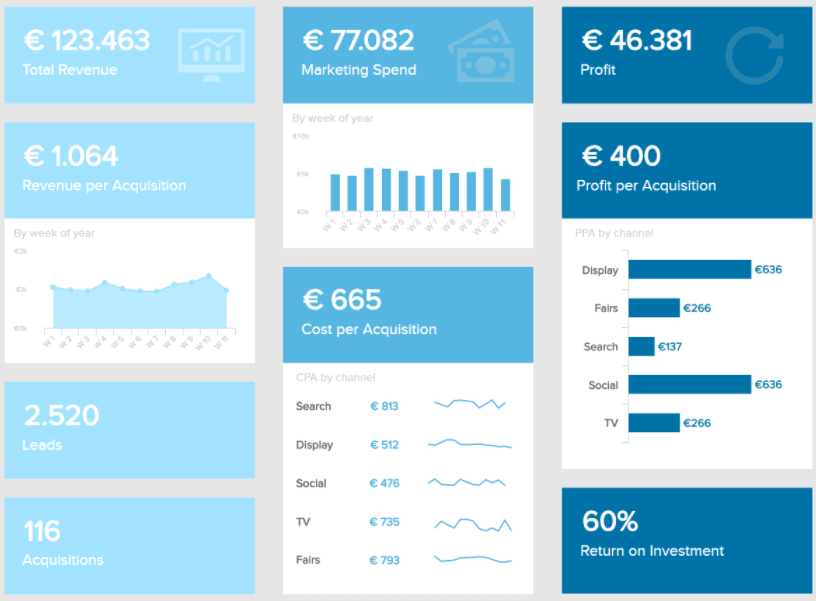
**click to enlarge**
Helpful use cases include strategic decision-making, increased accountability, and gaining essential customer information. Marketers can see how small tweaks and whole campaigns are acquiring customers and generating revenue and the most effective channels to reach customers.
Experience the power of Business Intelligence with our 14-days free trial!
BI Benefits: Final Thoughts
Given the current state of affairs, your company can’t afford not to use BI tools, especially after we examined ten business intelligence case studies that showed the incredible ROI possible from using them and the many benefits of business analytics. Such business intelligence ROI can come in many forms. You need to know what’s going on in the minds of your customers, who your next best customers will be, and how to serve them most effectively. These areas can be answered with data – which you need BI and analytics tools to process. However, be aware of any faux pas, and remember that there are some business intelligence best practices to know and some worst practices to avoid!
When your company has to rely on internal or external IT staff to generate data reports, it creates a huge barrier to what is most needed: a data-driven corporate culture where decisions are validated by clearly seeing reality.
If you’d like to take your first step towards using an intuitive self-service business analytics tool, try our 14-day free trial and test what datapine can do for you.