11 Examples Of Financial Reports You Can Use For Daily, Weekly & Monthly Reports

Table of Contents
1) What Is A Financial Report?
3) Annual Financial Report Example
4) Monthly Financial Reports Examples
5) Weekly Financial Report Templates
6) Daily Financial Report Examples
7) Why Do You Need Financial Reports?
Regardless of your sector or industry, it’s likely that your finances department is the beating heart of your entire operation. Without financial fluency, it’s difficult for an organization to thrive, which means that keeping your monetary affairs in order is essential.
As a business, you need the reliability of frequent business financial reports to gain a better grasp of the status of your finances, both current and future. In addition to empowering you to take a proactive approach concerning the management of your company’s economy, these tools help assist in increasing long-term profitability through short-term company financial statements.
A robust finance report communicates crucial accounting information that covers a specified period, such as daily, weekly, and monthly. These are powerful tools that you can apply to increase internal business performance. A data-driven finance report is also an effective means of remaining updated with any significant progress or changes in the status of your finances and helps you measure your results, cash flow, and overall profitability.
Here, we will look at these kinds of tools in greater detail, delving into daily, weekly, and annual reports but focusing mainly on monthly financial reports and examples you can use for creating your own, which we will present and explain later in the article alongside their relevance in today’s fast-paced, hyper-connected business world.
What Is A Financial Report?
A financial report or financial statement is a management tool used to communicate the performance of key financial activities efficiently. With the help of interactive KPIs, businesses can ensure steady growth and revenue while staying compliant with law and tax regulations.
As you can see in the example above, created with a professional financial business intelligence solution, a modern finance report can have all the relevant information right at your fingertips, offering the ability to visualize as well as analyze key data; they assist in uncovering fresh insights, spotting key financial trends, identifying strengths as well as weaknesses, and improving communication throughout the organization. We will explore even more examples of monthly statements later in the article.
We live in a data-driven age, and the ability to use financial insights and metrics to your advantage will set you apart from the pack. Online reporting tools to do that exist for that very purpose. To gain a panoramic view of your business’s financial activities, working with an annual, monthly, weekly, and daily financial report template will give you a well-rounded and comprehensive overview of every key area based on your specific aims, goals, and objectives.
Your organization needs these tools to help support certain objectives and enable you to provide useful information to investors, decision-makers, and creditors, especially if you work as a financial agency and need to create an interactive client dashboard. But not only, as it can also support your business in determining the following:
- If you can effectively generate cash and how that cash is used.
- To reveal specific business transaction details.
- To follow the results of your finances so you can identify potential issues that are impacting your profitability.
- Develop financial ratios that show the position of your business.
- Evaluate if your company can pay off all of your debts.
Daily reports, however, have a limited impact, as most of the financial KPIs that are used need mid-to-long-term monitoring and do not provide accurate information if analyzed only on a daily basis.
This is why we still mention them and provide examples of what can be tracked and analyzed every day, but for a long-term view, you should take a look at our annual, weekly, and monthly reports. The monthly ones are on top, illustrated with beautiful data visualizations that provide a better understanding of the metrics tracked.
Equipped with financial analytics software, you can easily produce these daily, weekly, monthly, and annual reports. They will provide your company with the insights it needs to remain profitable, meet objectives, evaluate your decision-making processes, and keep everyone in the value chain on track.
We offer a 14-day free trial. Benefit from great financial reports today!
Types Of Financial Reports
As stated above, finance statements are fundamental tools for businesses not only to track their performance and report to investors but also to stay compliant with law regulations that obligate them to respond to certain guidelines. That said, there are three major types, and we will cover them in detail below!
Balance Sheet
A balance sheet is a statement that provides detailed information about a company’s assets, liabilities, and equity. Or in other words, what a company owns, owes, and is invested by shareholders. Balance sheets should portray the bigger picture of a business's financial health during a particular date. There is no mandatory frequency to generate balance sheets; some organizations prepare monthly statements, while others can do quarterly or annual ones. Let’s see each of the elements in more detail below.
- Assets: The items your company owns that can provide future economic benefits. This can be from cash to furniture or equipment.
- Liabilities: It is basically what your company owes to others. They can be divided into long-term liabilities, such as the lease of your office building or a bank loan, or short-term liabilities, which can be your credit card debt or wages to employees.
- Equity: It represents the shareholder’s stake in the company. To calculate the shareholders’ equity, you need to subtract the total liabilities from the total assets. This calculation is based on the general accounting equation formula: Assets = Liabilities + Shareholders' Equity. Equity is used in many different ratios, such as ROA and ROE.
An important note regarding this type of statement is that it should always be balanced, hence the name. Your total assets should always equal the total liabilities and shareholder’s equity. If this is not the case, then there must be something wrong, and it needs to be looked into. Another consideration when it comes to balance sheets is always to compare them to other similar businesses, as they will vary depending on the industry.
Income Statement
As its name suggests, the income statement portrays the revenue generated from sales as well as all the operating expenses involved in generating that income. Essentially, how much you made and how much you spent. While a balance sheet provides a snapshot of a business's monetary health at a specific point in time, an income statement shows the profitability of a business over an accounting period (month, quarter, or year).
Also known as profit and loss, this is a fundamental document for any business as it not only tracks performance but it needs to be presented to the fiscal authorities to ensure compliance with law regulations. The income statement focuses on 4 key elements: revenue, expenses, gains, and losses.
- Revenues: The revenue can be divided into operating and non-operating. On one hand, the operating one includes all income related to primary activities such as selling a product or service. On the other hand, the non-operating one is related to non-core business activities such as income from interest earned on capital lying in the bank or rental income from the business property.
- Gains: Essentially, gains measure the money made from other activities that are non-business related and that are a one-time-only thing. For example: selling an old machine or unused land.
- Expenses: All costs related to core operations. Just like revenue, expenses can be divided into primary and secondary. Primary expenses are all the ones linked to the operating revenue, while secondary ones are linked to non-operating revenue.
- Losses: All expenses that cost the company to lose assets. They are unusual one-time costs, such as lawsuit expenses.
The bottom line of the income statement is the Net Income which is basically the profit of the observed period. The net income is calculated with the following formula: Net Income= (Revenue + Gains) - (Expenses + Losses)
Cash Flow Statement
Last but not least, the cash flow statement (CFS) portrays how much money entered and left the business during a particular time period. It basically measures how well the company manages to generate cash to pay debt obligations and cover operating expenses. While an income statement can tell you whether a company made a profit, the cash flow can tell you if it made cash. The CFS is a fundamental document for investors as it helps them understand the liquidity of a company and make informed investment decisions.
Usually, CFS is divided into three main sections: operating activities, investing activities, and financing activities. Let’s see them in more detail.
- Operating activities: This refers to any sources or uses of cash from regular business activities such as sales of goods and services, interest payments, salary for employees, and tax payments, just to name a few.
- Investing activities: This includes any sources or uses of cash from investments which can include purchases or sales of assets, loans made to vendors, and others.
- Financing activities: This includes sources or uses of cash from investors and banks, such as dividends, payments for stock repurchases, and loans.
Now that we have a better understanding of the definition and types, we are going to take a closer look at financial statements examples of daily, weekly, monthly, and annual reports and their associated KPIs. These examples will help your organization tick over the right way. Let's get started.
Annual Financial Report Example
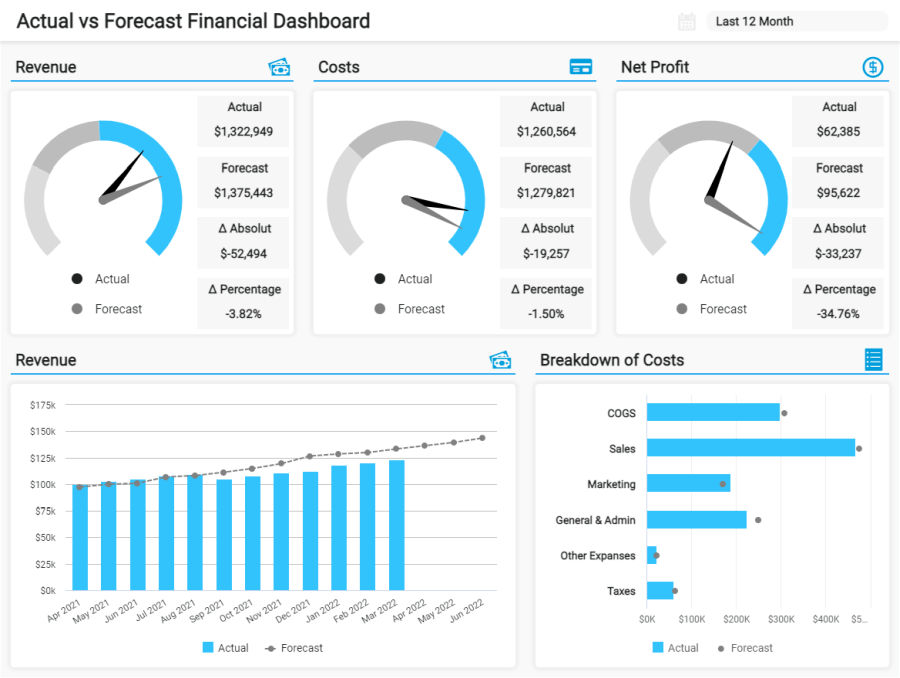
We are hitting things off with the annual financial report. As its name suggests, these statements monitor the performance of a business for the duration of a year. They can include anything from a balance sheet, income statement, and CFS, as well as predictions for the coming year. Now we will look at an example of an interactive annual dashboard in the shape of an income statement comparing the actual vs. forecasted performance of an organization.
**click to enlarge**
Financial forecasting is the process of using predictive analytics technologies to generate accurate predictions about future performance. This is done by analyzing a mix of historical and current data and finding patterns that can help organizations make better decisions.
Our template above, generated with a modern dashboard maker, does just that. It starts by providing detailed information about the three most important metrics in an income statement: revenue, costs, and net profit. Each of them is displayed on a gauge chart with the actual value compared to a forecasted value, paired with the absolute and percentage difference between the two values. This way, users can quickly identify when something is lacking in performance compared to what was expected from it.
The value of this high-level tool is the fact that it provides three months forecast based on the past 12 months performance. This allows managers to efficiently plan their strategies based on the expected costs and revenues. The dashboard also provides a breakdown of each of these metrics to analyze each element in detail. For instance, by looking at the past 6 months of the revenue breakdown chart, we can see that this business has not been reaching the forecasted amount, which means something might be going on that needs to be looked at. On the other hand, we can see that costs for marketing are slightly higher than expected, which can also be something to look into and see if these costs are justified.
Monthly Financial Reports Examples & Templates
Monthly financial reports are a management way of obtaining a concise overview of the previous month’s status to have up-to-date reporting of the cash management, profit, and loss statements while evaluating future plans and decisions moving forward.
These financial reporting examples offer a more panoramic view of an organization’s economic affairs, serving up elements of information covered in our daily and weekly explanations. By offering the ability to drill down into metrics over a four-week period, the data here is largely focused on creating bigger, more long-term changes, strategies, and initiatives.
These powerful documents offer detailed visual insights into the following areas:
- Cash management: A comprehensive overview of your organization’s liquidity and existing cash flow situation.
- Profit and loss: A critical glimpse into your company’s income statement and profits in a number of critical areas of the business.
- The bigger picture: A business financial report format offers a full overview of the company’s core financing activities over a monthly period, providing data geared towards developing sustainable strategies and improvements that will foster growth and increased profitability.
Coupled with the insights delivered by daily and weekly reports, monthly ones in the form of online dashboards are pivotal to not only gaining an edge on your competitors but also getting a predictive vision that will ensure you meet – and even exceed – your financial targets indefinitely. As a result, your overall efficiency will become flawless, and you’re likely to enjoy healthy growth in your year-on-year profits.
There is a wealth of KPIs to consider when looking at a monthly financial report sample. The best way to explain them in a practical context is by getting visual.
To help you understand how you can benefit from all of this, here are 5 monthly report examples, complete with explanatory insight and a deeper insight into their respective KPIs.
These interactive financial reports examples demonstrate the detail and insight you can gain from your online data analysis if you use it in the right way.
a) Cash Management Financial Report Template And KPIs
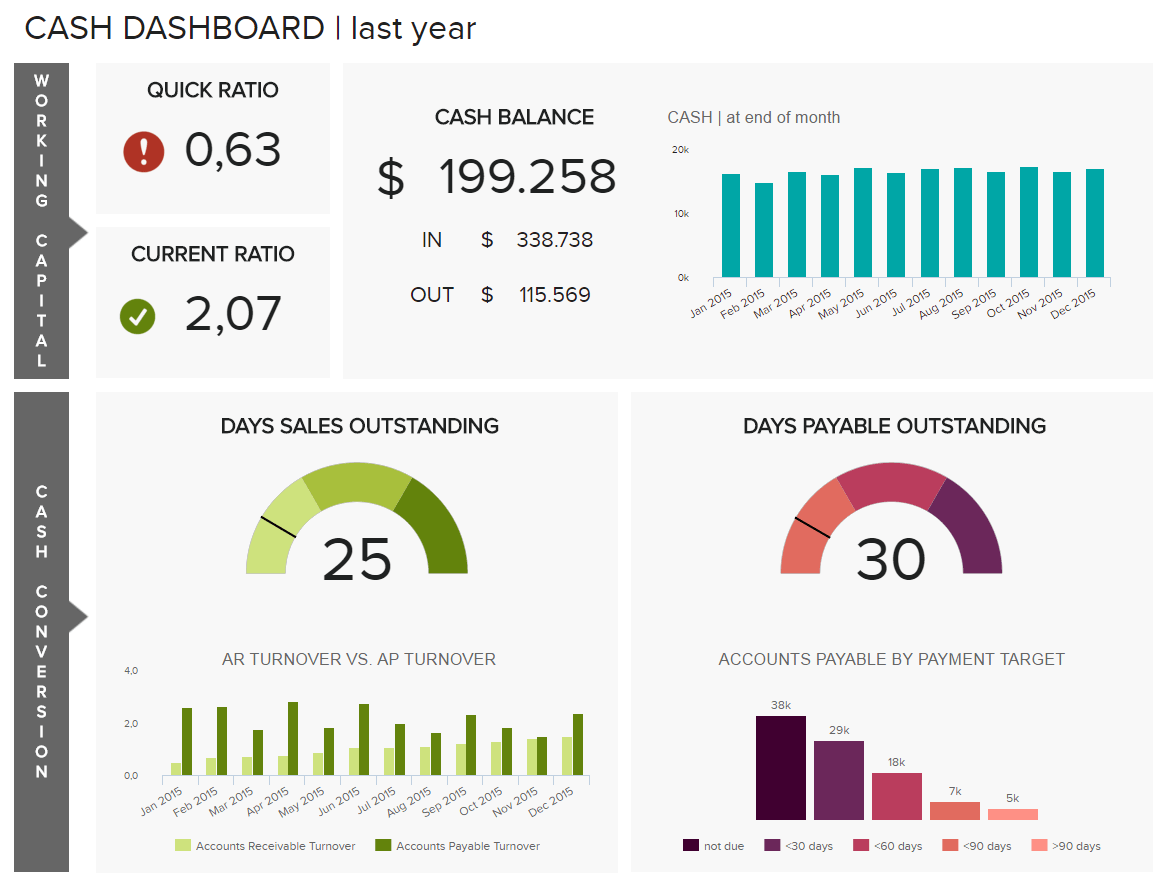
Our first example of a financial report provides you with a quick overview of your liquidity and current cash flow situation. Good management of cash flow is fundamental for success since a healthy cash flow means that the company has enough money to pay salaries and debts and invest in growth opportunities. However, bad management can lead to the end of a business since no cash means no operations. This example is critical to keeping your finances flowing across the organization and predicting future outcomes that will help you to stay always ahead of your finances.
**click to enlarge**
The first portion of this dashboard examines the current ratio, which is simply the ratio between your current assets and liabilities. This metric demonstrates the flexibility your company has in immediately using the money for acquisitions or to pay off debts. A really healthy current ratio would be about 2 to ensure your company will be able to pay current liabilities at any time and still have a buffer. Alongside this metric is the quick ratio, which is similar to the current ratio, except it takes into account only the near-cash assets, meaning all assets that you can convert into cash quickly, such as equipment or furniture. This means your quick ratio will always be lower than your current ratio. By monitoring these metrics, you can understand at a quick glance if your business is liquid or not.
Next, the cash management dashboard goes more in detail into the situation of a business with two financial graphs visualizing the current accounts payable and receivable for a year, this way you can stay on top of your expenditures and money to be collected and avoid having future issues that will affect your liquidity.
Current ratio: Core indication of a business’s short-term financial health, as well as indicating if you’re promptly collecting Accounts Due.
- This metric is measured by dividing debt and accounts payable by cash inventory and accounts receivables.
Quick ratio: As mentioned above, this metric only takes into account the short-term assets that you can turn into money within 90 days, like your accounts receivable. The higher the ratio, the healthier the liquidity of your business. Your goal should always be to keep your quick ratio at a minimum of 1,0.
Accounts payable turnover ratio: This shows how quickly your organization pays off suppliers and other bills. It also shows the number of times your company can pay off the average accounts payable balance during a certain time period.
- For example, if your company purchases 10 million goods in a year and holds an average account payable of 2 million, the ratio is 5.
- A higher ratio shows suppliers and creditors that your company is on top of paying its bills.
We offer a 14-day free trial. Benefit from great financial reports today!
b) Profit And Loss Financial Reports Examples And KPIs
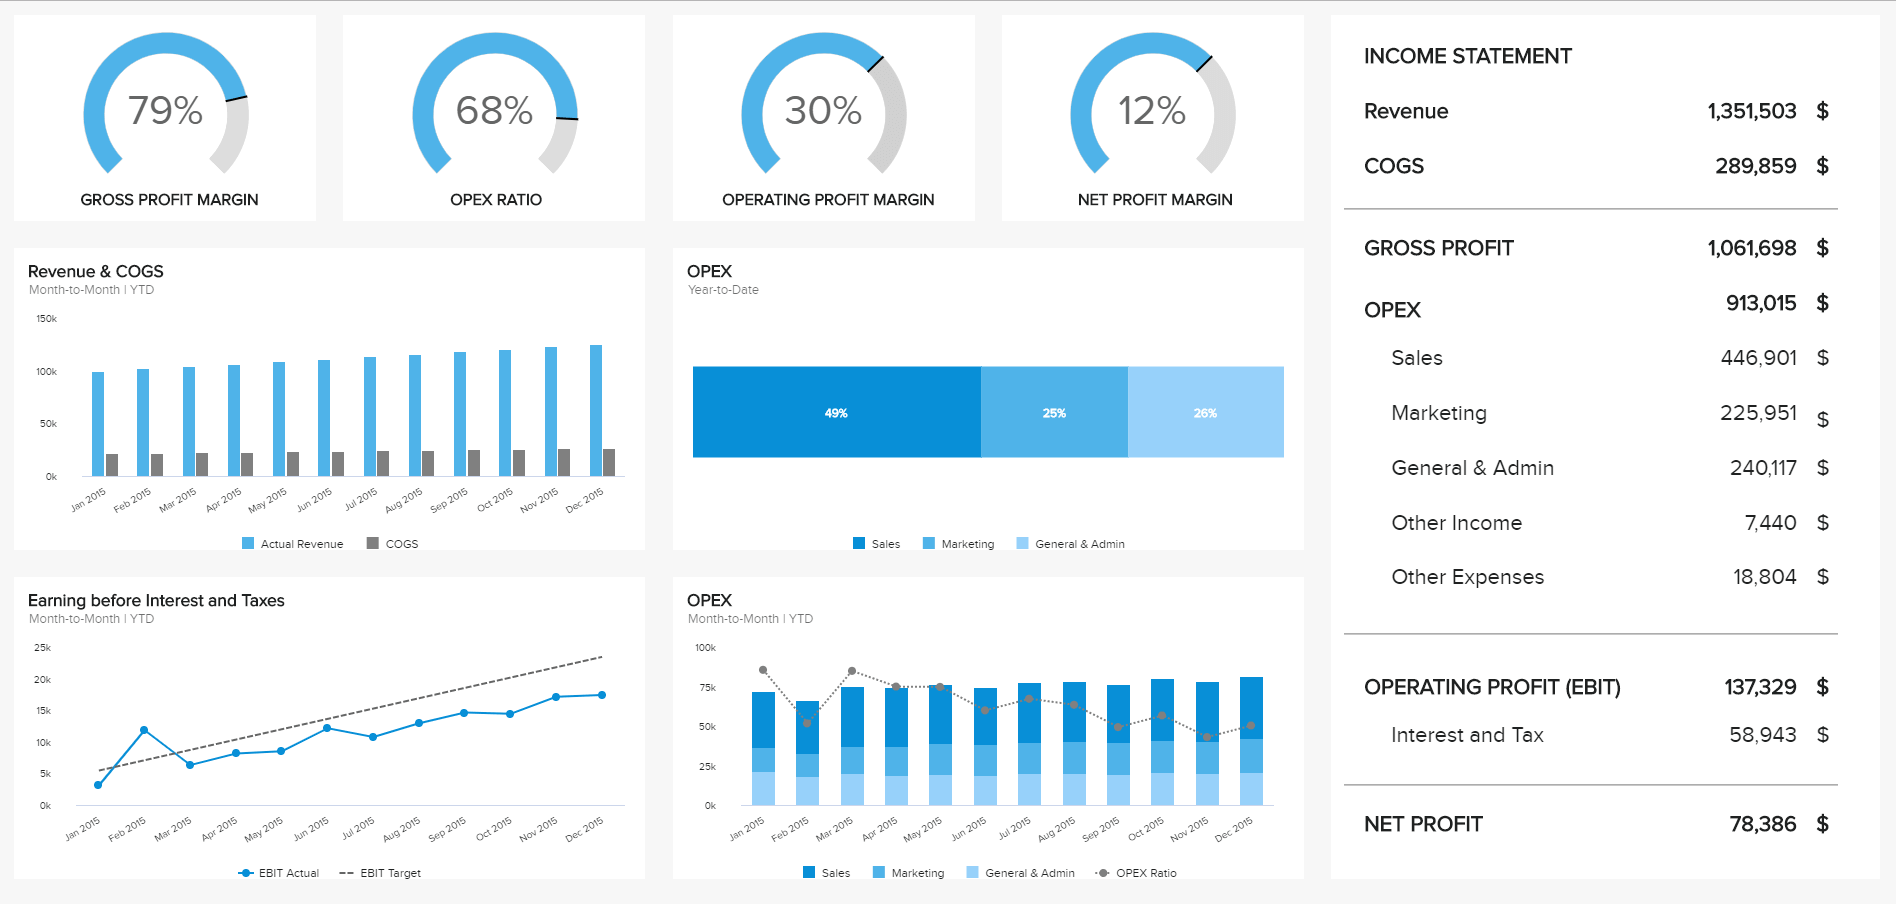
Moving on with our list of financial reporting templates, the P&L dashboard gives a clear overview of the income statement, from the income earned to the final net profit; the whole is enhanced by relevant performance ratios.
An income statement, also known as a P&L, is one of the most powerful examples as it gives you a detailed snapshot of your company's financial performance and tells you how profitable your business was in a specific period of time.
**click to enlarge**
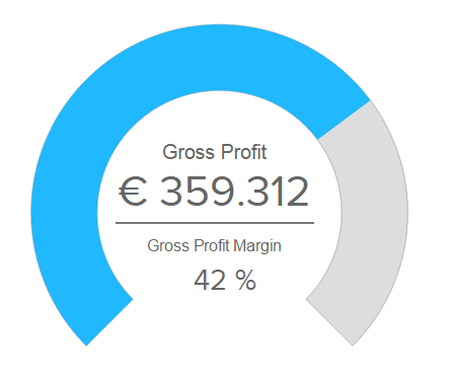
The dashboard above is a perfect example of a financial statement for P&L. First, we see the income statement that starts by calculating the gross profit, which is obtained by subtracting your total revenue from your COGS. Next, we have a list of operating expenses (OPEX) that include sales, marketing, and other general administration costs. The total OPEX is then subtracted from the gross profit to reach the operating profit (EBIT). Finally, the total amount of interest and taxes are subtracted from the EBIT, resulting in the final net profit of the business. By doing these simple calculations, you can quickly see how profitable your company is and if your costs and income are being managed properly.
Additionally, the dashboard provides a glance at performance percentages of the main metrics of the income statement: gross profit, OPEX, EBIT, and net profit. This can be further utilized to find month-to-month trends in your expenses and prepare ahead of time for months in which your expenses will be higher.
It is important to consider that an income statement will not tell you more detailed information about your finances, such as how much money your company has in total or how much debt you have. For this purpose, there is another type of document called a balance sheet, and we will see it in more detail in our next financial statement example.
Operating profit margin (EBIT): It allows your business to monitor how much profit you are generating for each dollar of income. This metric is also referred to as “EBIT” for “earnings before interest and tax.”
- This metric measures how profitable your business model is and shows what’s leftover of your revenue after paying for operational costs.
- It doesn’t include revenue earned from investments or the effects of taxes.
Operating expense ratio: This monthly example indicates the operational efficiency of your business through the comparison of operating expenses and your total revenue.
- Essentially the lower your operating expenses, the more profitable your organization is.
- These KPIs are particularly helpful in benchmarking your company against other businesses.
Net profit margin: Measures your business’s profit minus operating expenses, interest, and taxes divided by total revenue.
- It’s one of the most closely monitored financial KPIs. The higher the net profit margin, the better.
COGS: The Cost of Good Sold is the total amount of money it costs you to produce your product or service. If your COGS and your revenues are too close, that means you are not making a lot of gains on each sale.
- Separating COGS from operating expenses is a fundamental step, as it will tell you if you are overspending your revenues in operational processes.
c) Financial Performance Report Template And KPIs
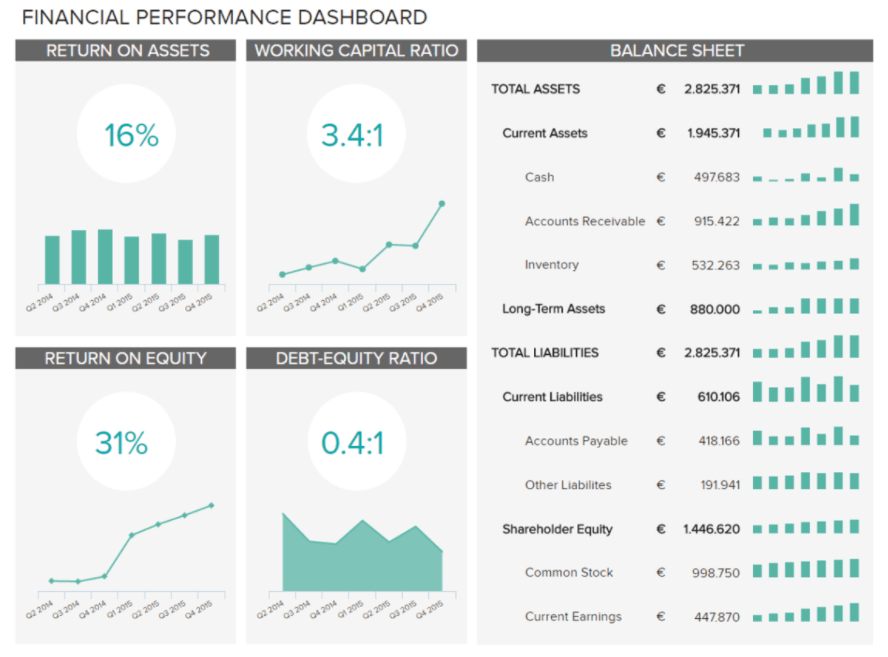
This particular financial statement template provides you with an overview of how efficiently you are spending your capital while providing a snapshot of the main metrics on your balance sheet.
Just like the income statement, a balance sheet is another powerful tool for understanding the performance of your business. As we see in the dashboard below, a balance sheet is divided into three main areas: assets, liabilities, and equity.
Alongside the balance sheet, the dashboard displays four other important metrics: the ROA, WCR, ROE, and DER. These four KPIs give you an immediate picture of trends in how your company’s assets are being managed. Good management of your assets and healthy equity will bring new investors to your business and will prevent you from facing disasters for unexpected losses, or bankruptcy.
**click to enlarge**
Return on assets (ROA): This shows how profitable your businesses are compared to your total assets. Assets include both debt and equity.
- This is a critical metric to any potential investors because it shows them how efficiently management is using assets to generate earnings.
Return on equity (ROE): Calculates the profit your company generates for your shareholders. It is used to compare profitability amongst businesses in the same industry.
- This is measured by dividing your business’s net income by your shareholder's equity.
Debt equity ratio (DEB): This metric measures how much debt you are using to finance your assets and operations in comparison to the equity available. It is obtained by dividing the total liabilities by the stakeholder’s equity.
d) Financial KPI Dashboard And KPIs
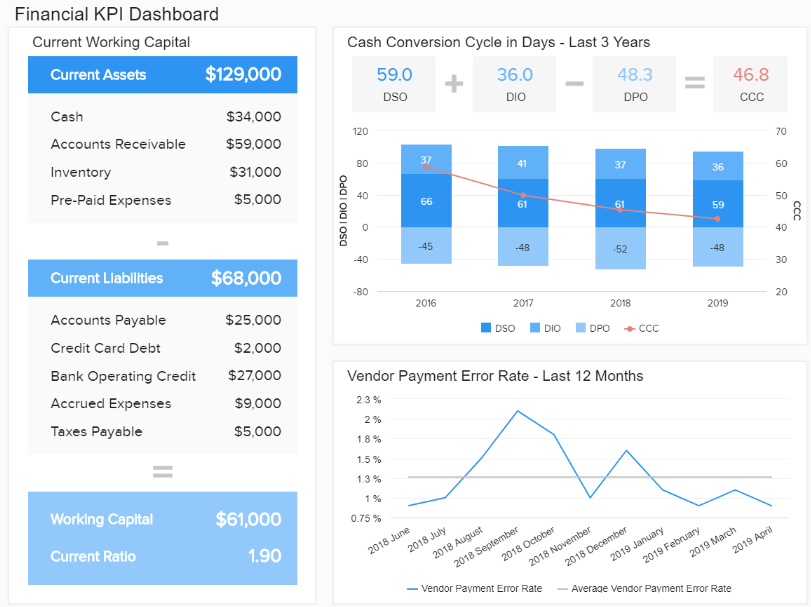
This financial report format created with a professional dashboard designer offers a broad overview of your business’s most critical economic activities, operating with KPIs that are developed specifically to answer vital questions on areas such as liquidity, invoicing, budgeting, and general accounting stability. A template that you can apply to almost every business across industries, this incredibly insightful tool is pivotal to maintaining a healthy, continually evolving financial profile. Let’s look at the KPIs linked to this most valuable example.
**click to enlarge**
Working capital: A key performance indicator focused on financial stability, this metric will help you monitor your performance based on your company's assets and liabilities.
- In the context of this financial report format, working capital is vital as it will help you accurately gauge your business’s operational efficiency and short-term health.
Quick ratio/acid test: A KPI that offers instant insights as well as results, this metric serves up critical information concerning liquidity.
- The quick ratio/acid test is worth tracking – by measuring these particular metrics, you’ll be able to understand whether your company is scalable and, if not – which measures you need to take to foster growth.
Cash conversion cycle: Your cash conversion cycle (CCC) is a critical metric for any organization as it drills down into key areas of your company’s operational and managerial processes.
- Tracking your CCC with visual BI reporting tools is incredibly useful as it provides a quantifiable means of knowing the length of time it takes for your business to convert its inventory investments, in addition to other resources, into cash flows from sales.
- A steady, consistent CCC is generally a good sign, and if you spot noticeable fluctuations, you should conduct further analysis to identify the root of the issue.
Vendor payment error rate: Every business – including yours – works with third-party vendors or partners, and managing these relationships as efficiently as possible is critical to any organization’s ongoing financial health. That’s where the vendor payment error rate KPI comes in.
- By gaining an insight into potential errors or efficiencies relating to the payment of your vendors, you’ll be able to improve financial flow and efficiency while nurturing your most valuable professional relationships.
- If your vendor error rate is high, you will know that procurement inefficiencies exist, and you’ll be able to take appropriate action to improve your processes and avoid potential disputes.
Budget variance: Budgeting is one of the cornerstones of corporate financial health. This powerful KPI from this most critical financial report sample serves to express the difference between budgeted and genuine figures for a particular accounting category.
- Offering a quick-glance visualization of whether particular budgets are on track in specific areas and departments, this KPI allows you to get a grasp of variances between proposed and actual figures while obtaining the information required to make vital changes in the appropriate areas.
- Keeping your budget expectations and proposals as accurate and realistic as possible is critical to your company’s growth, which makes this metric an essential part of any business’s reporting toolkit.
e) Financial Statement Example For CFOs
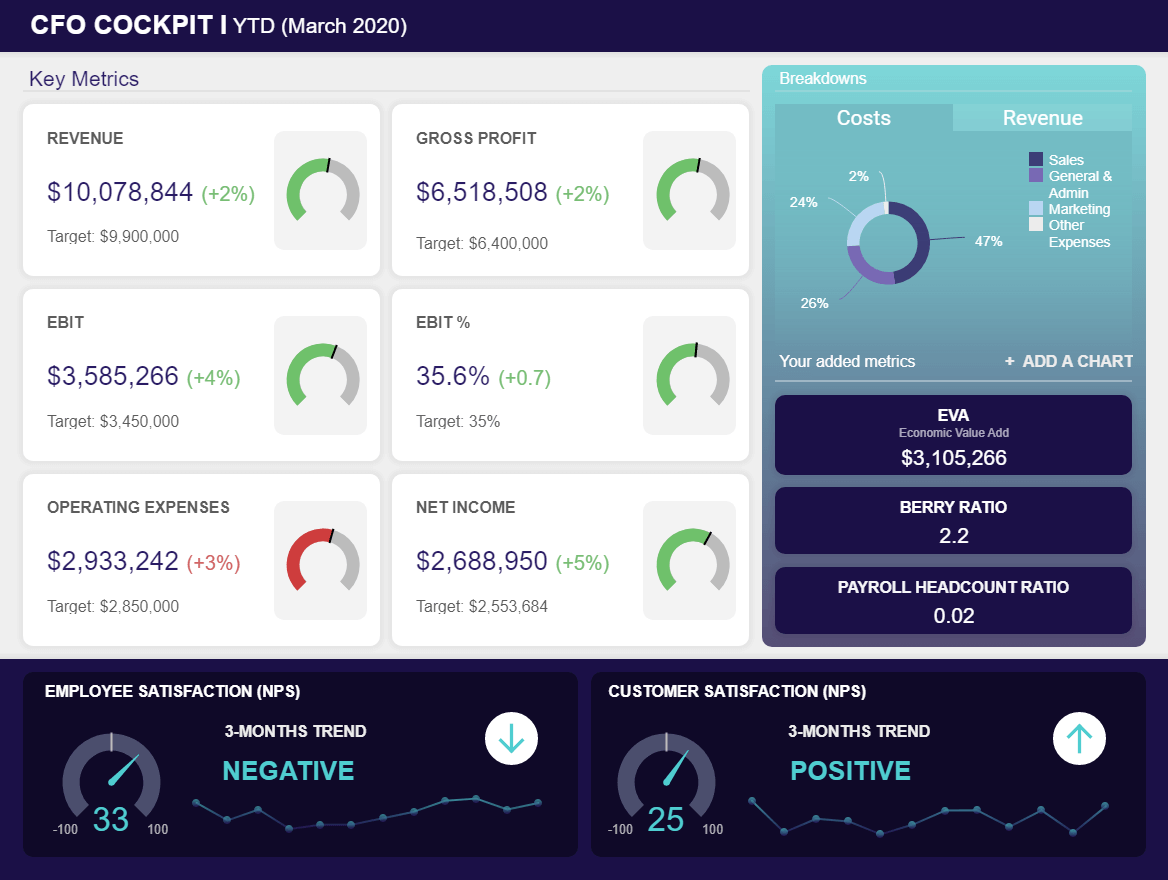
Next, we look into a financial performance report focused on data relevant for CFOs that need to grasp high-level metrics such as revenue, gross profit, operating expenses, net income, berry ratio, EVA, payroll headcount ratio, and, finally, to build a strong team and customer base, satisfaction levels of each. This financial management report example will not only serve as a roadmap for depicting the monetary health of a company but also focus on team management and customer satisfaction, which are not traditional finance-related metrics but are important in this case for every modern CFO. This example shows the YTD until March, but it can also be used as one of our monthly financial statements examples. We will explain the KPIs in more detail below:
**click to enlarge**
Berry ratio: This ratio is defined between gross profit and operating expenses (costs). This financial indicator is critical when showing if the company is generating a healthy amount of profit or losing money.
- When calculating the berry ratio, usually external income and interest aren't included, but depreciation and amortization could be, depending on the particularities of your strategy.
- An indicator over 1 means that the company is making a profit above all expenses, while a coefficient below 1 will indicate that the company is losing money.
Economic value added (EVA): Referred to as the economic profit of a company, EVA is a critical element to include in any finance report template as it will show the surplus profit over the WACC (weighted average cost of capital) demanded by the capital market.
- By gaining insights into the potential surplus and how profitable a company's projects are, the management performance can be reflected better. Moreover, it will reflect the idea that the business is profitable only when it starts to create wealth for its shareholders.
- Succinctly speaking, the financial statement should include EVA as it will show how much and from where a company is creating wealth.
Cost breakdown: This particular metric is extremely important in any finance department since costs are one of the financial pillars of an organization, no matter how large or small. Every organization needs to know where the costs are coming from in order to reduce them and, consequently, positively affect performance.
- If you see that most costs come from administrational activities, you should consider automating tasks as much as possible. By utilizing self service analytics tools, each professional in your team will be equipped to explore and generate insights on their own without burdening other departments and saving countless working hours.
- Generally, costs should not be looked upon purely on the basis of black and white. If sales and marketing cause cost increment, maybe they also deliver high volumes of income so the balance is healthy and not negative.
Satisfaction levels: C-level managers need to prepare financial analysis reports with satisfaction levels in mind. These indicators are not purely financial, but they do influence economics and can cause potential bottlenecks.
- If the financial team has a lower satisfaction level, you need to react fast in order to avoid potential talent loss that can cause the company serious money. Keeping the team satisfied by conducting regular feedback talks, and offering career progression and competitive salaries, for example, can only affect the business in positive ways since the motivation will rise as well as the quality of the working environment. In this case, you can also connect to an HR dashboard and follow the team's performance and satisfaction levels in more detail.
- If customers are unsatisfied, it can also cause damages from outside your team that can, consequently, influence financial performance. For this reason, customer service analytics should also be an important aspect to be covered in your CFO report.
The above example of financial statement is not only focused on pure numbers, as you can see, but also on the human aspect of team and customer management that every modern CFO needs to take into account in order to benefit strategies and deliver economic growth.
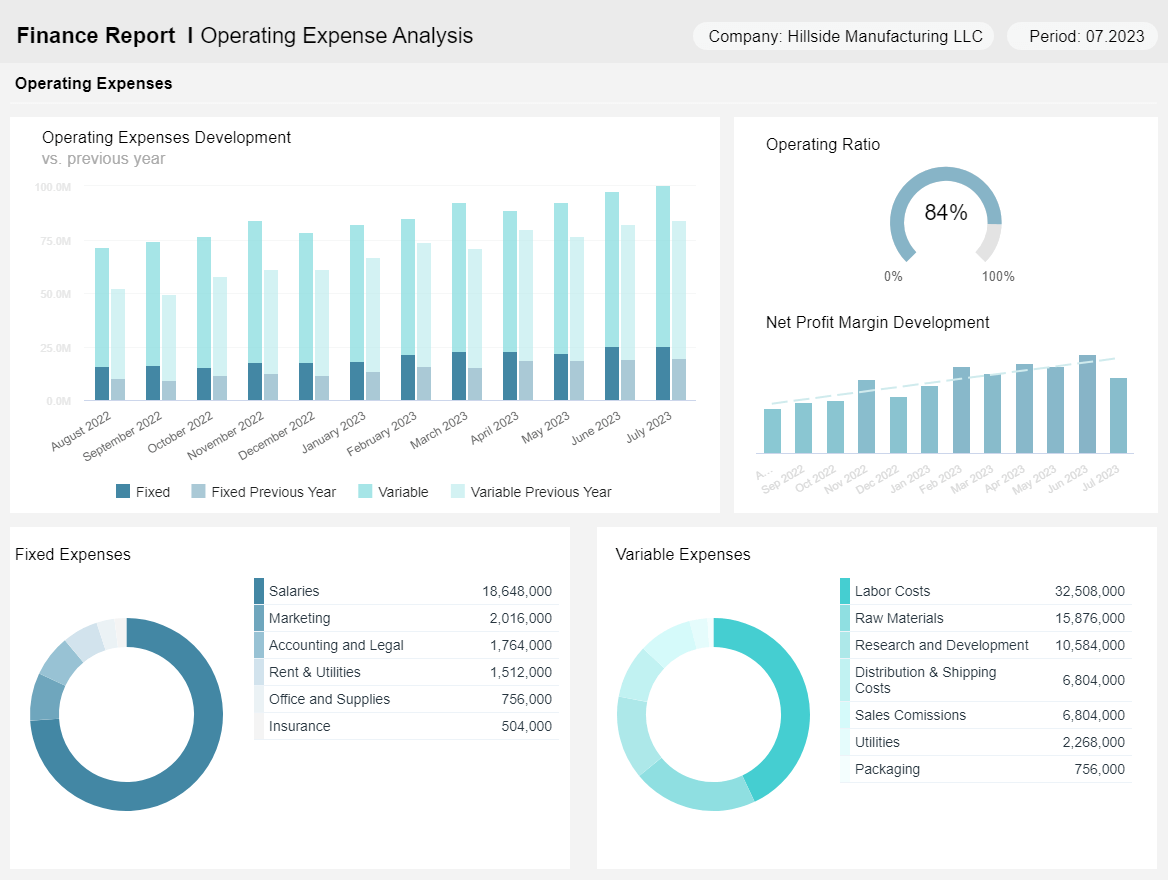
f) Financial Report Template For Operating Expenses
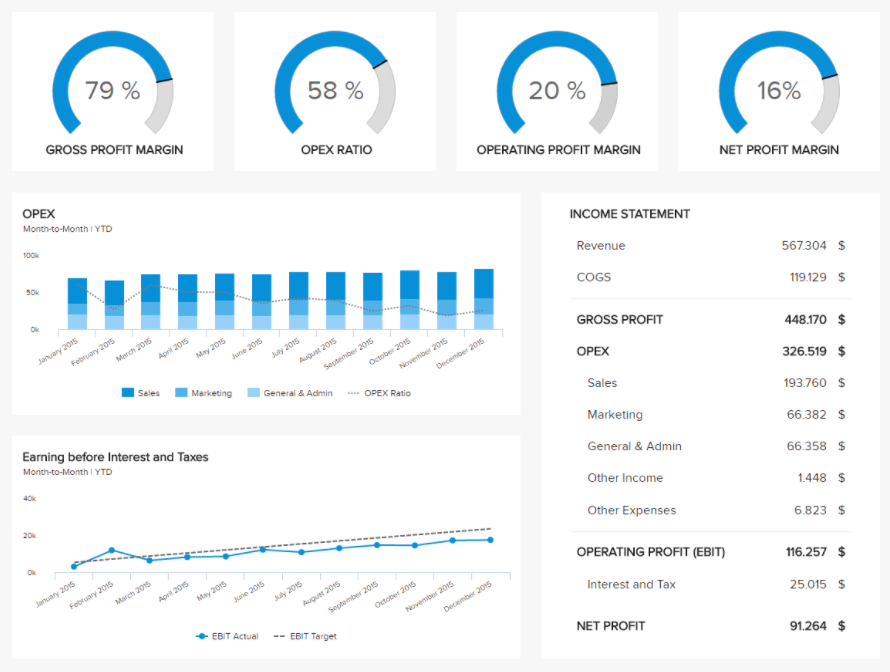
Last but not least, on our list of monthly financial statement examples, we have a template that focuses entirely on operating expenses analysis. Operating expenses also referred to as OpEx, are all expenses that companies incur through their day-to-day operations. Such as rent, equipment, inventory, salaries, insurance, materials, marketing, sales, and much more, depending on the industry. It is fundamental for businesses to track their OpEx closely and regularly as they directly affect profitability. An organization that manages to keep its OpEx at a minimum while still maintaining profitability and efficiency stands to gain a massive competitive advantage.
Our example below will help you do just that by providing a complete overview of the development of your OpEx on a month-to-month basis. Let’s explore it in detail below.
**click to enlarge**
The value of this template lies in its level of detail. Traditional income statements track all OpEx together without differentiating between fixed and variable ones. Making it harder to extract deeper conclusions from the data. Our OpEx report above differentiates fixed and variable expenses and shows the monthly development of both compared to the performance of the previous year. This way, users can extract valuable conclusions to improve their strategies and overall financial performance. For instance, by looking at the OpEx development chart on the top, we can see that, overall, both fixed and variable expenses are higher compared to the benchmark. This can be because the company is producing more goods and services, which would result in higher costs or something else that needs to be looked into in more detail.
To do so, you can take a look at the operating ratio and net profit margin development chart. These are the success indicators that will help you understand if your cost-optimization strategies are paying off. There, we can observe a positive development in previous months with a decrease in the last observed period. Again, this could either be expected or something to be alarmed. It is important to take a deeper look into the data to ensure no big insights remain untapped.
If you are still feeling a bit lost about the KPIs shown in this example, let’s talk about them in detail below.
- Variable expenses: These are costs that are directly related to a business’s production levels. Meaning they can increase or decrease regularly, hence, the name variable. They include costs such as raw materials, labor costs, distribution and shipping, packaging, and sales commissions, among others. It is important to note that variable expenses can not be compared to any other company as they vary from industry to industry.
- Fixed expenses: As its name suggests, these are all expenses that need to be mandatorily paid every month, quarter, or year. They are not subjected to the production level but more to the functioning of the business. These include salaries, insurance, rent, and taxes, just to name a few.
- Operating ratio: This KPI shows your operating expenses as a percentage of the total revenue. It shows the ability of an organization to keep costs low while generating revenue. This means the lower the ratio, the more profitable the organization is.
Weekly Financial Report Templates And KPIs
A weekly financial statement serves to help you monitor all your short-term financial activities in weekly increments. It should be created and reviewed each week and provides a comprehensive look at the short-term performance of your business.
Now we will take a look at some financial statements examples to get a clearer picture of what can be tracked in weekly intervals.
a) Operating Cash Receipts, Disbursements, Balance
Part of a business’s budgeting process may include cash receipts and disbursements, which use actual data for cash collection to design a budget or create income statements, for example. A sample financial report on a weekly basis can help companies gain insights from accurate reporting based on using cash receipts and disbursements. Metrics and KPIs can include:
Cash flow: indicates the changes in cash versus its fixed counterparts, such as exactly where cash is used or generated during the week.
- Operating activities: measures a business’s operating cash movements, whereby the net sum of operating cash flow is generated.
- Financing activities: tracks cash level changes from payments of interest and dividends or internal stock purchases.
- Investing activities: tracks cash changes derived from the sale or purchase of long-term investments, like property, for example.
Operating activities: indicated any activities within a business that affect cash flows, such as total sales of products within a weekly period, employee payments, or supplier payments.
- Direct method: This metric obtains data from cash receipts and cash disbursements related to operating activities. The sum of the two values = the operating cash flow (OCF).
- Indirect method: This metric uses the net income and adjusts items that were used to calculate the net income without impacting cash flow, therefore converting it to OCF.
Gross profit margin: This enables your business to measure and track the total revenue minus the cost of goods sold, divided by your total sales revenue.
- This KPI is a crucial measurement of production efficiency within your organization. Costs may include the price of labor and materials but exclude distribution and rent expenses.
- For example, if your gross profit margin were 30% last year, you would keep 30 cents out of every dollar earned and apply it towards administration, marketing, and other expenses. On a weekly basis, it makes sense to track this KPI in order to keep an eye on the development of your earnings, especially if you run short promotions to increase the number of purchases. Here is a visual example:
b) Any Generated Current Receivables
Weekly financial reports can help businesses stay on top of invoicing, billing procedures, cash basis of accounting, and accounting records, and ensure that they don’t fall behind on being paid for services and goods that are owed to them by customers or suppliers. Weekly report metrics and KPIs include:
- Days sales outstanding (DSO): This measures how fast your business collects money that you’re owed following a completed sale.
DSO = (Accounts receivable/total credit sales) x number of days in the period. - DSO vs. best possible DSO: Aligning these two numbers indicates the collection of debts in a timely fashion.
Best possible days sales outstanding = (Current receivables x number of days in a week) / weekly credit sales. - Average days delinquent: Indicates how efficient your business processes are in your ability to collect receivables on time.
ADD= Days sales outstanding – Best possible days sales outstanding
Top Daily Financial Report Examples And KPIs
A daily financial report is a method to track the previous day’s activities that have an impact on your accounting status but are not necessarily a strict financial metric. It can keep you apprised of all the requisite data management used to track and measure potential errors, internal production, revenue loss, and receivables' status.
As we mentioned above, these ones provide a limited vision, but you can use the examples below to see how some daily actions on problematic factors can impact your final results.
a) Tracking Potential Staff Errors
Maintaining an efficient, productive work environment and ensuring that you can identify any employee discrepancies or issues is critical to being proactive about business growth. Monitoring employees working hours and productivity levels can help you detect potential staff errors quickly, control these errors, and avoid negative impacts on your financial results at the end of the day and, ultimately, the month.
Real-time management live dashboards offer clear visuals regarding employee management processes with the following metrics and KPIs:
Organizational performance: These are key metrics for tracking and evaluating some factors impacting your performance.
- Employee overtime: overtime per employee = total overtime hours / FTE
- Absenteeism: Number of employees absent today
Work quality: These metrics help companies determine the quality level of their employees’ work performance.
- Amount of errors
- Product defects
Work quantity: These metrics indicate employee performance related to quantity, such as sales figures or the number of codes a programmer can create in a given amount of time. Quantity does not, of course, mean quality, but on monitored daily, it can reveal bottlenecks or under-production problems.
- Sales numbers: the number of client contacts, the number of calls an employee makes, and the amount of active sales leads.
- Units produced: lines produced during coding, number of keys a nurse receptionist can hit per minute, etc.
- Customer handling time: how many customer calls are answered during a specific time period, for example.
b) Measure Revenue Loss & Receivables
By tracking staff errors, you can track the money it costs your company (having a problem in production, finding the problem, and fixing it), which will inevitably end up in your financial statements as the money you lost. Tracking revenue loss can be especially beneficial for those companies with customer accounts or recurring income. A daily record helps businesses quickly monitor revenue-related factors so that they can increase their earnings. Revenue loss can also originate from one-time purchases, customers who move to your competitor, or customers who move out of the area. Metrics used to measure these factors can include:
Accounts receivable turnover ratio: This measures the number of times that your business is able to collect average accounts receivable and indicates your effectiveness in extending credits. Here is a visual example:
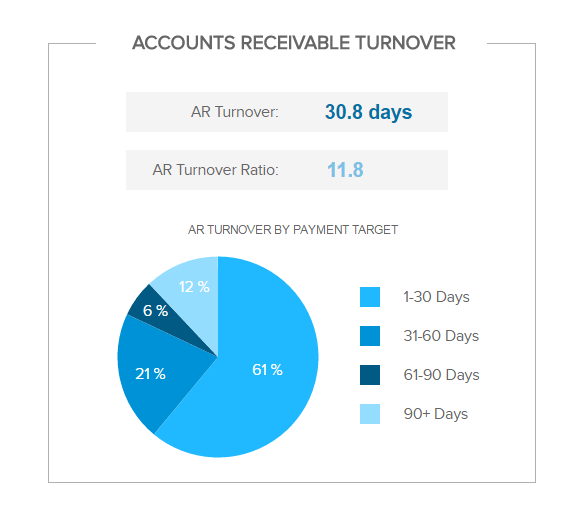
- A low accounts receivable turnover ratio basically indicates that you might need to revise your business's credit policies to collect payments more quickly.
Additional metrics you can monitor on a shorter time frame, such as daily, are as follows:
- Number of daily transactions
- Average gross margin
- The average cost per order
You can also be more specific about your revenue loss: categorizing where you lost what a good practice to identify which parts of your business management reporting practices have important room for improvement is. Tracking metrics like the top 10 products generating the most revenue or, on the contrary, the top 10 products generating the worse revenue will tell you a story about what needs more attention.
The revenue loss can also come from discounts or sales, for example. Monitoring on a daily basis which promotions are getting “too” popular can help you stop it before it generates more revenue loss than revenue growth that was supposed to create.
A daily, weekly, and monthly record help communicate the ongoing narrative of your company's economic processes, strategies, initiatives, and progress. As you can see, this form of an analytical report in the finance industry is an undeniably potent tool for ensuring your company’s internal as well as external financial activities are fluent, buoyant, and ever-evolving.
We offer a 14-day free trial. Benefit from great financial reports today!
Why Do You Need Financial Reports?
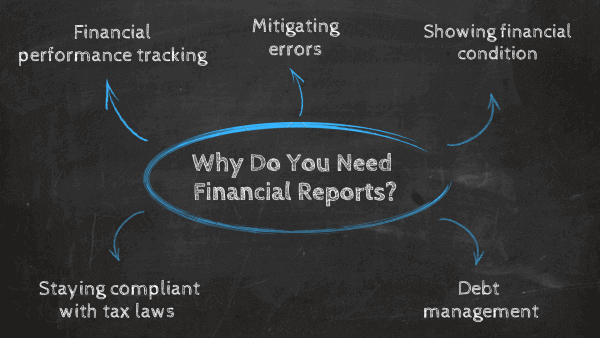
We saw some powerful financial statement templates to empower your business, but before finishing our journey through these tools, we are going to show you some of the main ways in which your business could benefit from them. As we mentioned a few times through this article, interactive reports created with professional business analytics tools offer a clear snapshot of your business’s financial health, and they will give you the answers you need to plan strategies and tackle any issues that might arise with your finances. Here are the top 5 benefits.
- Performance tracking: If you are a loyal reader of this blog, then you know the importance of relying on data for business success. By using modern financial performance reports, CFOs, and other relevant stakeholders can have a quick and accurate snapshot of all areas of a business. This will help them make more informed decision-making as well as plan strategies and forecast future results to find growth opportunities.
- Mitigating errors: When we are talking about finances, every detail counts. Using inaccurate statements can not only damage your business’s profitability but can also expose it to legal issues if any discrepancies are found in your numbers. Many BI finance tools in the market ensure accurate reporting with the latest data available. This way, you will be able to constantly monitor the performance of your finances in every area and mitigate any errors before they become bigger issues.
- Showing financial condition to investors and stakeholders: If you have investors or you are looking for potential ones to expand your business, then a report showing a snapshot of your business performance will be a fundamental tool. On one hand, it will help you show your investors where their money went and where it is now, and on the other, it will show potential new investors or other relevant stakeholders that your business is worth their money.
- Debt Management: As we mentioned in one of our examples of financial statements, wrong debt management can damage a business to the point of no return. Investing in innovative BI solutions to generate professional statements that contain a detailed balance sheet of your assets and liabilities can help you understand your liquidity and manage your debts accordingly.
- Staying compliant with tax laws: Last but not least, one of the most important benefits of using finances reporting is to stay compliant with the law. No matter the size of your company, you have to pay taxes, and tax agents will use your financial documents to make sure you are paying your fair amount. By keeping track of this information in a professional financial status document, you will be able to reduce your tax burden and avoid any discrepancies in your numbers.
Common Challenges Of Financial Statements
While these tools are fundamental to the growth and correct functioning of any type of organization that profits, it is still a hard process that has limitations. Being aware of the challenges coming your way can help you tackle them and be prepared to generate accurate financial statements. Let’s look at some of these limitations.
- Manual work: Manual tasks are the enemy of a successful reporting process. Especially with finances, where you need to make important decisions all the time, the need for real-time reporting is critical. However, there are still many companies that build their statements manually, which means by the time it is ready, the data is no longer useful. With that issue in mind, several automated reporting tools have emerged to help mitigate the manual tasks and dedicate more time to actually analyzing.
- Manage various data sources: Data quality is the basis of a successful reporting process. When it comes to generating finance reports, it is necessary to gather data from various sources, which can be a tedious job. The issue becomes even bigger when you want to process and unify all of this information for analysis. Luckily, modern management reporting tools allow you to connect various data sources and visualize them all together in interactive dashboards with just a few clicks.
- Data literacy: Data literacy refers to the ability to understand, communicate and work with data. It represents a challenge for any reporting process, but especially when it comes to finances, as the numbers and concepts are more complex. To prevent literacy levels from becoming a bigger issue, it is recommended to assess the level of knowledge across employees and departments and provide financial and data-related training for anyone who needs it. This way, you’ll ensure everyone is on the same page and has the ability to integrate analytical practices into their daily operations.
- Accessibility and collaboration: It is very likely that an organization’s financial goals will be linked across departments and teams. Achieving these goals successfully requires a level of collaboration that is harder to achieve, especially when it comes to sharing reports and building discussions around them. If these documents are not properly shared, it is very possible that discrepancies will be found in the strategies, and that can damage the end goal. To avoid this, organizations need to rely on analytical tools with an online environment that allows them to easily share relevant information among different stakeholders in a fast and efficient way.
- Adapt to regulatory changes: Paired with the challenges coming with the data management process, there are also regulatory changes that happen all the time, and that can present a challenge for organizations. Businesses need to ensure their financial reports are rigorously complying with regulations as well as be flexible and responsive to any new changes that might arise.
- Security: With cyberattacks and data breaches becoming an increasing concern for businesses, keeping financial data secure becomes a major challenge for organizations. To prevent your information from ending up in the wrong hands, it is necessary to implement various security measures such as access controls, password-protected reports, and other things.
How To Make A Financial Report?
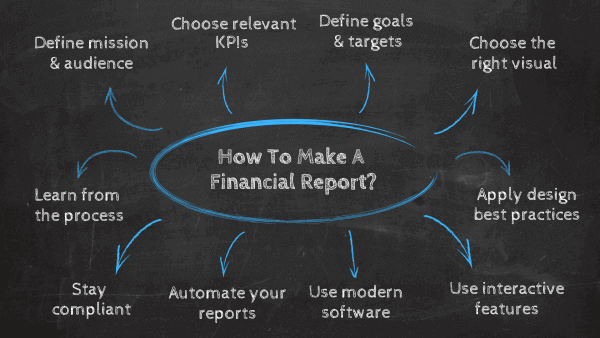
To create a comprehensive financial statement, you need to keep these points in mind:
1. Define your mission and audience
No matter if you're a small business or a large enterprise, you need to define your goals clearly and what you are trying to achieve with the report. This can help both internal and external stakeholders who are not familiarized with your company or finances. If you're creating an internal report just for the finances department, it would make sense to include financial jargon and data that, otherwise, would create challenges for external parties to follow.
By defining the mission and audience, you will know how to formulate the information that you need to present and how complex the jargon will be. Create a draft of the most important statements you want to make, and don't rush with this step. Take your time; the numbers, charts, and presentations come later.
2. Define goals and targets
Once you’ve defined your mission and the audience of your reports, it is time to set some goals and targets to use as benchmarks to measure the success of your financial strategies. This is an important step because goals help organizations plan their expected growth and improve based on that.
That said, there are a few steps you should follow to ensure you are setting accurate objectives. For starters, your goals and targets should be long and short-term but, most importantly, attainable. Many businesses fail in their analytical efforts because they take industry benchmarks, for example, as the end goal for their own performance. Now, while industry values are good benchmarks and they shouldn’t be discarded entirely, they should still be looked at with a grain of salt. Be honest with yourself and with the current scenario of your business, and define targets that are realistic and attainable. Consider your budget, your business size, your historical performance, and other elements to build efficient goals that are measurable in time.
3. Identify your metrics
In this step, you need to identify the key performance indicators that will represent the financial health of your company and help you measure the goals you defined in the previous step. Depending on the selected metrics, you will need to present the following:
Balance sheet: This displays a business’s financial status at the end of a certain time period. It offers an overview of a business’s liabilities, assets, and shareholder equity.
Income statement: This indicates the revenue a business earned over a certain period of time and shows a business’s profitability. It includes a net income equal to the revenues and gains minus the expenses and losses.
Cash flow statement: Details a business’s cash flows during certain time periods and indicates if a business made or lost cash during that period of time.
These financial statements will help you get started. Additionally, you might want to consider specific KPIs and their relations. Gross profit margin, operating profit margin, operating expense ratio, etc., all have different applications and uses in a relevant data story. Take your time to identify the ones you want to include in order to avoid multiple repeats afterward.
4. Choose the right visualizations
Continuing on our previous point, after specifying the financial statement and metrics you want to add, it's time to include visuals. This point is important since the average reader will struggle to digest raw data, especially if you work with large volumes of information.
The type of chart is important to consider since the visuals will immediately show the relationship, distribution, composition, or comparison of data. Therefore, the type of charts will play a significant role in your reporting practice. Here is a visual overview that can help you identify which one to choose:

**click to enlarge**
In the overview, we can see that scatter plots and bubble plots will work best in depicting the relationship of the data, while the column chart or histogram is the distribution of data. To learn more about a specific chart and details about each, we suggest you read our guide on the top 30 financial charts.
5. Apply design best practices
By now, you have the planning of your report ready. The next step is to bring everything to life by generating the actual report. Choosing the right chart type is the first step, but there are other design best practices that should be followed to ensure the process is as efficient as possible.
The first and most important best practice is to avoid overcrowding your reports. Putting too much information in them will make everything confusing and harder to understand, which can translate into poor strategic decisions for the future. Prioritize the most important KPIs that enable you to tell a story about your performance as well as some context to make sense of the information. Arrange your charts in a way that makes sense, and that helps the audience understand everything.
Another important design best practice is to think carefully about colors. While it is very tempting to use a different color for every KPI, it is not recommended to do this. You should stick to only a few colors that are not too strong. You can even use different shades of the same color to differentiate data points, as you saw in our examples section. It is also a good practice to use your business’s color palette to make it more personalized and familiar to the audience.
6. Use interactive features
Traditionally, finance reporting has been a static practice that mainly contained outdated data that was not entirely valuable. As you’ve learned throughout this post, this is no longer the case. Today, these reports contain a mix of real-time and historical insights that enable decision-makers to extract insights and act on them as soon as they occur. Part of the success of this modern approach relies majorly on interactivity. That is why our next best practice or tip is to integrate interactive features into the process.
Tools such as datapine offer a range of interactive functionalities to integrate into your financial reports. For instance, you can add different tabs with extra information and have it all together in a single report. This way, you’ll avoid overcrowding the report or having to generate multiple different ones. Plus, if you need to visit another tab quickly, you have the option to link that tab to a specific KPI and be transferred to it just by clicking on the chart.
Another interactive feature that makes the reporting process way more efficient is drill downs and drill throughs. They basically enable users to go into lower or higher levels of data, respectively, without the need to jump into another chart. For example, if you are looking at revenue by country but want to dig deeper into a specific country, you can click on it, and the chart will adapt to show revenue by city of that country. The same thing can be done upwards to look at revenue by continent.
7. Use modern software & tools
To be able to manage all your finance reports effectively, you will need professional tools. The traditional way of reporting through countless spreadsheets no longer serves its purpose since, with each export, you manage historical data and don't have access to real-time insights. The power of a modern dashboard builder lies within the opportunity to access insights on the go, in real-time, and with refreshing intervals that you can set based on your needs.
Moreover, professional dashboard software comes with built-in templates and interactivity levels that traditional tools cannot recreate or offer in such simplicity but, at the same time, a complexity that will make your report more informative, digestible, and, ultimately, cost-effective.
To manage financing performance in comparison to a set target, you can also use a modern KPI scorecard. That way, you will not only monitor your performance but see where you stand against your goals and objectives.
8. Automate your financial management report
Automation plays a vital role in today's creation of company financial reports. With traditional reporting, automation within the application is not quite possible, and in those scenarios, professionals usually lose a lot of time since each week, month, quarter, or year, the report needs to be created manually. Automation, on the other hand, enables users to focus on other tasks since the software updates the report automatically and leaves countless hours of free time that can be used for other important tasks.
For example, you can schedule your financial statement report on a daily, weekly, monthly, or yearly basis and send it to the selected recipients automatically. Moreover, you can share your dashboard or select certain viewers that have access only to the filters you have assigned. Finally, an embedded option will enable you to customize your dashboards and reports within your own application and white label based on your branding requirements. You can learn more about this point in our article, where we explain in detail the usage and benefits of professional white label BI and embedded analytics.
9. Stay Compliant
We already mentioned the regulatory side of financial reporting a couple of times throughout this post, but it is such an important step that we could not leave it out of this list. That is because companies that fail to meet the governmental requirements for their finance statements can face critical consequences that will throw all other efforts down the drain.
In this sense, there are different requirements depending on the country or continent. In the USA, companies need to adhere to the GAAP guidelines, which basically provide a set of rules and standards for entities to prepare their reporting in a consistent and transparent way. On the other side, countries from the EU need to follow the IFRS rules. Which obligates listed companies to follow a set of rules to prepare their statements. The IFRS guidelines provide a common language used by more than 100 countries. Through that, UE regulators can compare organizations across “international boundaries.”
10. Learn from the process
This might sound like an obvious step, but it is often overlooked. Once you are done generating your financial report, you should gather internal feedback from employees and any other relevant users and learn from the process. There is no secret recipe for the perfect finance report. Each company has different needs and resources. Therefore, tweaking little details to make the process efficient and easier for everyone involved can reap significant rewards in the future.
As you’ve learned through this list of best practices, these tools are more digestible when they are generated through online data visualization tools that have numerous interactive dashboard features to ensure that your business has the right meaningful financial data. Finally, these statements will give your business the ability to:
- Track your revenue, expenses, and profitability.
- Make predictions based on trusted data.
- Plan out your budget more effectively.
- Improve the performance of your processes.
- Create fully customizable reports.
We offer a 14-day free trial. Benefit from great financial reports today!
Comprehensive Reports For The Complete Financial Story Of Your Business
We’ve explained how to write a financial report, examined the dynamics of a monthly, daily, and weekly report templates, and explored examples relating to specific areas of the business with their related KPIs as well as some key benefits. Now, it’s time to look at the concept as a whole.
Financial reporting practices help your business obtain a clear, comprehensive overview of where your company is at and where you should plan on going. When augmented with crisp, easy-to-read visualizations in the form of financial dashboards, your business can quickly comprehend and accurately measure critical components of your status over specified time periods.
A financial statement template, as we presented above, can also help you answer critical questions, such as What can your business do with an extra $500k in cash? Will you be able to borrow less money, invest in new technology, or hire trained personnel to improve your sales?
Using datapine’s seamless software, your business will be able to see the full financial story of your company come to life and have a better grasp of your future path.
When it comes to your business’s finances, shooting in the dark or using antiquated methods of analysis or measurement will not only stunt your organizational growth but could lead to mistakes, errors, or inefficiencies that will prove detrimental to the health of your business. Data-driven dashboard reporting is the way forward, and if you embrace its power today, you’ll reap great rewards tomorrow and long into the future.
Do you want to improve your business’s financial health today? Try our 14-day trial completely free!