37 Sales Reports Examples You Can Use For Daily, Weekly, or Monthly Reports
Table of Contents
2) Why Are Sales Reports Important?
4) Tips For Your Sales Reporting Process
Using a daily, weekly, and monthly sales report with your team may be the single most powerful action you can take to increase your team’s performance and generate powerful sales results. Modern sales analysis reports provide managers and sales representatives with a detailed overview of all relevant sales processes to optimize performance and ensure healthy business growth. The best part is sales reporting has never been easier. Thanks to the rise of modern sales reporting software that facilitates businesses' lives by providing interactive reports in the shape of professional dashboards that are easy to create and understand for everyone without any need for technical skills.
To help you dive into the world of sales data analysis, this blog post will focus on the power of these reports by presenting the definition and a list of examples of daily, weekly, and monthly sales reports. Additionally, we will discuss exactly how to report sales, its importance, and the creation process so that you can find out the story behind each report and use them as templates or inspiration to generate your own.
Without further ado, let's get started.
What Is A Sales Report?
A sales report is an analysis tool that provides a mix of powerful KPIs that track the performance of various sales activities within a company. The insights contained in them help managers spot trends and improvement opportunities to reach sales goals.
These powerful tools give a snapshot of the company’s strategies and activities at a specific period to assess the situation and determine the best strategic decisions and actions to undertake. With the help of modern online sales report software, decision-makers can find potential new market opportunities to improve results and gain an advantage over their competitors.
They can be of various forms: a daily sales report format will track sales KPIs that are relevant daily, such as the number of phone calls or meetings set up by a rep or the leads created. Likewise, weekly sales report templates can monitor the amount of deals the team closes or the revenue generated. A monthly sales report format will provide a bigger picture of the activity of each sales rep or the team as a whole. Putting it all together on sales dashboards will enable you to automate your data and focus on human-centric tasks without requiring time-consuming manual calculations and repetitive exports.
There are also different variations of reports that will focus on different aspects: the progress of sales in general, detailing the revenue generated, the sales volume evolution, measuring it against a pre-set sales target, the CLV, etc. There are also reports focusing on the sales representative themselves and their sales cycle performance, from lead generation to closing a deal. We will go through the main types of sales reports later in the post, but before that, we need to discuss why these analytical tools are so important today.
Why Are Sales Reports Important?
Imagine a sales team has set an ambitious goal of closing six figures in new revenue streams for that quarter. They check their progress two months into the goal only to realize they’re way off target from hitting it. They were probably busting their butts to make their goal become reality, but just working hard isn’t enough. Setting goals is fine, but they need to be realistic and achievable. That is where professional sales reporting and analysis comes in. If that sales team had analyzed their historical data with the help of a professional report, they would have thought of a goal that matched their reality and prevented the disappointment and the waste of resources.
Tracking your progress with the help of self-service data analytics tools and regularly reporting on your performance can make a significant difference in how strategies are approached. These tools give businesses the power to make informed decisions based on their own data, preventing any mistakes that lead to wasting resources or, even worse, stall business growth.
But that's not all. Keep reading to learn more about the business-boosting benefits of these reports:
- They help you make informed decisions: Believe it or not, in the age of information, some businesses still rely on pure intuition or experience to make critical strategic and operational decisions. This can only lead to a waste of resources and untapped potential. Luckily, modern sales reports give businesses easy access to their current and historical performance to make decisions and build strategies solely based on their data. Avoiding shooting in the dark when it comes to important decisions.
- They provide a navigational system: Think of reporting as your “navigational aid” for steering your sales team in the right direction. Modern online reporting software will help you get actionable sales insights to drive future revenue and crush quotas. They make things crystal clear for your sales team regarding what’s important and what they should be working on.
- They ensure consistent monitoring: To make the most out of your strategies, you must work hard on the right things at the right time. In other words, you need to work hard with intention and awareness. And that’s what daily or weekly sales report samples will help you achieve. They indicate how your team and strategies perform in real-time, so you can course-correct things as needed.
- They keep goals simple and clear: As long as you’re not overloading your team with too many KPIs, by using reports, you can show your staff, “Hey, these numbers are crucial to our success. So, we’re going to keep track of them frequently.” When your team has a set of clear KPI examples they need to execute, they can invest all their energy into drumming up revenue – instead of wasting time thinking about what they should focus on next.
To put things into perspective, let’s say you’ve been doing an aggressive cold-calling campaign to drum up a new business. If you use a weekly report, you might find after a week that NOBODY has made any significant progress. Knowing this, you can switch to another strategy in time to hit your revenue goal.
Granted, all of this information largely depends on your sales cycles. If you have a massively expensive enterprise software package that often takes half a year to close, then a monthly report would be your version of a weekly report, and your weekly report would be similar to a daily report for other businesses with shorter sales cycles.
In essence, a sales report provides a roadmap to track your progress and monitor the team's efficiency to develop the most profitable funnel and keep your costs at a minimum while productivity is at a maximum level. If you want to improve your sales cycle performance management periodically, you can also read our extensive article on the benefits and value of a KPI scorecard.
Now, let’s move on to the different types of reports for sales.
Explore our 14-day free trial & benefit from great sales reports today!
Types Of Sales Reports
Depending on the analysis goal, the business type, and other variables, businesses rely on various reporting techniques to track the progress of their sales efforts and ensure success across the board. Here, we present you with some key types that you should know. You can find visual examples of the reports presented above in the templates section at the end of the post.
- Sales funnel reports: This type of report illustrates a business’s customer journey from when they first contacted the company to when they actually purchased a product or service. Typically, the funnel is divided into different stages, requiring sales representatives to take specific actions to move a potential client from one stage to the next. This enables managers to evaluate the individual performance of sales reps in moving prospects further in the funnel, evaluate the entire process, and tackle any bottlenecks that might be preventing leads from turning into paying customers. For example, a business might realize that leads are dying at the proposal stage. This could mean the product or service is not being presented correctly and could affect the entire sales process.
- Conversion report: Similar to the funnel report, the conversion report tracks all details related to converting leads into new customers. It takes data from your sales funnel to understand how the different stages are performing, how many leads are converted, and how many are lost, among other things. Unlike other revenue-related reports that track the amount of money brought to a business in general, a conversion report tracks the revenue generated directly by the efforts of the sales department. It can be produced monthly, quarterly, or yearly and is a perfect tool to spot improvement opportunities.
- Forecasts reports: This straightforward yet complex report type enables the department to predict the future sales of a given period. It uses predictive analytics technologies to analyze past and present data and generate accurate predictions. By using these reports, businesses can spot any potential seasonal slowdowns and any other bottlenecks that must be addressed beforehand. Additionally, a forecast report can identify pipeline weaknesses so they can be appropriately optimized.
- Opportunity reports: This tool uses Einstein's opportunity score to rate the leads from 0 to 99. The ones with higher scores are the most likely to turn into paying customers, while the ones with lower scores are not. Businesses use this score to divide their leads and dedicate more human and monetary resources to those most likely to convert.
- Sales marketing report: This straightforward report type tracks the developments of all marketing-related strategies that work towards increasing sales. It is a great collaborative tool between the two departments, allowing them to stay connected with different needs. For example, the marketing team can track which campaign has been most successful for the sales team and ensure the same material quality is produced. The same could go the other way. Unsuccessful campaigns can be discarded to avoid wasting resources.
- Sales agent performance reports: As its name suggests, these tools are used to track and analyze the performance of sales reps in terms of productivity and profitability. The metrics tracked on these reports often include the amount of leads generated, opportunities closed, and revenue generated, among others. This data enables managers to spot reps who might be struggling, provide them with training opportunities, and reward the best performers.
- Calls reports: As an extension of the previous report type, the sales call report tracks the amount of visits or calls that sales representatives make to potential clients during an observed period. The time can be either weekly, monthly, or yearly, depending on the aim of the analysis. Tracking this data helps managers assess goal completion for sales reps and understand the percentage of total calls that convert a new client.
After we have expounded on the benefits and types of sales reports, we will now explain how to make one for yourself and your boss.
How To Make A Successful Sales Report: Tips & Reporting Best Practices
Generating reports can be tricky for both sales teams and managers. To clearly compose your data to tell a story, you should follow these tips and best practices.
When you generate a report, you need to keep your final objectives in mind. To master report writing, there are a couple of crucial questions that you need to ask yourself: who are you reporting for, and why? Is this a weekly check-up or an assessment of a situation or a campaign project? What is the time period of the report? What is the main message you want to share?
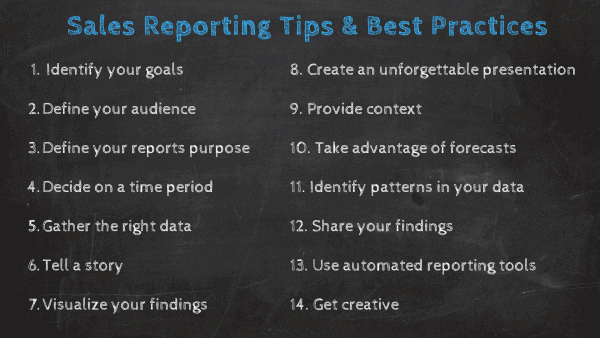
Once these questions are answered, you can easily articulate your report accordingly. Here’s how to do it:
- Identify your goals: There is no point in creating a solid reporting process for sales if you don’t have a goal. Define specific questions you need an answer to, and tie all the metrics that correspond to your final destination. This is a crucial point as it will help you define the kind of data that you need to collect and prevent your analysis from becoming overcrowded with unuseful information.
- Define your audience: Before working on the report, consider who will read it and what they need to know. Consider their background and if they are familiar with the jargon you might use. It’s not the same if you write for a specific sales audience than to a general one. Taking care of this aspect will help your reports be more engaging and readable.
- Define the purpose of your report: Sharing monthly advancement with top management or just having the weekly overview and analysis of the sales objectives with your team. Both reports will have a different structure, and the info you will share will also be very different. You can also benefit from report automation and schedule a specific time for your reports to be produced and shared.
- Decide on a time period: You can create a daily and a monthly report or choose to display the data of the last quarter or year. Whichever you choose, it is important to think about it beforehand as it will help you gather the correct data and plan accordingly. You can also customize templates based on your own goals, departmental structure, or C-level management requirements.
- Gather the right data: Now that you have defined your goals, audience, and time period, you should have all the necessary information to collect your data. With the help of professional online BI tools, you can easily connect multiple data sources and visualize them all together in interactive sales analysis reports. The best part is the sources will be automatically updated, meaning you will always have fresh insights available.
- Tell a story: As you learned from the different types of reports we presented above, each type tells a different story based on the goals we have predefined. In this area, you also need to look at the bigger picture. If your goals aren’t being met, there is a reason behind it – does your customer or client have a rough business patch that resulted in lower sales volumes?
- Visualize and communicate your findings: Once you have analyzed and dug out insights from your data, the most important part is to convey this information to your audience. In the past, reports were mainly in written form or using static visuals. Today, it is all about interactivity and visual analytics. A professional business intelligence dashboard is a highly visual tool that offers a centralized location for your most important sales KPIs.
- Create an unforgettable presentation: Humans are visual creatures, and by visualizing all the numbers and correlations on a single screen, you enable faster insights, pattern recognition, easy-to-spot trends, and interactivity with data. A simple sales presentation with visualized data is much more digestible and effective when it’s done through the power of online data visualization.
- Provide context: An aspect often forgotten when we are deep in the reporting mindset is that numbers never tell the full story. Provide some background and a bigger picture of the figures, especially if you are presenting weekly sales report templates. For instance, how has the situation been this month or this quarter? Is the general trend going up or down?
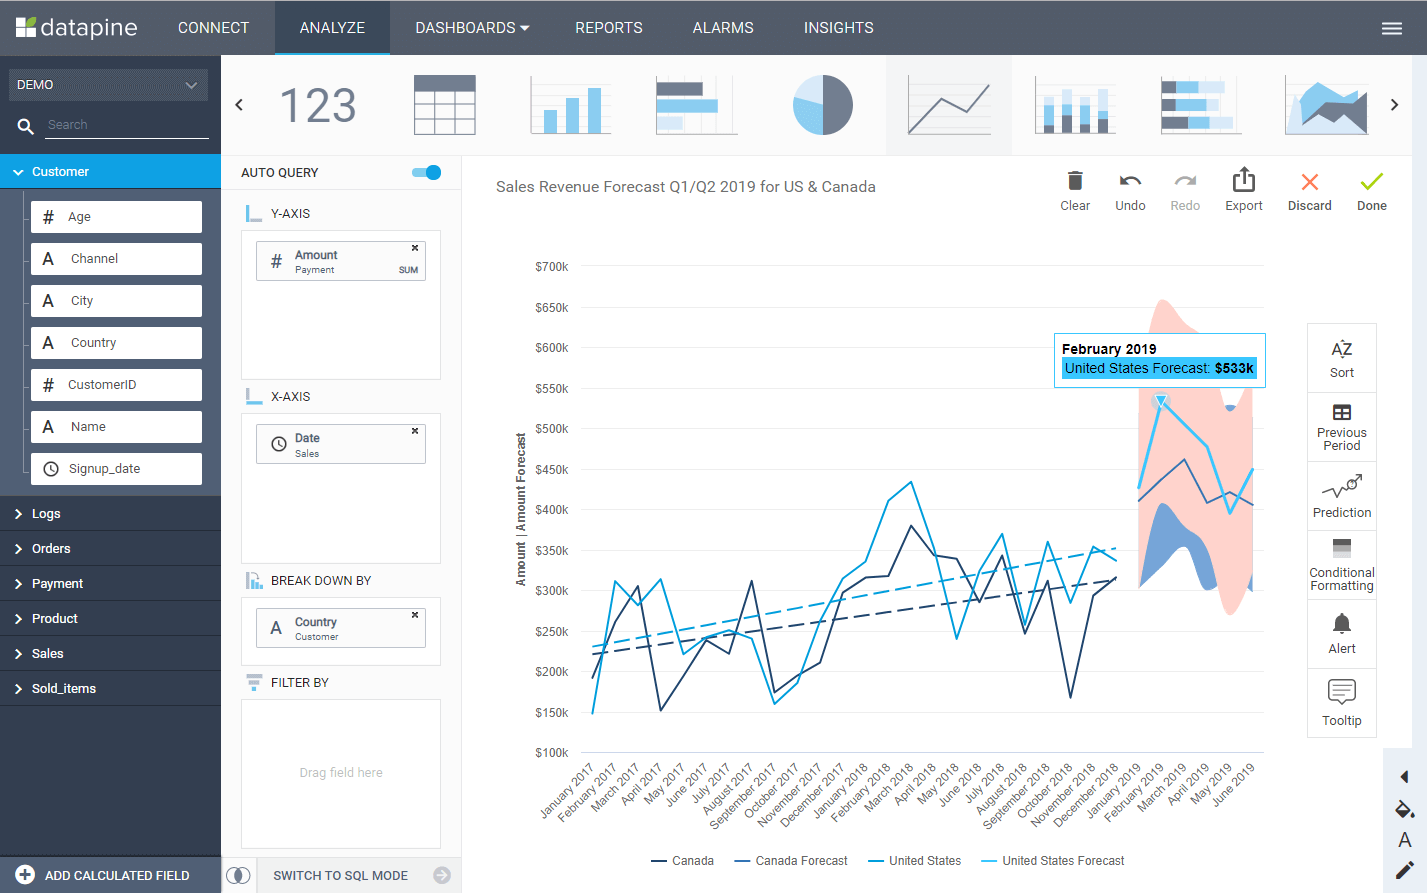
- Take advantage of sales forecasts: One of the most crucial tips we can give you is to utilize sales forecasts to be able to make better and more informed business decisions, predict future performance, and give insights on how to manage your sales strategies, like in our example below:
**click to enlarge**
This example shows an intuitive user interface of modern business intelligence software like datapine that allows you to analyze and visualize sales data with a few clicks and take advantage of advanced analytics features such as predictions, intelligent alerts, and conditional formatting.
11. Identify patterns in your data: An important tip to consider when using company sales reports for your online data analysis process is to act on results. Often, organizations react when the numbers are negative. However, the true value of reporting lies in providing a deeper look into your business. Once you get your sales management reports done, examine the data carefully, and find trends and patterns to understand why something is happening. Like this, you will not only fine-tune your sales strategies but will find new opportunities that will lead your business to grow.
12. Share your findings: Whether you need to input your colleague or show your sales manager or board of directors achievements and current insights, these kinds of reports should be easily shared. That way, you empower collaboration and increase productivity between stakeholders. For instance, datapine’s business dashboards can be shared and exported in multiple formats, including print, PDF, live URL, automated email, and more.
13. Use automated tools: One of the main benefits of sales reporting is to help businesses deal with their sales data the most efficiently. To do so, sales business intelligence tools provide automated features that will autogenerate your reports with just a few clicks. By investing in these business intelligence solutions to leverage your sales data, you can leave the pains of manual reporting in the past and benefit from interactive dashboards filled with real-time data ready to extract fresh business insights.
14. Get creative! When building your report, add a bit of fun or a more personal touch to catch your audience's attention and make you more confident while presenting! Sales analytics tools, like datapine, offer white-label reporting features to allow users to customize reports to meet any design needs they might have.
These tips will help you create a powerful business sales report to share with your colleagues and key stakeholders. To keep digging deeper into the process, below we will discuss some tips to present a report to your boss.
How Do You Write A Sales Report To Your Boss?
All of the steps mentioned above apply when writing a daily, weekly, or sales monthly report to your boss. However, your audience is already defined and specific – this time, you are writing for direct and/or top management. So here’s what you should additionally consider when writing to your boss:
- Focus on what matters to your boss: choose the right metrics. During the writing, you must remember why your boss needs the report and focus on giving the precise information they need to make the best data-driven decisions possible. When gathering the data, select the very metrics that matter to them: sales growth, the targets previously set and the state of achievement, the sales revenue over the month or year, etc. Remember that data is the centerpiece of your report, so spend some time collecting and organizing it as clear as possible.
- Visualize the data to communicate it better: To make it easy to grasp in a simple glance, instead of adding up one after a succession of graphs, you should opt for the overview that provides a dashboard. To visualize all of your metrics together in an effective way, online dashboards are key – and you can take some inspiration from different dashboard examples and templates. The advantage of using such dashboards is that you will always present up-to-date information, as they work with real-time data. No more stress over synchronization and updating files a hundred times!
- Don’t forget the executive summary: To finish with, do not forget to add an executive summary. That summary might be at the beginning of the report before introducing your data and findings, but that will still be the last thing you will write. Indeed, it will summarize the major insights drawn out and question the next steps. Top management does not always have time to go into detail, so you need an executive sales summary paragraph that lists the salient points.
Now that you've got all the details on analyzing sales data and creating powerful reports, we will look into an extensive list of 37 templates for daily, weekly, monthly, and quarterly reporting.
Explore our 14-day free trial & benefit from great sales reports today!
Sales Report Examples For Daily, Weekly, Monthly, & Quarterly Reporting
1. 8 Monthly Sales Reports Templates And Samples
A monthly sales report is used to monitor, evaluate, analyze, and determine monthly sales trends. It includes more long-term measurement of KPIs, such as sales cycle length, conversion report, and monthly progress report, among many others.
To dig a bit deeper, we will briefly introduce some monthly sales reports examples that can help. A month will provide a broader feeling of how your sales reps are performing in the long run, even though, as we mentioned earlier, it can be too long for you to implement correction to avoid missing out on opportunities before it is too late.
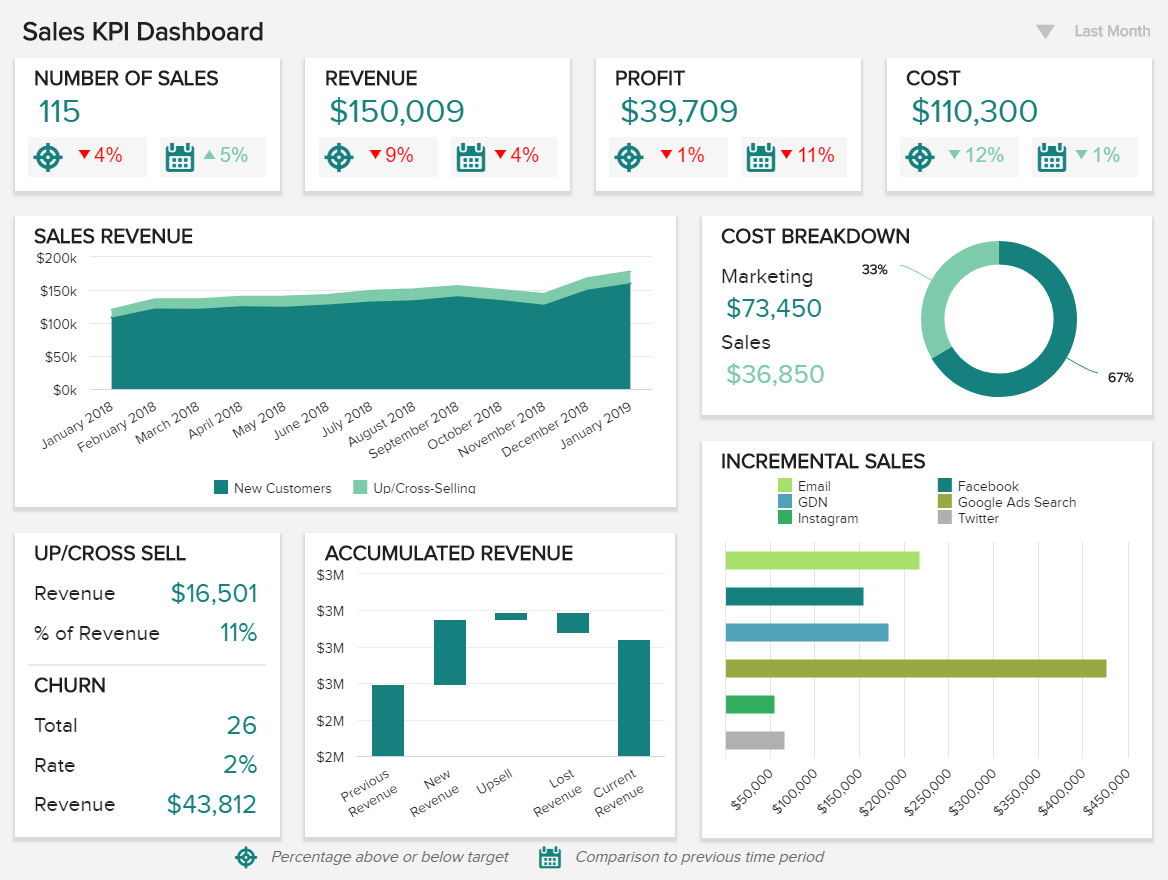
1) Sales KPI report
We will start with an example focused on high-level metrics intended to make C-level executives’ lives much easier. Reporting on these levels should include main metrics, such as revenue, churn rate, profit margin, incremental sales, etc.
**click to enlarge**
These metrics (as seen in the example above) are of utmost importance to track every month since they can change the course of a company’s sales strategy. Sales VPs, managers, and executives can monitor the most important operational and strategic data to increase the quality and performance of designated sales targets. A monthly sales report template like this one can be generated within minutes with professional KPI software.
In the example above, we can see how to maintain revenue and management under control with the help of interactive charts that consolidate data from your connected database and bring you powerful visualizations that tell an immediate data story. You can break down your costs, monitor your incremental sales, and compare your results with the last month while keeping your data up-to-date.
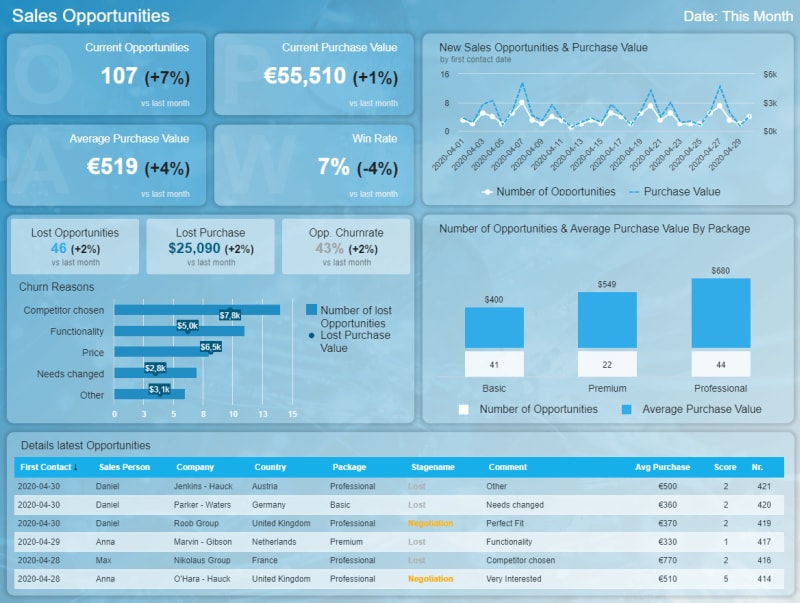
2) Sales opportunity report
A sales manager report template should incorporate management, development, monitoring, and analysis of opportunities. Those are the most prominent leads within the funnel that need special attention and care. With the help of professional BI reporting tools, opportunities are available in a single, central location, and automatic data updates will enable you to look at the data in real-time without the manual optimization of numerous spreadsheets and static reports. Let's see this through a visual example below:
**click to enlarge**
A sales performance report sample above is focused on opportunities and details on various metrics. It starts with a glance overview of current opportunities, current purchase value, average purchase value, and the win ratio compared to last month. This will immediately tell you if your developments are positive or need additional adjustments to improve results. Below, you can find details on the churn reasons with the most lost opportunities stating they've chosen a competitor. You can use these findings to examine what competitors offer and if you can adjust your sales strategies accordingly and try to offer something more valuable for your most promising leads.
At the bottom, the details will let you know when the first contact was made, by which sales rep, what kind of package is listed, comments, and other specifics of each opportunity. That way, you will see additional information without needing to manually search through e-mails or spreadsheets or perform any manual and time-consuming task. By adopting business intelligence software, key reports for sales managers will be centralized and accessible anytime and anywhere. Moreover, you will be able to share and interact with each part of this dashboard, saving you countless hours of work and, ultimately, increasing your productivity levels.
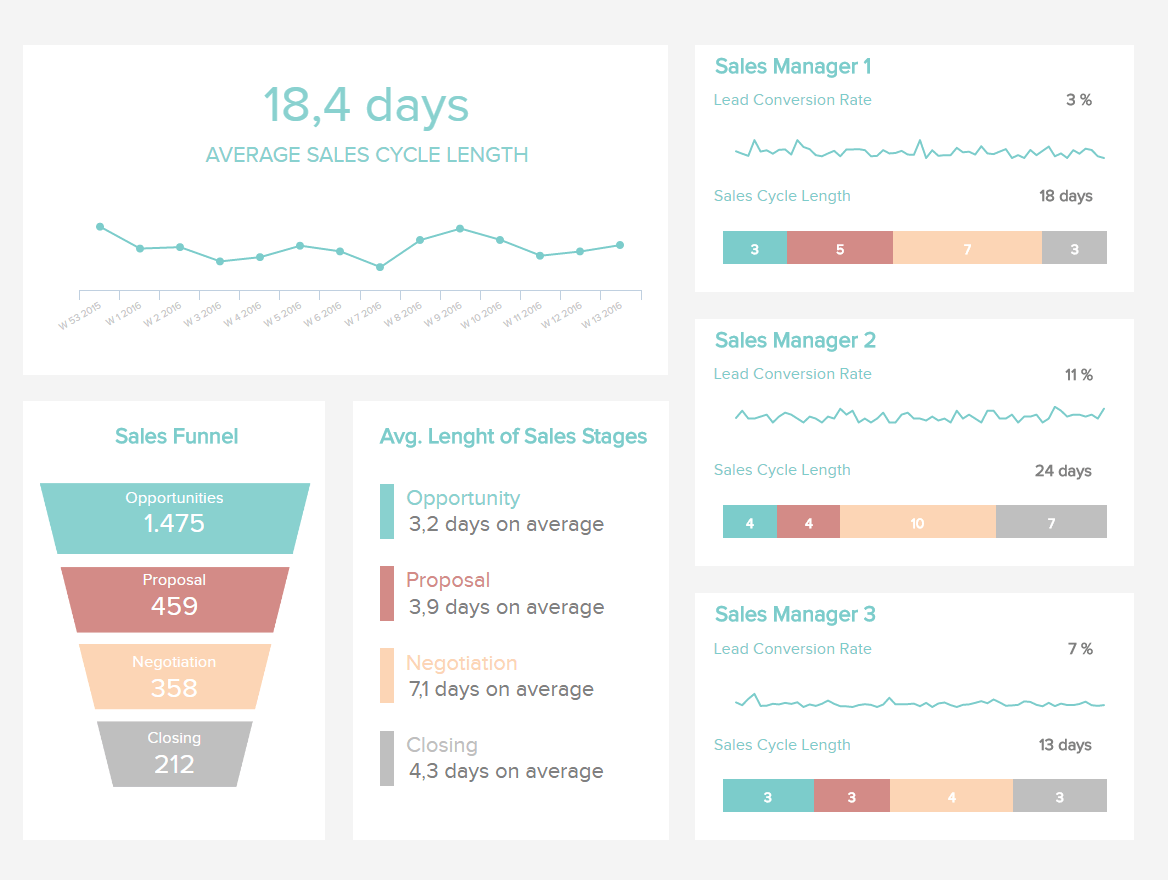
3) Sales cycle length report
This monthly sales report sample covers the totality of your reps’ sales funnel, from the opportunity to a closed deal. It will outline the development of each rep and point out how good they are at closing deals and how long it takes them to get there. Visualizing these metrics will help you determine the strengths and weaknesses of each individual, providing you with the information you need to respond accordingly.
**click to enlarge**
In our sales data analysis example, you can see that the average cycle length is 18 days, with the details being shown below and on the right in this dashboard. A data report such as this will ensure you gain a complete overview of your cycle while monitoring the conversion rate and cycle length of each sales manager on your team. The goal is to shorten the sales cycle as much as possible, but it also depends on the industry. In B2B, the cycle length is usually much longer than in B2C. The less time it takes you from identifying an opportunity to closing a deal, the more effective and profitable your processes will be.
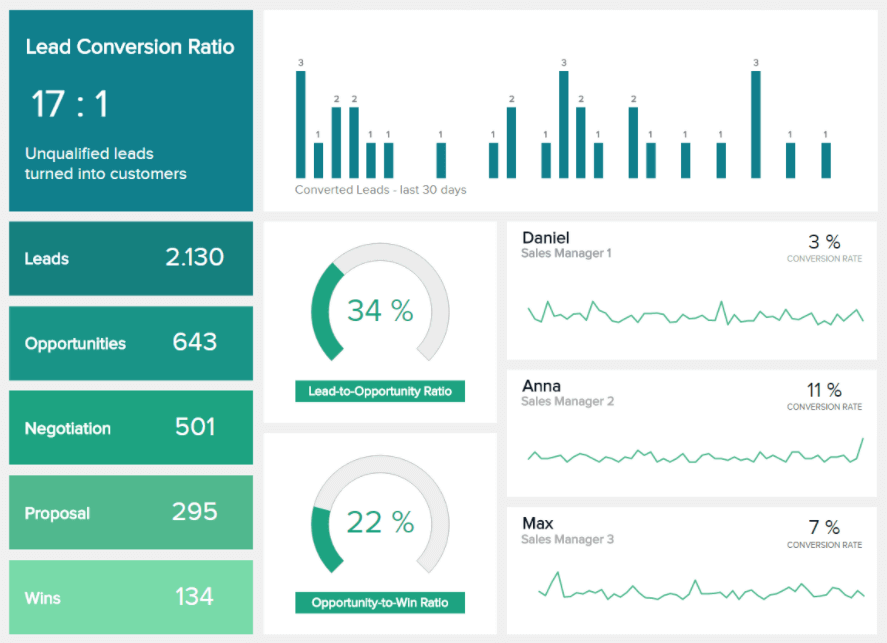
4) Sales conversion report
As a complement to the previous template, here you can see how effective your reps are at converting the leads into sealed deals after hitting every step of the funnel to get there. By analyzing each stage of this funnel, you can identify where an issue may occur and address it to increase your sales conversions.
**click to enlarge**
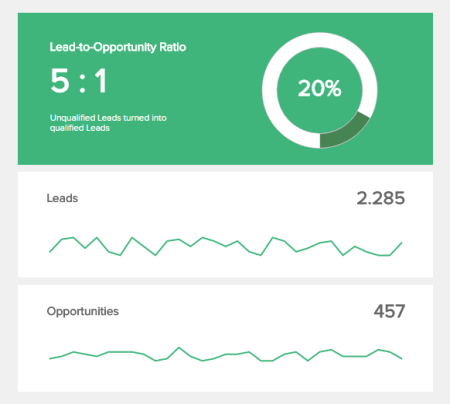
This sales summary report sample, created with a powerful dashboard maker, shows the leads, opportunities, negotiations, proposals, and wins in a simple yet straightforward way. The monthly development is depicted on top, showing how many converted leads you gained in the last 30 days. When you see certain spikes, you can examine what happened that day to see if you can apply the same tactics for your next sessions.
You can also see two gauge charts that visualize the lead-to-opportunity and opportunity-to-win ratios. If you notice a significant increase in your wins, you can safely assume your sales reps bring profits to your company. On the other hand, if the opportunity-to-win ratio is stagnating or decreasing, you can examine what kind of problems your reps have at the later stages of sales.
5) Sales Analysis Report Sample
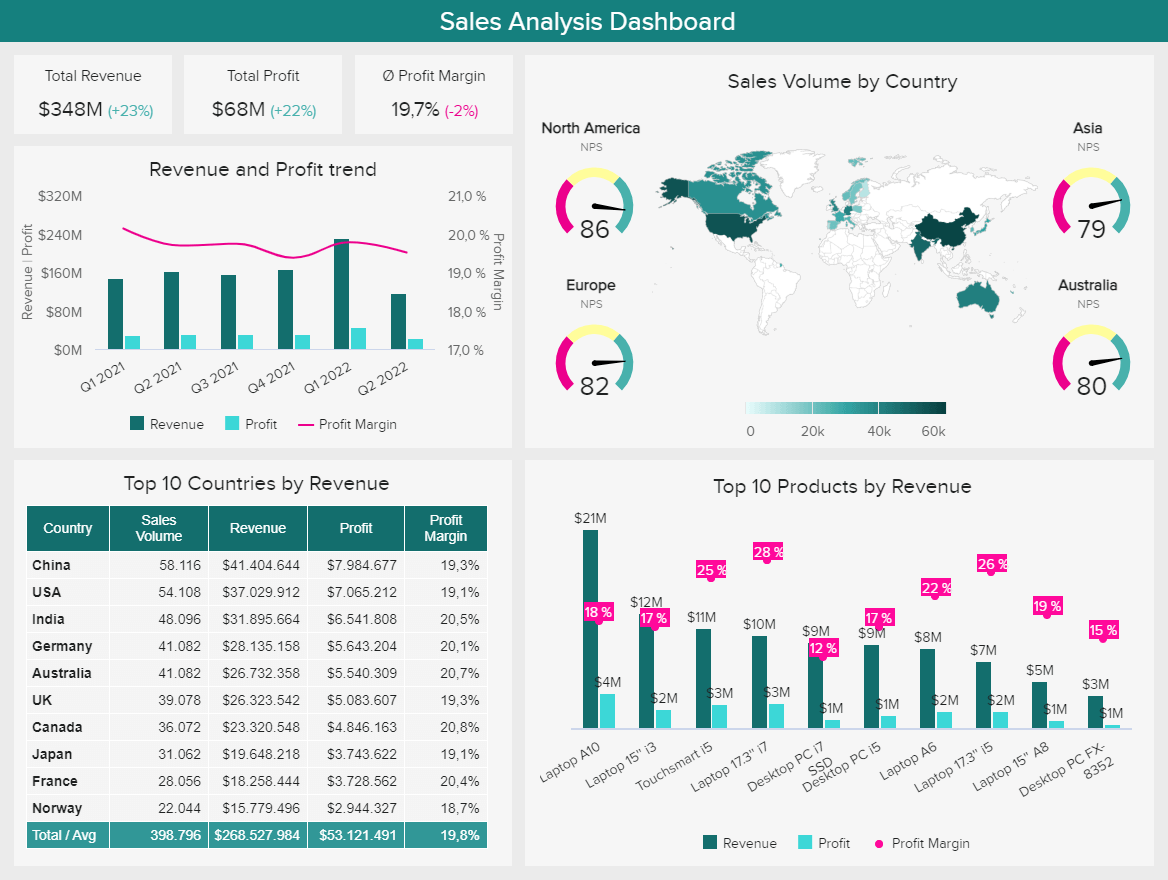
Our next example is the perfect overview for a B2C business that sells products or services across the globe and needs a centralized view of the latest developments. With insights into critical revenue, profit, and product metrics for different regions, companies can extract actionable insights regarding the development of their strategies and identify where they could be improved.
**click to enlarge**
Looking into this sales operations report in more detail, we get a revenue and profit trend chart where users can quickly understand the overall performance of each quarter. In this case, we can see that Q2 2022 saw a significant decrease in revenue and profit compared to Q1 2022. Now, that data alone doesn’t tell us much about why this happened. To dig deeper, you need to explore the rest of the data contained in the report and extract useful insights from it. For example, by looking into the revenue by country and product charts, you can identify a region or product that is underperforming and affecting the overall results. In this case, we can see that some products with the highest revenue also have the lowest profit margin; this could mean high production costs that could be optimized to increase profitability.
6) Sales & order report
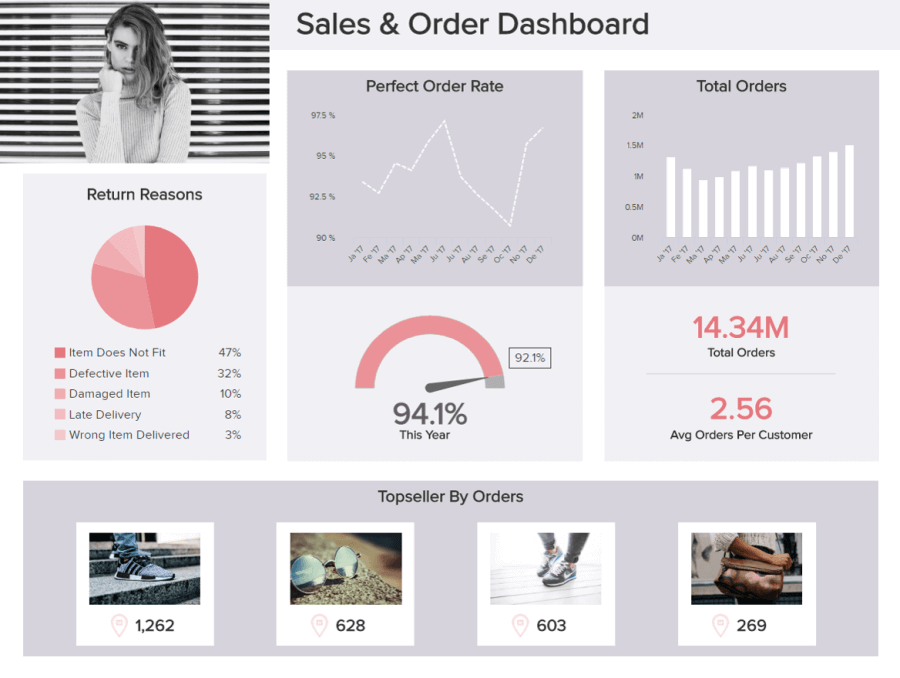
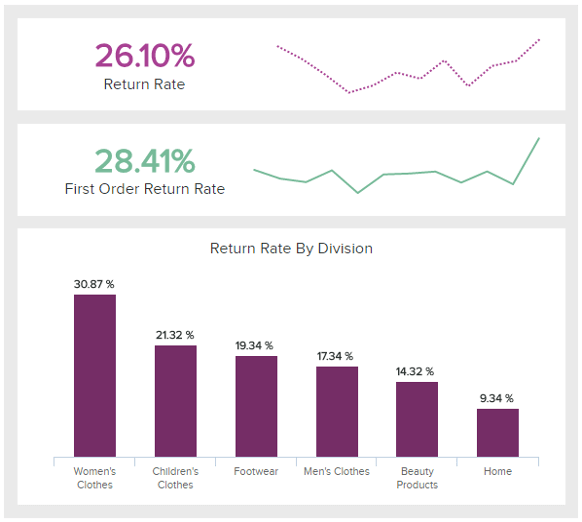
The following monthly report template can benefit online retailers the most. With so many orders to handle, it can sometimes be difficult to track everything sent out or returned. Every retailer aims to increase sales volumes, but keeping the return process in the loop will help you greatly on many levels. In the retail dashboard below, you can first see in which quantity your items are returned and then analyze why. This is key to figuring out where the problem lies and troubleshooting it as fast as possible.
**click to enlarge**
If the item doesn't fit, as we see in our example as the main return reason, it would make sense to communicate the sizes more effectively. Maybe they need to be more visible within your online store, or they don't correspond to the standard US or EU sizes.
That way, you can easily increase your customers’ satisfaction, and we all know that a satisfied client is coming back: s/he can also recommend your products and services to their friends and family. And that’s pretty much what you want to achieve.
7) Outbound calls report
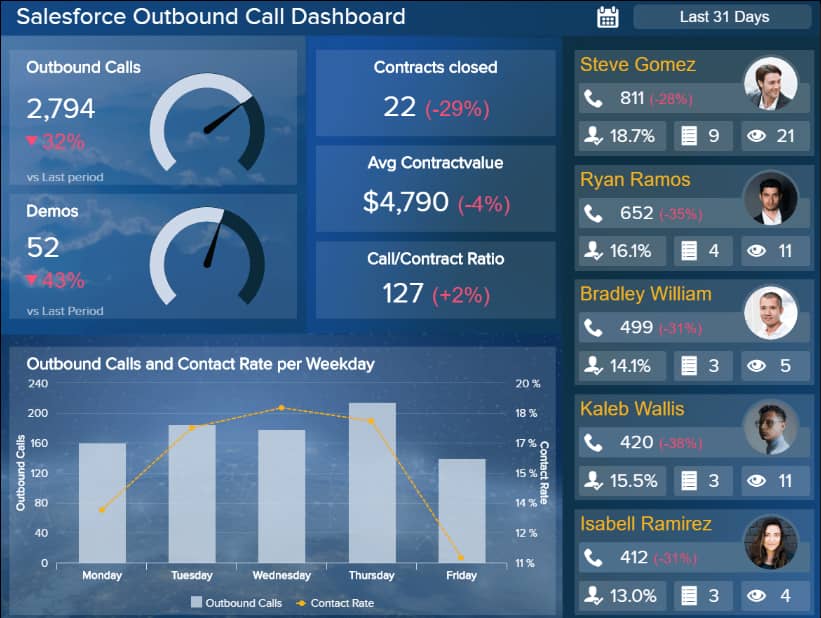
Telephone cold calling is still one of the most important techniques used in sales. That’s why we have chosen to present this report, which displays various key areas in your outbound processes and potential results.
**click to enlarge**
In this comprehensive sales analysis example, you can generate invaluable insights referring to outbound call trends, the sales team performance based on the contact rate, contracts closed, and average order value, among others. This visual lets you compare your findings with the previous period and learn the most effective moment to perform calls to maximize results and profits.
In our example, you can see that the contact rate is highest mid-week while the details on the agents' performance are depicted on the right. The trends are indicated in comparison to the previous period and are, unfortunately, negative. The point is to examine further what happened to avoid such scenarios in the future. If agents need more education or something unexpected happens that you can't influence or change, it's time to ask additional questions.
8) Sales performance report
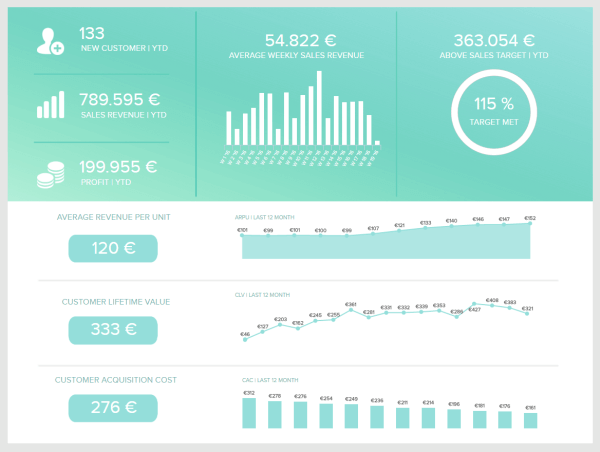
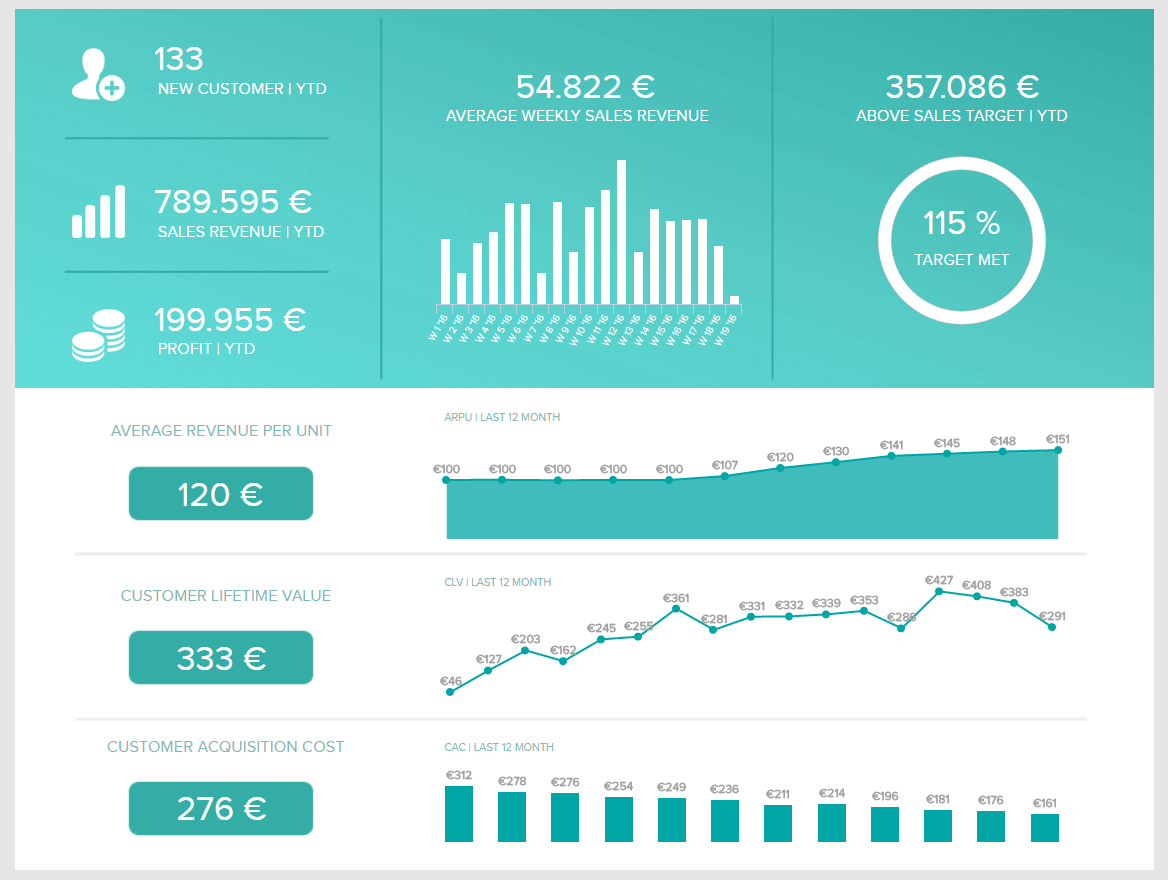
As our final monthly report format, we chose one that displays a broad overview of your performance, combining a lot of different KPIs – which is helpful if you decide to create a monthly report. The one displayed here goes further, showing data over one year, but you can take data for just over one month.
**click to enlarge**
From the number of customers you have acquired during that span to the costs it takes to get them, from the average revenue each of them brings you to the lifetime value they have, this sample provides you with at-a-glance information to quickly see if your teams are meeting their goals.
In a practical sense, this performance dashboard will enable you to track the acquisition costs, the average revenue per unit, the customers' lifetime value, and the development over time. It's important to track and regularly evaluate your performance since it will create an informed sales environment where you can make decisions based on data and not "hunches" or assumptions that can cost you significant money and time.
Explore our 14-day free trial & benefit from great sales reports today!
2. 13 Weekly Sales Report Samples And Templates
A weekly sales report is a measurement tool used by companies and individuals to track sales performance and essential KPIs, such as lead-to-opportunity ratio, lead conversion ratio, sales volume by channel, and total sales per region, among many others, every week.
A week is arguably the perfect period to measure individual sales rep performance. A month is often too long, leading you to miss out on course correction opportunities until after the fact. And a single day is often too short to see any meaningful, outcome-dependent information. Of course, the perfect period to measure sales rep performance also depends on your business model as well. You can also check our resources to expand your knowledge using a business report template.
Here, we will look at specific reports and KPIs you can track weekly from a B2B and retail perspective.
a) Track Your Weekly B2B Sales With These Reports
As mentioned, the week is a perfect span to track your team's performance and get a more detailed overview of your sales numbers. Let’s explore some examples below!
1) Number of outbound calls
Telephone cold calling is an invaluable B2B KPI that can tell you which weekdays are the most promising for outbound calls. Usually, Tuesdays, Wednesdays, and Thursdays are particularly valuable for B2B sales, but it might be helpful to set your own benchmarks.
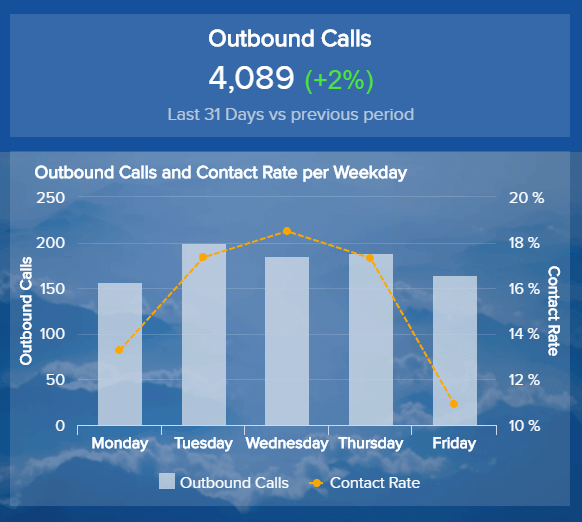
You can set daily targets and track the progress during each day of the week but do consider factors such as mentioned days of the week or local time.
2) Sales volume by channel
This is a bit of a more “strategic” KPI that can also be used effectively on longer time scales. This report shows you what physical areas and customer acquisition methods pull the most revenue. The total sales volume can make it easy to see where you should prioritize your sales efforts so that you can adjust accordingly.
3) Sales opportunity score
Scoring models will help you set a standardized value for your opportunities since there are different classifications depending on the potential. That way, you can allocate your resources more effectively and spend more time with more potential opportunities.
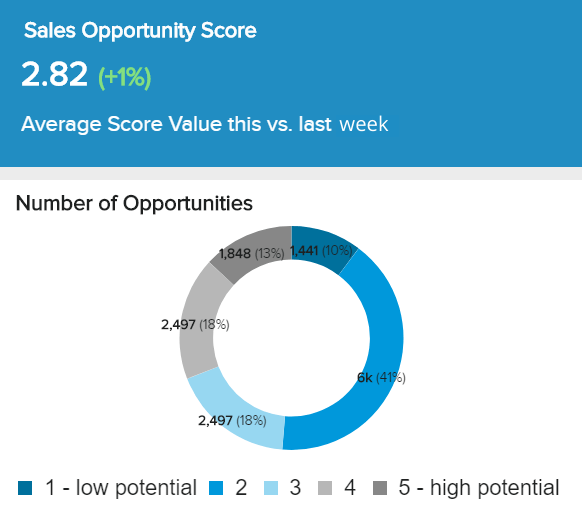
As we can see in our sales summary report above, the amount of high-potential opportunities corresponds with the dark grey area and 13% of all opportunities. This metric, created with modern dashboard software, will help you make an effective weekly strategy and action plan on where your sales reps should focus their time and energy.
4) Revenue closed by rep
While a week may be slightly too short to get a meaningful revenue metric (depending on the length of your sales cycle), this is still a valuable report to run. For shorter sales cycles, you’ll certainly be able to see trends by rep over 2-3 weeks. For longer sales cycles, this report may provide insight into what times of the month your reps tend to close sales, increasing the accuracy of your future projections.
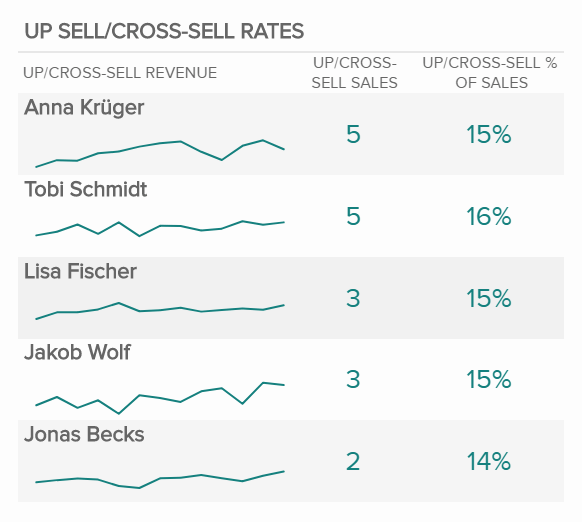
5) Upsell and cross-sell rates
As it is well known in the sales industry, it is much easier to sell additionally to your existing customers than to acquire new ones. This daily sales report sample is useful to track every week since tracking it daily is just too short of a time span to evaluate your strongest and weakest points. When you compare the results of each rep, you can see each rate and educate others to implement the same tactics. That way, your sales numbers will grow, but there is a high chance that you will also improve client loyalty and satisfaction.
6) Customer lifetime value
This is one of the most important KPIs you can track in a B2B sales setting, first on a week-to-week basis and then expanding over the months.
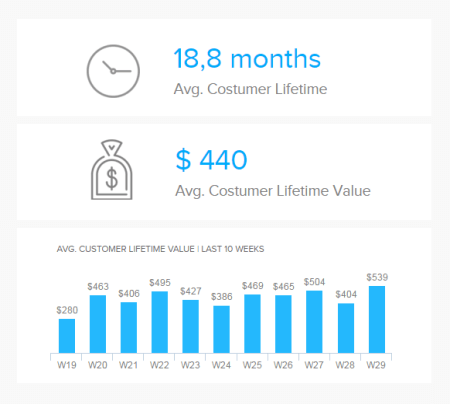
It shows how much a business expects to earn from the entirety of the relationship with a customer. You can monitor it weekly to see whether the average rises or decreases. The goal is, of course, to keep the lifetime value as long and high as possible.
7) Average purchase value
Comprehensive sales analytics reports should include the average purchase value. It makes sense to compare this metric with the amount of opportunities every week since you can immediately spot direct correlations between the two.
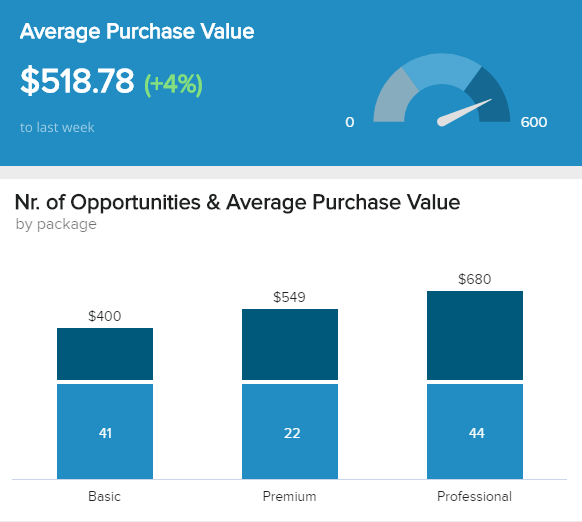
In our example of a sales report, we can see the number of opportunities and average purchase value divided into 3 categories: basic, premium, and professional. The numbers can help you identify if you need to offer additional incentives to your clients or customers to increase your chances of selling higher-end products or services. If you compare it with the previous week, you can see the growth of 4%, which tells you you're on the right track.
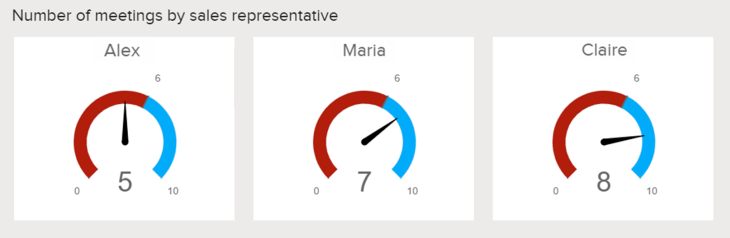
8) Client meetings attended by rep
This is very good for a weekly sales activity report template. While in a day, it’s hard to get meaningful conclusions from how many meetings are being attended by each rep, a week timeline shows a different story.
These meetings can either be virtual or in person, but successful sales reps will have them consistently, and this report will show you how they’re doing.
9) Lead-to-opportunity ratio
Tracking this metric weekly will let you evaluate the amount of unqualified versus qualified leads. A qualified lead is usually an opportunity, i.e., positive interaction that leads to a face-to-face meeting or a phone call, opening favorable circumstances for closing a sale. The lead-to-opportunity ratio tells you the amount of leads you need to meet your objectives in terms of revenue. Once you have a baseline ratio, you know how many leads you need to create to reach your target growth – and at the same time, you have predictable revenue.
This example can be assessed with the MQL (marketing qualified lead) and SQL (sales qualified lead), as it interconnects the departments since you need to define the most promising prospects that can turn into customers. Over the weeks, you can determine which potential customers convert the most and adjust your sales and marketing strategies accordingly.
10) Opportunity-to-win ratio by rep
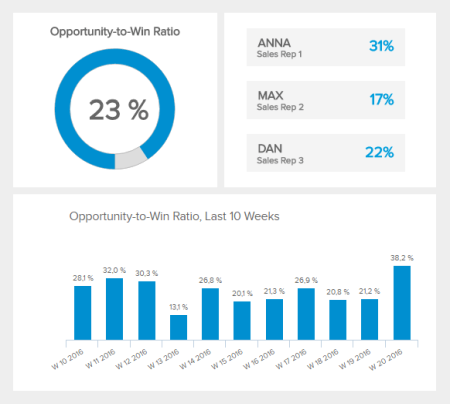
This report displays a straightforward sales KPI that shows how effective each of your reps is at closing their opportunities. While some variance is expected, if one rep is dramatically better than the others, they may get the best leads. Or, this rep may have some skills they could teach the rest of your reps.
If a rep isn’t closing at the same rate as their colleagues, this could just be a fluke – at least weekly. But if these weekly reports continue to indicate the same trend, it could be the moment to help this rep out.
11) Lead conversion ratio
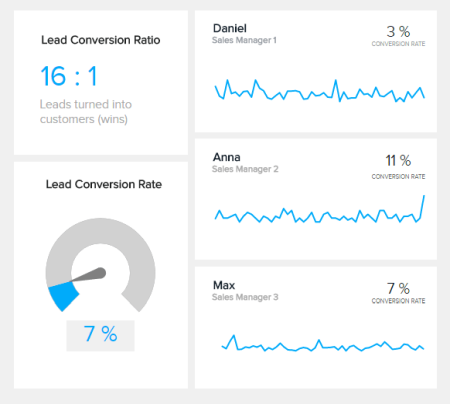
As the name states, this report will measure the number of leads that end up in a “win,” i.e., that turn into paying customers. This is one of the most important ratios for a sales team, as it gives a baseline to determine the number of leads the team needs to meet business objectives. It will depend on each company and industry, but generally, a low lead-to-conversion ratio will alert you to the weakness of your sales pipeline.
b) Skyrocket Your Retail Sales With These Reporting Templates
As one of the most sales-oriented businesses, retailers must also measure, and report on important sales values every week to get a bigger picture compared to daily reports. Let’s see which ones are the most prominent.
12) Rate of return
The next example is a retail sales report template tracking the rate of return. Whether a big or small business, the rate of return can tell you a lot about what customers think of your merchandise.
No retailer is happy when their products are returned. Therefore, tracking these values every week will enable you to decrease this number in the future when you investigate why the goods were returned and how you can improve.
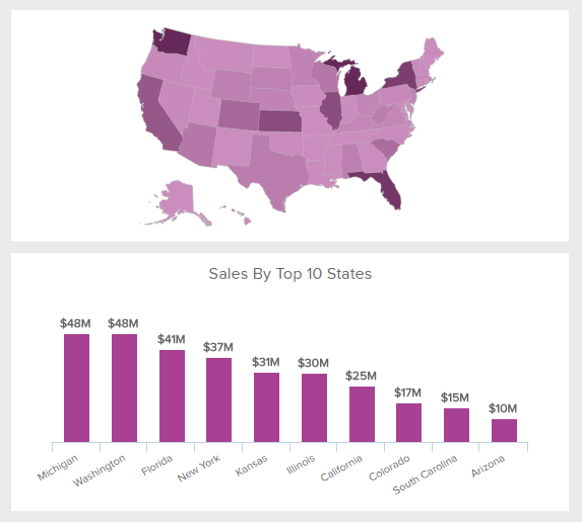
13) Total sales by region
Tracking your sales by region can tell you which of your stores (or customers’ locations if you are an online business) are performing well. That way, you can compare these values and implement various other marketing activities based on your results. If you see a specific location outperforming others, see what makes it tick and invest more resources to grow even further.
Now that we have tackled monthly and weekly sales reports and provided examples you can implement in your own business strategies, it’s the moment to take a look at some more detailed insights through sales daily reports.
Explore our 14-day free trial & benefit from great sales reports today!
3. Top 11 Daily Sales Report Templates And Examples
A daily sales report is a management tool used by businesses, sales reps, and managers in order to extract the most relevant day-to-day sales data, such as the number of closed deals, client conversations, opportunities created, and many other sales-related KPIs.
Regarding daily reports, you don’t want to get too focused on outcome-dependent metrics. Instead, you want to focus more on process metrics. What’s the difference?
An outcome metric is revenue earned, which your sales rep can’t directly control. A process metric is something your sales rep can directly control, like how many calls they’ve made, emails they’ve sent, or meetings they’ve set up.
Daily, your reps will simply have some bad days and some good days due to reasons beyond their control. So, seeing that a rep has one low-earning day and then calling them into your office would be a little premature and arguably an example of micromanagement.
However, if several days in a row are pretty bad, or if a week goes by where your reps aren’t performing at their normal standards, that’s a pretty good sign that you might want to ask them what’s happening. Maybe they need to learn some new skills – or maybe their dog just died, and they’re in a bad spot. Either way, it’s your role as a manager to support them. Hereafter are some examples of B2B and retail KPIs you can measure in this sales reporting template.
a) B2B Daily Reports To Control Your Operations
As mentioned, each day in a sales department is different, and many things are simply out of human control. But by closely examining your daily sales operations, you can better conclude what works in your sales process and what does not. Now, we will focus on some examples you can track every day.
1) Number of meetings set up by a rep
While you can’t actually force a potential client to meet with you through sheer force of will, you can mostly control how many meetings you set up. Take note that we’re not tracking phone calls and/or emails sent out explicitly, as while those KPIs can measure effort, they can also be manipulated quite easily.
And this contains an important lesson about KPIs, even daily ones – they must serve your overall goals. If your daily KPI measures something that doesn’t contribute to your overall goal, it’s not valuable. All in all, it’s hard to set up too many sales meetings, which makes this daily sales activity report template useful.
2) Number of client conversations by rep
This is the equivalent of: “How many phone conversations and in-person meetings do each rep have each day?”. Again, all else being equal, a rep who spends more time talking to customers will generate more results for your business than a rep who doesn’t. This is assuming that you are qualifying your leads properly, which sometimes can be easier said than done.
3) Lead response time by rep:
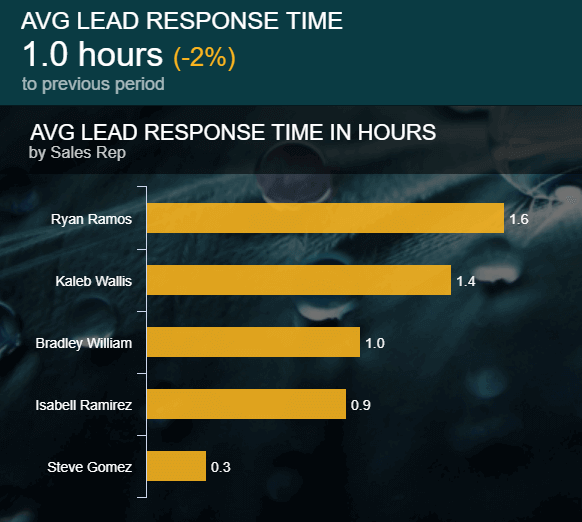
This daily sales report template can be tricky and controversial since it can vary greatly based on the lead type and actual scenario. The optimal response time should be determined after different strategies are tested. That means you should decide when the right time to react is when prospects download a free trial or whitepaper, whereas prospects requesting an offer should be contacted as soon as possible.
After you have your benchmarks, you can track daily how your sales reps are performing and their averages. That way, you can better analyze the effects on your overall strategy.
4) Number of outbound calls by rep:
You can track the number of outbound calls made by each of your reps daily, see how effective they are in their performance, and take appropriate measures if there are significant deviations from set targets. That doesn’t mean you should micromanage sales reps on a daily basis, as mentioned earlier, but provide them a helping hand when needed.
5) Number of sales opportunities
An opportunity is basically a lead that gets qualified because of the good response and interaction it had – meaning, this is no junk email address nor a fake phone number. An opportunity can be a conversation that ends at a meeting, paving the way to further sales interaction.
Valid qualified leads are extremely important to sales, as is comparing the number of opportunities against the purchase volume. This sales analysis template will show you the potential purchase value of new opportunities, and it would make sense to track it daily but also its development so that you can easily pinpoint successful days and try to recreate the processes in the future optimization of your sales funnel.
6) Number of touchpoints created by rep
This is a tie-in metric that looks at:
- How many emails were sent to a potential customer that has shown interest
- How many phone conversations were held or voice mails left with potential customers who have shown interest
With this metric, we’re trying to provide an overall “effort” KPI for each rep without making things too easy to manipulate. That’s why it can be useful to specify that for an email or phone conversation to count, there must have been prior contact with a customer identifying them as a lead.
7) Number of new leads created by rep
This is a pretty straightforward report. If you’re worried about reps boosting their numbers with low-quality leads, you can identify specific qualifications for leads and base your report on those numbers.
8) Number of sales/closed deals

Quite straightforwardly, this KPI counts the number of sales performed on the day. This is particularly important for small retailers with many items with low-added value who need to close as many deals as possible to make a profit margin.
b) Retail Sales Reports You Should Track On A Daily Basis
The retail KPIs we will explain next are indispensable in the retail industry. Retailers must track these KPIs since they need to have a daily overview of their operations, costs, and expenses to be able to generate profit. Let’s take a closer look at each of them.
9) The total volume of daily sales
This is a clear-cut daily report that focuses on the number of sales achieved on a daily basis. It is quite important to track, especially in the retail industry, since daily volumes can indicate which days of the week perform best and how you can use this to your advantage.

The goal is to keep your daily sales volumes growing, but don't panic if they start to decrease - instead, investigate why and adjust your strategies.
10) Average transaction size
This is another retail KPI that is extremely useful to track since you can conclude a lot about customer behaviors by looking at the device or payment type.
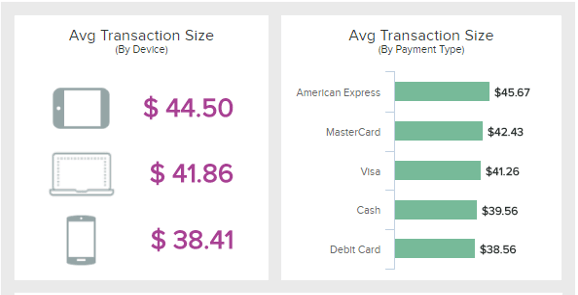
This KPI certainly varies, depending on the retail store type. However, evaluating this KPI can tell you how to adjust your advertising and online shop to meet your customers’ needs.
11) Total orders and average units per customer
Order placement must be tracked daily since retailers need to monitor how many orders they receive each day to ensure profitable results. This will enable you to improve your retail analytics and evaluate which weekdays are busy the most to avoid out-of-stock situations.
The average number of units per customer evaluates how many items customers purchase (on average). This can set the tone of the purchase trends and give you enough data to evaluate your sales even more precisely.
4. Bonus: Quarterly Sales Reports Examples
A quarterly sales report is a tool used to record the performance of sales metrics in three months. One month is often not enough time to track strategies' success or discover trends and patterns that will lead to improvement opportunities. For this reason, businesses use quarterly sales report templates to track growth based on a target, a specific market, a geographical area, or any other relevant sales-related process.
After analyzing, monitoring, and evaluating the most prominent KPIs through a quarterly sales report, managers and sales representatives use the results to define the steps to improve in the next quarter. As bonus content for our examples section, we will present 5 quarterly sales reporting examples you can apply to your business.
1. Pipeline Value Forecast
Our first quarterly sales report example is the pipeline value forecast. By analyzing your historical data to find trends and patterns, this powerful sales report aims to predict the sales value of your business as well as the performance of your sales representatives for the next three months.
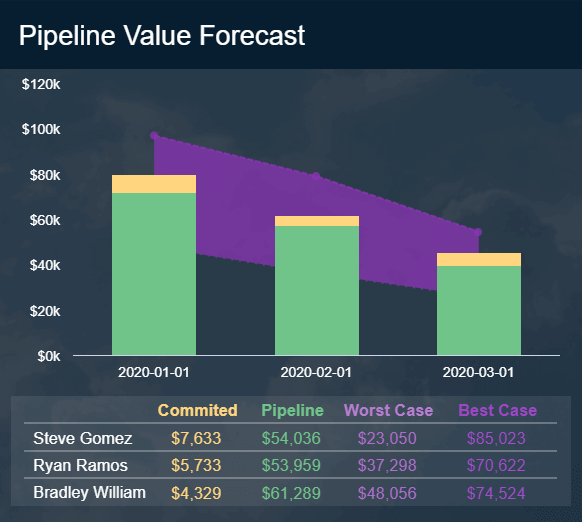
The predictions consider not only the value of your sales pipeline but also your committed deals, which can also include old clients upgrading their contracts, as well as a worst- and best-case scenario for each value. By getting these predictions, you can quickly understand if you are on the way to meeting your sales targets or if you are facing some underperforming issues and implement strategies to fix them on time.
2. Sales Growth
Arguably one of the most important quarterly sales reports to track, the sales growth aims to measure the amount of revenue by sales representatives in the last 12 weeks (or 3 months).
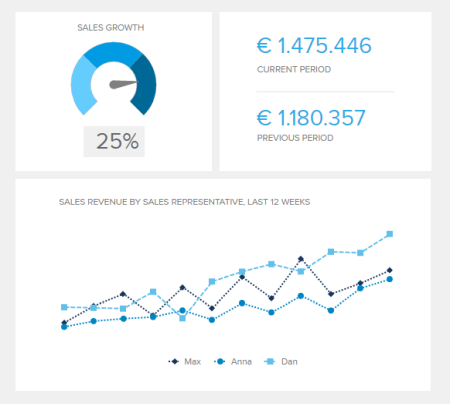
This is a relevant sales KPI to track as it allows you to drive several conclusions about your sales strategies. For instance, if each of your sales reps is working for a different target group or market, you can monitor which of them brings more revenue and focus your efforts on that target.
3. Customer Acquisition Cost (CAC)
Next in our examples for quarterly reports is the customer acquisition cost. As its name suggests, the CAC aims to track all costs incurred in signing up a new customer. These costs will defer depending on your business type and what resources you implement to acquire new customers, which can be from campaign implementation to staff salaries and other related costs.
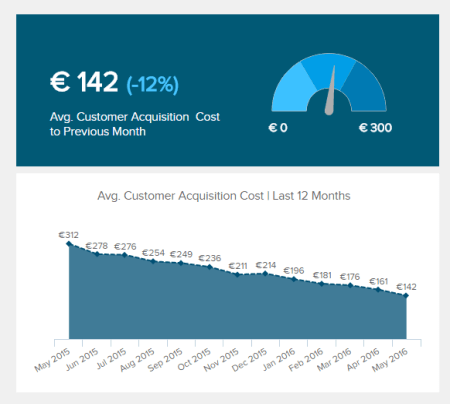
In the report example above, we see the CAC tracked for a year. However, tracking it on a quarterly basis will allow you to fine-tune your strategies before bigger issues affect your entire revenue. It is recommended that customer acquisition costs should be recovered within less than one year of your customer's subscription. The goal should be to keep your CAC as low as possible while increasing your customer lifetime value.
4. Revenue & Profit per Product
Product profitability is arguably the most important quarterly sales report any business offering products should use. When we talk about a profitable product, we mean that it gains more money than its production costs. If a business sells a very expensive product with a low-profit margin, then it may not be worth the effort.
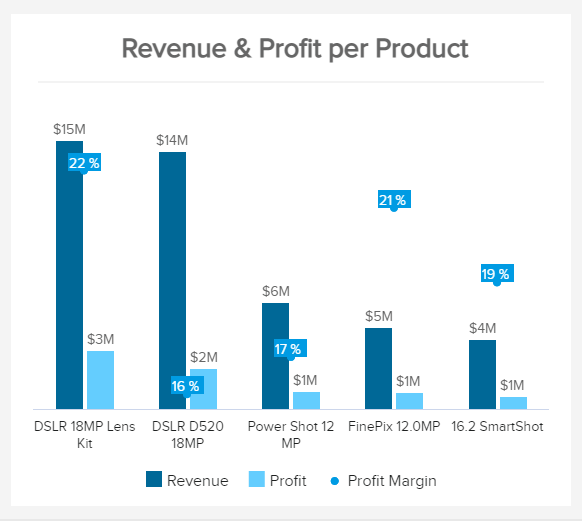
In the template above, we can see that the DSLR D520 18MP product has the lowest profit margin and the second-highest revenue. Meanwhile, the product FinePix 12.0 MP has a way lower revenue and the second-highest profit. These important insights can lead decision-makers to focus their efforts on more profitable products or tweak their strategies to improve the least profitable ones.
5. NPS by Sales Representatives
When it comes to sales, customer experience should be a top priority. How customers interact with salespersons or answer questions can significantly influence their final purchasing decision. With that in mind, our next quarterly report example is the net promoter score by sales rep tracking how satisfied your customers are with the service provided by your sales employees.
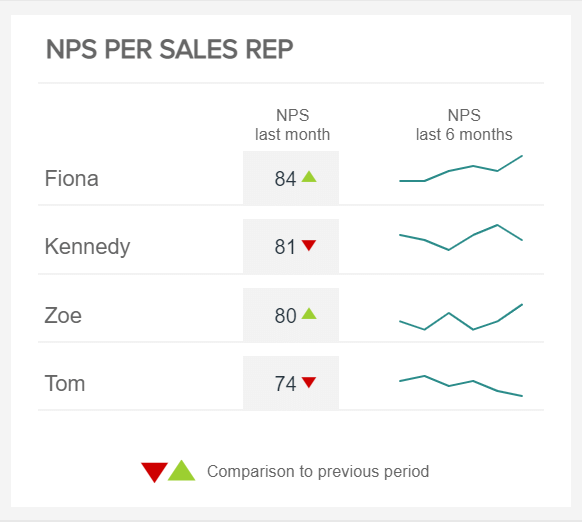
What makes this sales report valuable is its visually appealing nature. Just by looking at the numbers with the red and green arrows, managers can easily understand if a rep is underperforming. Additionally, the trend lines for the past six months provide deeper insights into previous performance to extract conclusions and support employees who are struggling.
Explore our 14-day free trial & benefit from great sales reports today!
In The End, What Should A Sales Report Include?
To sum up this long and rich article, here is a list of what you can find in a sales report:
- An overview of the sales operations and activity of the company
- Specific sales KPIs tracked and analyzed to assess said activity
- A determined time period over which the KPIs are analyzed
- Graphs and charts to visualize all the data collected
- An executive sales summary for top management
As we’ve said in other posts, it’s important not to overwhelm yourself with new business processes all at once. Instead, choose the KPIs you think will be the most useful for you and your team and implement those. Then, after a month or more of using those reports, you can add them to your reporting – or keep them where they are. For more reports, you can look at our previous article on sales graphs and charts and find more inspiration!
Knowing where to start with reports is the precondition to creating effective dashboards that will enhance your decision-making and bring your business forward. To see by yourself and start building your own reports, give a go to our 14-day free trial!