Analytics, BI Dashboards & Reports for Twitter
Explore, Visualize & Communicate Twitter Data With StyleTAKE ADVANTAGE OF OUR POWERFUL TWITTER CONNECTOR
CONNECT YOUR TWITTER DATA WITH A FEW CLICKS
Twitter analytics provides you with insights that help you understand how the (paid) content you share is received. It measures different metrics evaluating the impact of your posts in terms of reach, engagement, or conversion. It also allows you to understand your followers, their interests, behavior, and activity. All of this helps you grow your business.
With datapine’s Twitter connector, use every piece of information you have to draw the big picture you need. Gather all that data in one centralized place and start analyzing them conjointly with other social networks’ data to understand your social impact.
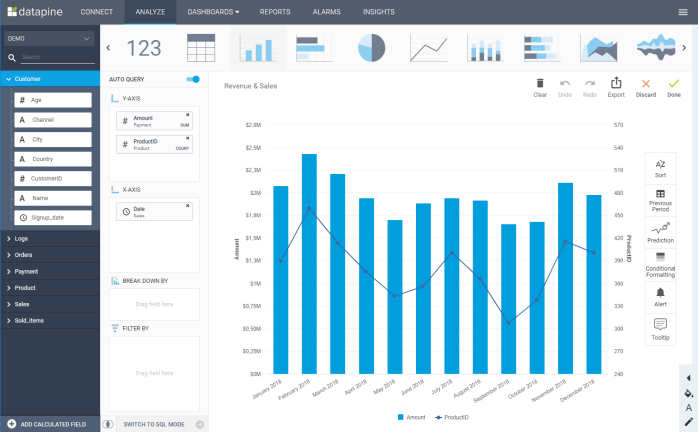
BUILD INTERACTIVE DASHBOARDS & BENEFIT FROM ADVANCED TWITTER ANALYTICS

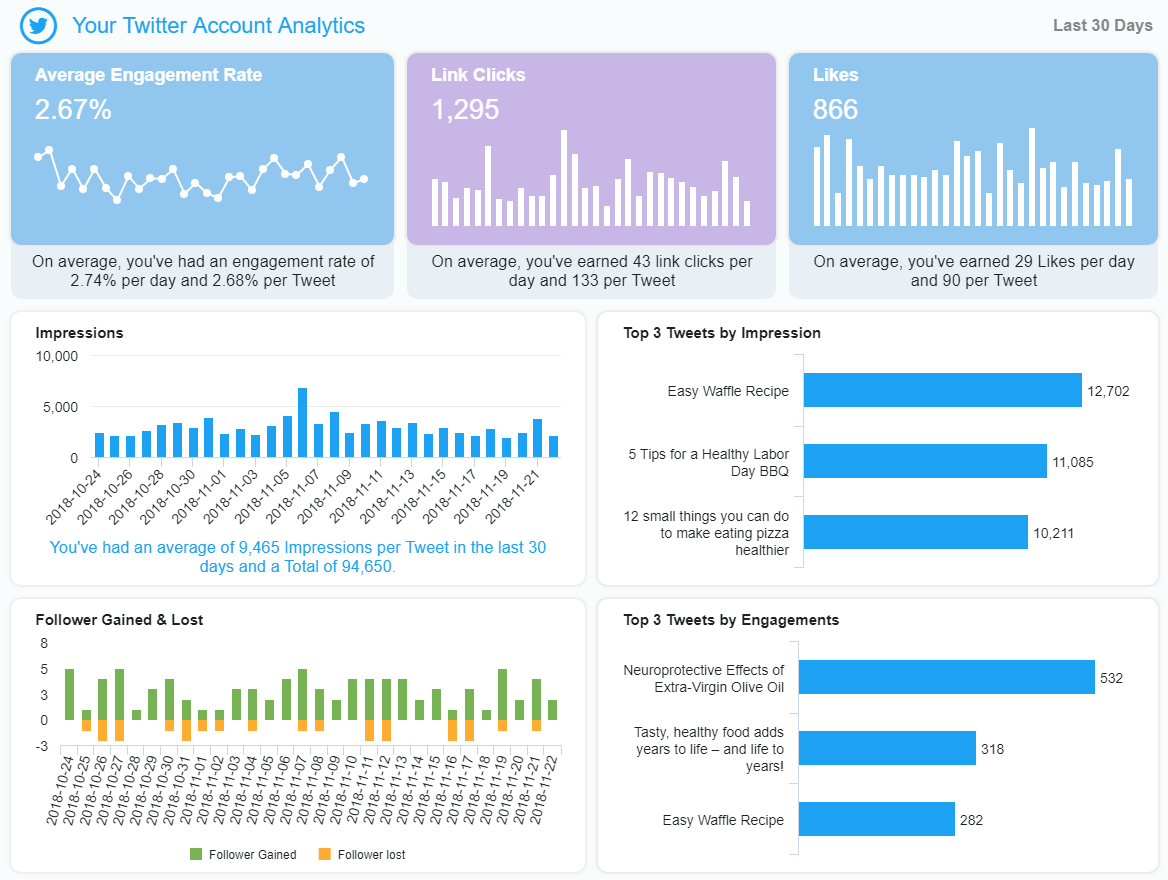
With a Twitter Dashboard in between your hands, you will easily monitor all the metrics you need to have the big picture of your social activity. Easily build the graphs and charts that tell the story that lies within your data, and visualize all your KPIs in a snapshot. Dashboards make it simple to comprehend what’s behind your Twitter data: with all these insights at your fingertips, you can learn about your audience and target them even better. Combining it with other social media information, you will have an even better overview of how your posts are working across platforms, and will hence know where to improve your activity.
Become a data wizard in less than 1 hour!
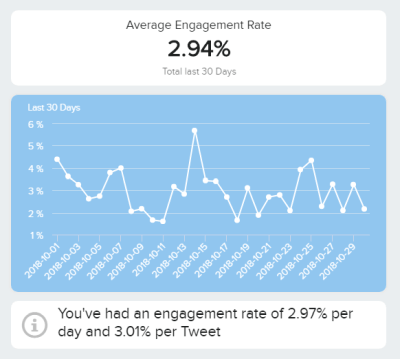
SHARE YOUR KPIS WITH OUR TWITTER REPORTING
Twitter reporting is made fast and easy with datapine. By using every piece of information you have and mixing it with the rest of your marketing insights, you’ll be able to leverage your data to create a 360° view of your marketing activities. Combine everything in one place, to ease the analysis and give more context to your data world.
What’s more, with datapine’s reporting software, you can easily share all your findings with your teammates to enhance communication and collaboration. Together working on the same reports, you will speak the same language and have everyone on the same page.
BENEFIT FROM THE INTUITIVE USER-INTERFACE OF OUR TWITTER ANALYTICS
Get started with datapine’s Twitter analytics and fully enjoy our powerful and easy-to-use BI solution. Take advantage of advanced cross-database analysis, as we offer you native connectors to almost every data source. The intuitive drag & drop interface enables even non-technical user to dig into data and glean actionable insights from it. We make data discovery easy for everyone and enable you to be independent from your IT department to answer critical business questions. Setting up our software in a couple of clicks will gather all your data in one central place, and let you provide access to everyone who needs it, empowering each member of your team to work on analytics and visualize complex data.