The Top 10 Website Metrics To Track For An Outstanding Website

Marketing is a highly data-driven department in the company. The digitization of everything made it even easier for marketers to understand consumer behavior, even if it comes with a price: data overload. Having a website online doesn’t mean increasing your visibility to a wider audience anymore; it means to learn who that audience is, their interests, how they behave, and take advantage of that knowledge to customize their experience as much as possible. Website traffic metrics help you measure nearly everything happening on your website, allowing you to adjust and optimize it to improve its performance. The best way to manage all this data efficiently is to use a dashboard software, that let explore, monitor and report your data easily without prior knowledge. You can build marketing dashboards in no time and share your insights with your team with a few clicks.
By tracking the right website metrics, you can assess and identify relevant patterns within your data. This is highly valuable because without measurement, marketing becomes a guessing game: how would you know the level of success (or failure) of your various campaigns, if you do not check the results? Web analytics metrics are critical when it comes to adjust and developing a solid marketing strategy. Let’s go over 10 important metrics you should track to ensure your website’s success.
The 10 Website Metrics You Need To Measure To Improve Your Website Performance
1) Overall Traffic: Number of Visitors And Their Sources
**click to enlarge**
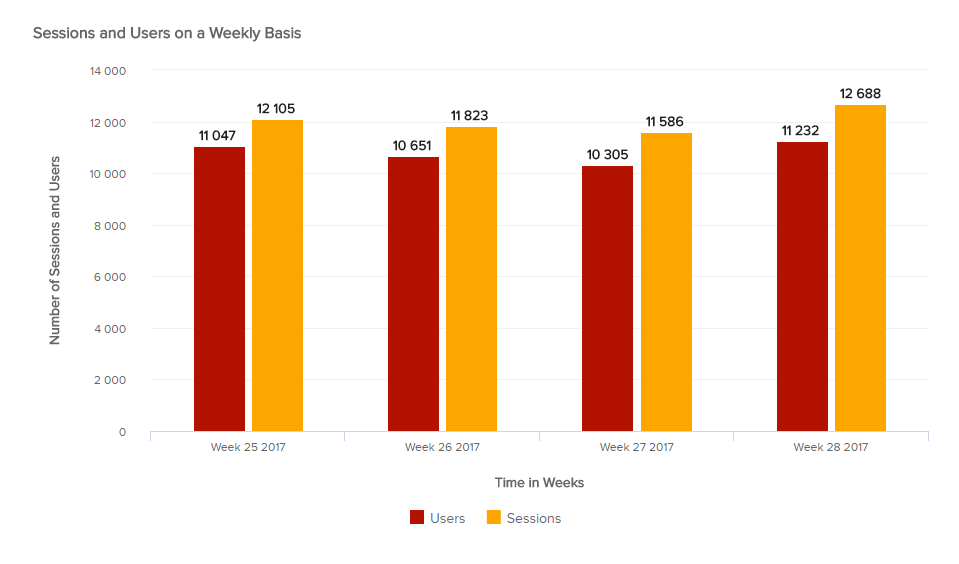
To start with, the most important of these web analytics metrics is the number of people coming to your website: your traffic. The number of sessions counts every user that comes to your website over a certain time, and this audience is divided into two distinct parts: the new and the returning visitors. The returning visitors are the people who came twice on your website within that specific timeframe.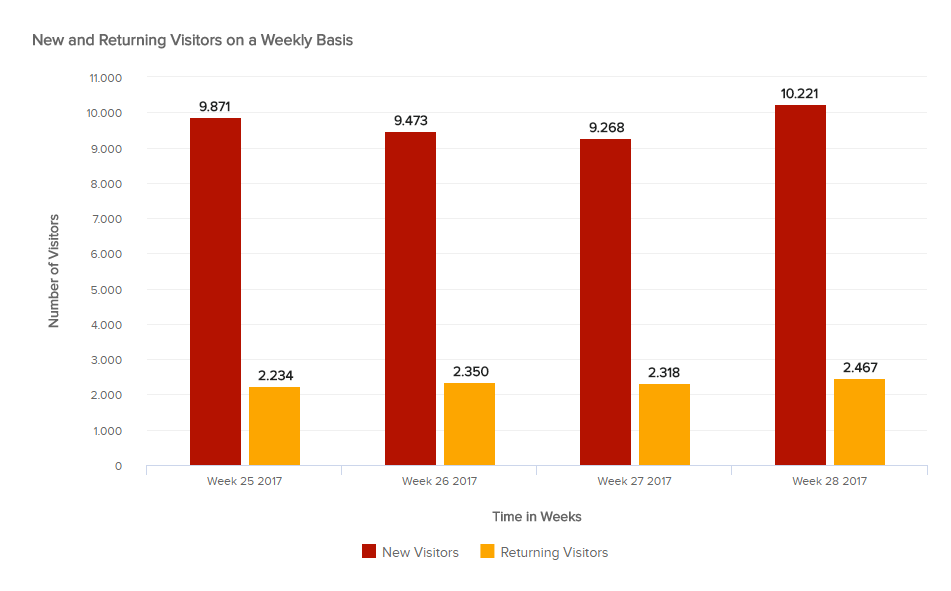
**click to enlarge**
Returning visitors is a good website metric to see if your efforts are paying off: it tells you whether your design and user experience is attractive enough for visitors to come back. Likewise, if you decide to change your content or structure and that you see a drop in returning visitors, it might translate a problem preventing recurring visits.
**click to enlarge**
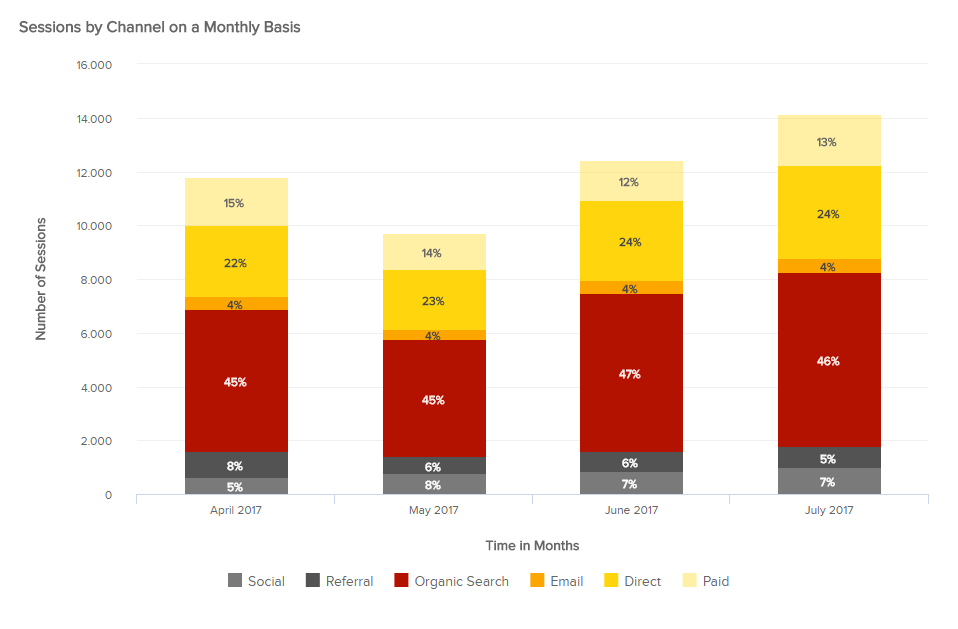
Another interesting aspect to evaluate with website traffic metrics is where your visitors are coming from: search engine (and so, organic traffic)? Referrals (people coming from links on other websites)? Social media platforms? Directly from the URL bar? Email campaigns? Understanding how people find your website is a valuable information for you to know where to put time, efforts and money. You can evaluate this metric along another one that will be detailed further in this article: the conversion rate. Parallelizing the traffic source and how well they convert will help you allocate your resources even better!
2) Visitors Demographic
**click to enlarge**
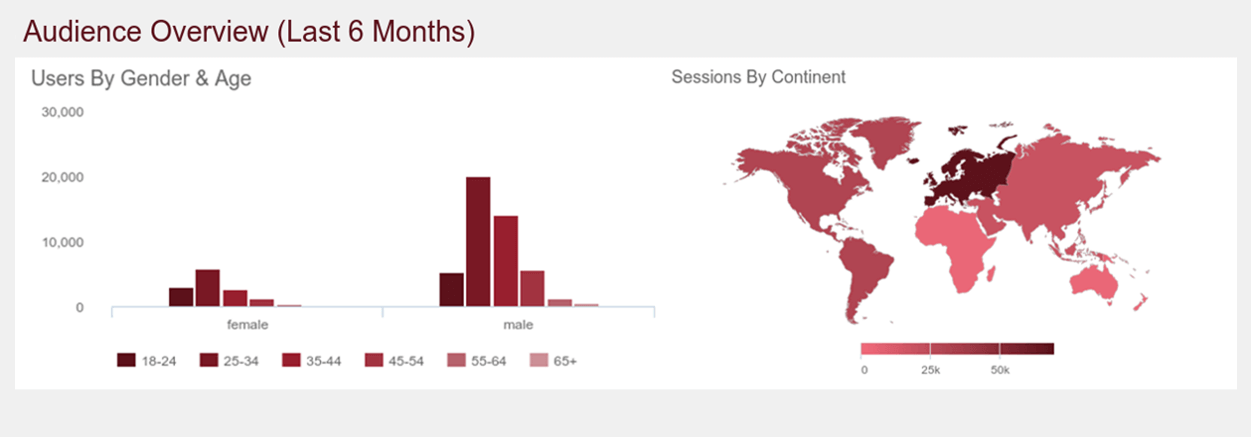
Now that you know how many people visit your website, if they come back, and where they come from, you might want to know more about them ‘individually’. Our second website metric focuses on the demographic of your visitors, ie. their age, gender, geographic location and language, and which device and system they use when they are on your page.
If you investigate who comes on your page, you will be able to refine your strategy by targeting your audience better. Indeed, the way you would address users of 18-25 years of age, using mainly mobile at any time, and people over 55 who are visiting during business hours from a desktop device will be drastically different. Your marketing and advertising campaigns will only get better with the right customization.
Besides, it will help in terms of content planning for your blog and website, so as to reach the maximum of people possible. Finally, it will also help in the design of your website: if most of your traffic comes from mobile devices, you better have a mobile-friendly, responsive design, otherwise you will drive your audience away.
3) Mobile Traffic vs. Desktop Traffic
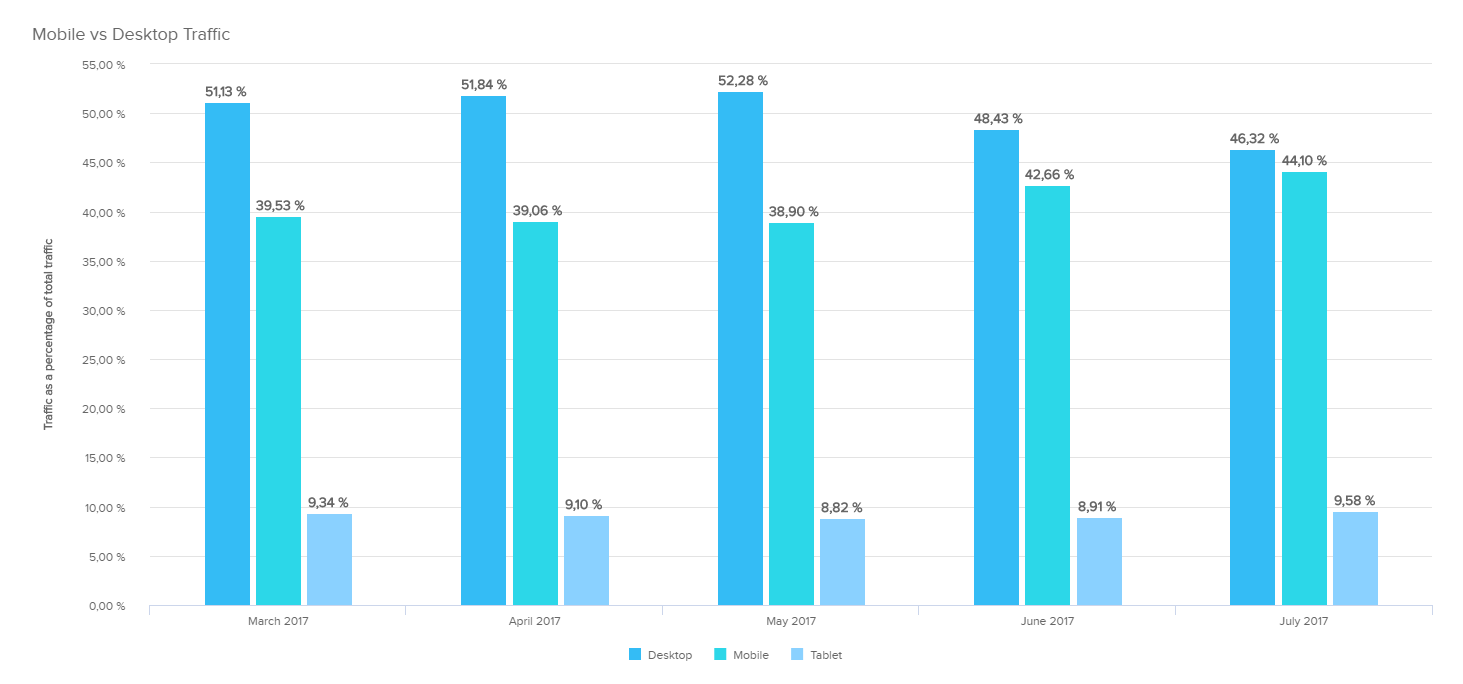
**click to enlarge**
This pretty straightforward website metric compares the traffic coming from mobile and tablet devices to the one coming from desktop computers. Tracking these figures is extremely important for the design of your website, that should adapt to your audience’s habits. Since late 2016, mobile traffic has overtaken desktop traffic, which translated a massive change in consumers’ internet habits: now, people are reachable everywhere, at any time – or almost. While that was great news for marketers, it became a real challenge for webmasters: they then had to create two or three versions of a website (adaptive design) to ensure people with different screen sizes had a good user experience. Website owners also developed responsive design, one layout that changes according to the device used, so that users have the optimal viewing experience. Responsive design is the best way to develop a website today, as now Google uses the mobile version of a webpage “for indexing and ranking, to better help our – primarily mobile – users find what they’re looking for”, they reported in a blog post.
We all remember the infamous Mobileggedon, this Google algorithm update in 2015 that infuriated webmasters as it gave priority to mobile-friendly websites for people researching on smartphones and tablets. That caused potential drop in page rankings, which inevitably hurts a company’s chance to get new customers.
However, you might lack time and resources to develop several versions of your website. If you see that barely a fifth of your audience comes from tablets and smartphones, the return on investment might not be worth it. But if you realize that a third or more are non-desktop visitors, you might want to actually get down to it and develop a mobile-friendly page that will have higher a higher probability to convert visitors into customers and not drive them away. This mobile traffic also highly depends on your product, industry, and audience. When it comes down to ordering food delivery, mobile is preferred (an app-development even more), but it deals with buying a software, or even ordering products on Amazon, users are more likely to come from desktop traffic.
4) Page Load Time
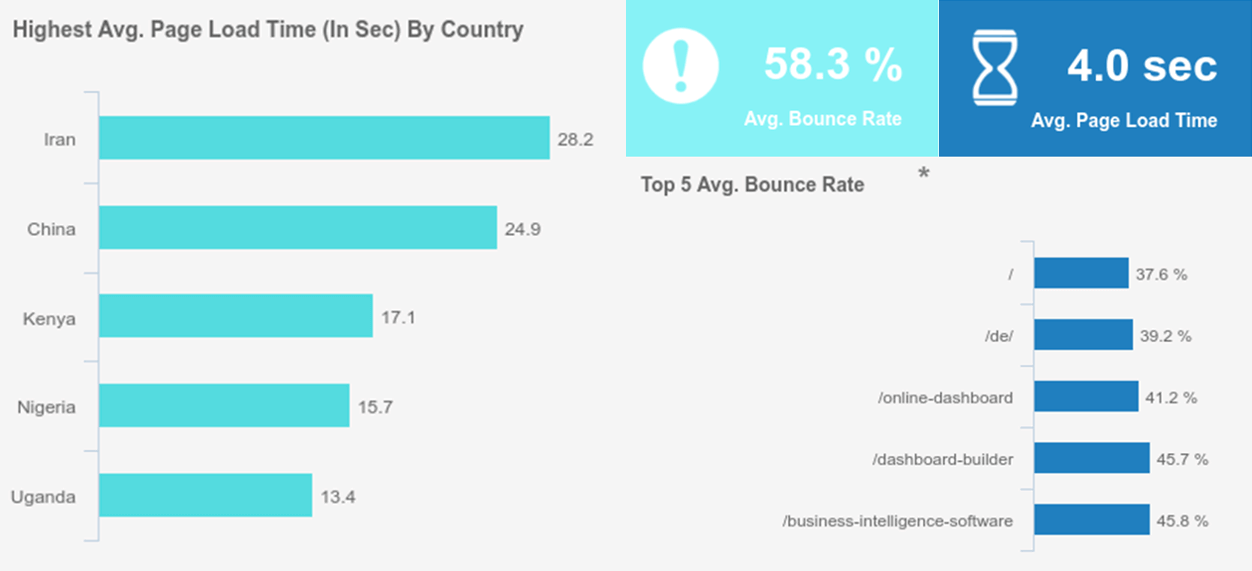
**click to enlarge**
Among the various website metrics, this one is particularly important nowadays, when the attention spans are getting shorter. Customers quickly make their opinions on a company’s professionalism judging by its website. They show interest in your business already by coming on your website – if the first thing they get is a blurry logo, or slow-loading welcome message, you are likely to give them a rather ‘meh’ impression.
Make sure your average load time – or the time it takes to load most of what you can see within the browser screen – is as low as possible, so as not to drive users away. To do so, you can use speed insights tools that will give you a grade on how good your pages are optimized for mobile and for website, with the pain points that need to be improved for a faster load time, that will inevitably reduce your bounce rates. In case of high bounce rates on certain pages, the page load time is definitely something you should check.
Another ‘hidden’, less known issue of a long load time is your overall SERPs ranking. From an SEO point of view, Google Adwords takes the user experience into account when crawling websites, and slow load time impact negatively. It is therefore highly important that you optimize your website as much as you can so as to maximize the chances to get better rankings, as it impacts them negatively especially for mobile traffic. However, it might not always be depending on you: sometimes, the internet is just slow to deliver in Mexico a content hosted on a server in Australia – but there’s a solution to that: a CDN. The CDNs are Content Delivery Networks, and their mission is to virtually shorten the physical distance between visitors and websites servers by storing a cached version of its content in multiple geographical locations. Each location, or points of presence (PoP) possesses a certain number of caching servers in charge of content delivery to visitors within its proximity. That way, the latency is considerably reduced (and the user satisfaction increased!).
In general, you should check your page load time according to two characteristics: your different important landing pages, because they are the one you want to keep an eye on, but also the different geolocations, especially when you are an international brand.
5) User Behavior Metrics: Bounce Rate, Session Duration & Pages Per Session
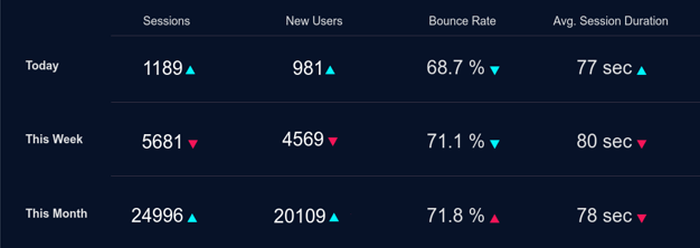
User behavior is another wealth of knowledge that will help you improve your website greatly. As a starting point, you can analyze user behavior thanks to three web analytics metrics (even if there are more to do so): the bounce rate, the average session duration and the number of pages visited per session.
The bounce rate corresponds to the percentage of single-page sessions on your website, that is to say the percentage of users leaving your website directly from their entrance page, and thus viewing only one page. The number of pages per session counts how many pages a user saw before leaving, while the session duration evaluates how long, on average, users spend on your site.
However, there are specificities for some these website analytics metrics that need to be detailed – namely for the session duration. It is also important to go further in the analysis and parallelize the metrics results, instead of looking at each result separately and try to deduce a behavior.
To start with, the calculation of session duration by Google is a bit skewed: it divides the session duration by the number of sessions – everything looks fine so far. The problem is that Google cannot measure the time a user spends on the last page of a website before he or she lefts. So, if a session has only few pages visited, the loss of the last page visited can have a big impact on the total session duration. If website has a high bounce rate – while the time spent on the entrance page could be of 30 minutes – the session will be counted as 1 but the time as 0. Because Google uses the time of the next page viewed to calculate the time spent on the current page, it is impossible to know how long people spend on their last (or only) page before exiting.
This is why it is important to look at your session duration in parallel with your bounce rate, as it cannot give you a real assessment of user engagement alone. A high bounce rate might indicate a ‘bad’, not engaging content or a misleading advertisement. It is tricky as it might also translate an efficient design, where people found what they wanted directly on the first page. This is why you should also evaluate it along other website analytics metrics. In general, you should aim for a bounce rate under 40%. If it’s above 55%, you need to find out the reasons why people leave straight away. But again, it depends on many different factors: your industry, the landing page concerned, its goals, etc. What you should also scroll down, if the bounce rate is high, is the scroll depth of said page. That will provide you more information on the users’ behavior and interaction. We will talk about scroll depth later in this article (see next point).
With a low bounce rate and a high session duration, you know that the quality of the traffic is good, and you can compare these results for different traffic sources to know which one brings a higher quality audience. But in general, if your bounce rate is high (over 80%), the session duration will be inaccurate.
6) Website Interaction Metrics: Click-Through Rate of CTAs & Scroll-Depth
Our sixth website metric focuses on the interaction users have on your page, namely with the buttons you intentionally create to convert prospects into leads: the CTA or call-to-action.
Your call-to-action can vary depending on your strategy, your objectives, and of course your product/service/industry. It can be a button to click to download a whitepaper, it can be trial to register to, or a newsletter, or an advertisement. Each of these CTAs that you created needs to be tracked for you to know if they are not only efficient, but also to compare which ones are working better.
To do so, you will look at their CTR, or click-through-rate, that measures the ratio of clicks on your CTA to the impressions it had (or the number of views). To analyze this metric, you might want to benchmark the CTRs of other companies in your industry, and compare how you perform against them. You can also compare your CTR to your historical previous ones, and see the evolution – especially after you have performed changes on the call-to-action. These changes clearly need to be assessed to learn from them and reproduce a best practice. A change in a CTA can be related to the color of a button or pop-up, the text displayed, the image, the placement, the design, the offer itself, or all of them combined. Before changing them all at once, think about changing them individually in separate testing, otherwise you will not know what is impact really. Conducting A/B testing on different content pages with similar traffic, and offering different placements and design can help you determine which factors are leading to a CTA’s success.
Another thing you can evaluate is scroll depth your visitors have on your page. This measures how far down on a page they get to – 25% , 50%, 75% or 100% of your content, meaning that they read it all. This is mainly a mobile metric, since scrolling is the primary way of getting through content with a smartphone or a tablet. It is used as a “proxy” engagement metric to help you gauge how engaged a user is – and thus where to place best your advertisement / CTA.
Scroll-depth can also help you restructure your content better so as to organize it more efficiently: if users scroll all the way down to the bottom to then click on an FAQ, that may translate an impossibility for them to find what they’re looking for. In general, scroll-depth is a good engagement indicator when you have long-form content like for a blog article for instance.
7) Conversion Rate
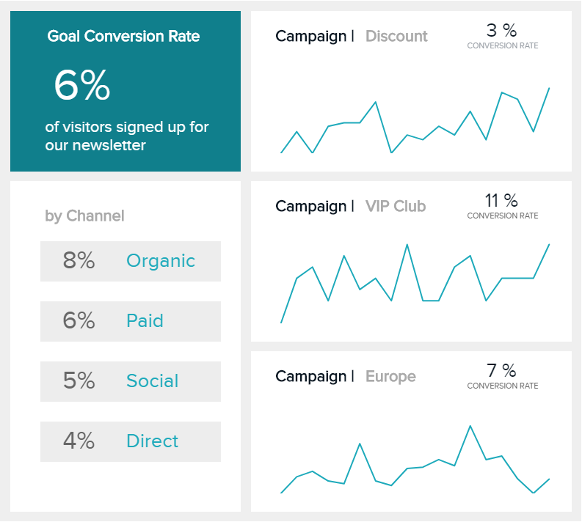
Our seventh website metric is the conversion rate. It measures the percentage of visits that resulted in the desired action you have pre-set: purchasing something, downloading a whitepaper, subscribing to a newsletter, etc.
As you can see, these conversions are different from one another, so you cannot put them all under the same umbrella and count them under the same goal conversion. Different pages of your website can aim at different conversions: for instance, a blog might want to get subscribers to add to its list, while a product page might aim at registering new users for a trial. Goal conversion is the main metric showing you if your website fulfils its business objectives.
One thing you can do with these goal conversions is to segment them according to different criteria to understand your audience and its behavior. You can segment the conversions per channel, and see which ones are bringing in the best results. You can also look at the conversion rate of various landing pages. Landing pages are very important and you should fine-tune them at the maximum to make the most out of them. Keep in mind, of course, that if you compare landing pages to one another, their goal conversion should also be comparable: clicking on a video usually works better than typing in email and name for a registration.
8) Top Landing Pages Per Sessions & Time on Page
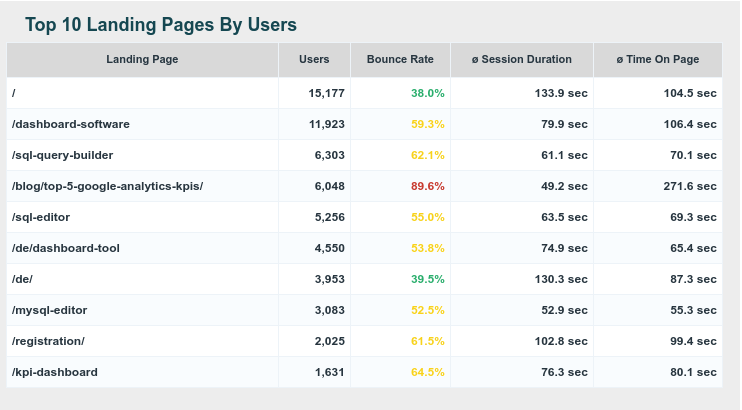
**click to enlarge**
You are spending time to develop an efficient landing page that will promote lead generation, or convert a prospect – but are you checking if all these efforts are paying back?
Like most of the web analytics metrics discussed above, ranking your landing pages according to certain criteria will provide you insights on the efficency of your work, and if it fulfils its goal. Measuring the number of sessions daily, weekly, or monthly and watching the evolution will let you know more about the audience behavior: do they visit more on the weekdays or weekends? Are there spikes or snaps in traffic after a promotion? Compare your landing pages between them to see what content (especially for a blog) is working more than other, so as to reproduce such best practice.
Tracking how long your visitors are staying on a landing page is also important: for blog articles, educational website with courses, etc, a longer time on page means that the content you provide is valuable to the reader. However, as we have seen before, this website metric is also a bit skewed because of the way Google measures it, but it is still a bit more accurate than the average session duration – all the more when your bounce rate is under 50%. Indeed, Google calculates the time on page with each click to another page, as each click carries a timestamp (hour, minute, second), that helps the calculation. It gets wrong for the exit page though, which is not taking into account as it does not have a “next timestamp”. The formula to measure it is Average Time on Page = Time on Page/(Page views – Exits). But Google tries to balance that flaw by counting only users that had an interaction with the page, ie. excluding bounces – and that’s the main difference with the session duration, and that is what makes the time on page relatively more accurate. On our example above, we see that for the blog article on 5 google analytics KPIs, the difference between time on page and session duration is massive: 49.2 seconds for the former and 271.6 seconds for the latter. When we look at the bounce rate, we realize that it is of almost 90%: it means that for the session duration, 90% of the data is calculated with "0" as Google cannot measure it!
To track these metrics more easily, because Google does not display the time on page and requires the creation of a specific segment, modern dashboards provide interactive dashboard features like conditional formatting that will let you see what you want and how you want it. If you want to track specific events and be aware of any spike or low of a bounce rate for instance, setting up data alerts that will warn you of any change as soon as they happen – you can then react accordingly without loosing time.
9) Top Referral Domains
The referral domains, as we have seen in the first of our website metrics with the (Overall Traffic), are the website that send visitors to your page. It is link juice that is very important for several reasons: first, and that applies especially if the referral has a high domain authority, it will help you rank better on search engines; and secondly, it will paradoxically reduce your dependence on search engines. Having many links pointing at you shows that you are doing good work and provide valuable content. Be careful though with bad linking, like paying to have your links on website that have nothing to do with your industry or product, or being referred by a low authority spammy domain – it is sanctioned by Google.
Knowing who is referring you often and sending a lot of traffic towards your website might show you where to allocate resources for an advertising campaign, to take advantage of an audience that is already interested in you. It also lets you know if you are doing good work in terms of PR, and if your guest blogging featuring your brand pays off in terms of traffic. In general, checking the list of referrals allows you to identify better the interests of the audience coming from these sites, what they are reading usually (their landing pages), letting you optimize your content for them and convert them into customers!
You must study every aspect of your referrers carefully, to avoid capitalizing on irrelevant referrers. The quality of the referral traffic is another thing you should pay attention to, so as to know what are the best referrers. Checking how your social media campaigns are working, if they send traffic to your website and of which quality is another best practice.
Finally, look at which of your pages are the most referred. If they also are on the top landing pages list, it means that it is the best content that you’ve got, where you should focus your conversion efforts and that you also should reproduce.
10) Retention Rate
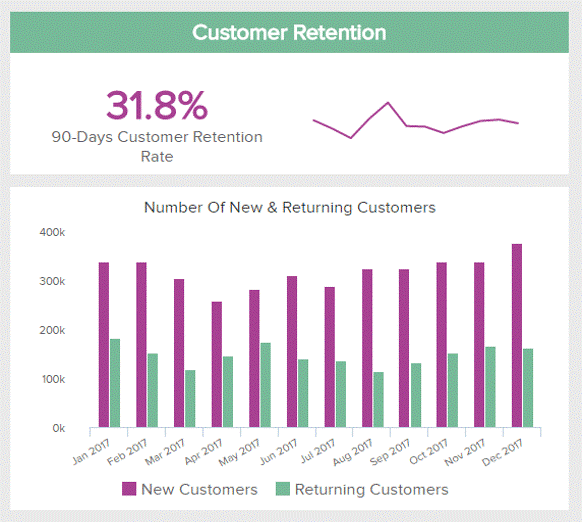
Finally, the last of our website traffic metrics concerns ecommerce and other merchant websites, where the users can also purchase on it.
The retention rate is a highly important customer metric, since acquiring a new customer costs 5 times more than retaining an old one. Besides, already-existing customers are more likely to refer you to friends and family, helping you to grow your customer base through trusted advisers. The retention rate can be calculated on a weekly, monthly or annual basis . It measures the capacity of your business (and website) to generate a recurring revenue from your already-existing clients: over a specific period of time, divide the number of returning customers by the total ones, and you have your ratio.
The retention rate varies greatly according to the nature of your business and your industry, that’s why you should compare it to similar companies’ retention rates. A car dealership will probably very few returning customers over a month or a year, or even two – this is why it can’t be compared to a brand in fast-fashion. In any case, the objective is to keep the retention rate as high as possible.
Website Metrics Illustrated: A Google Analytics Custom Dashboard
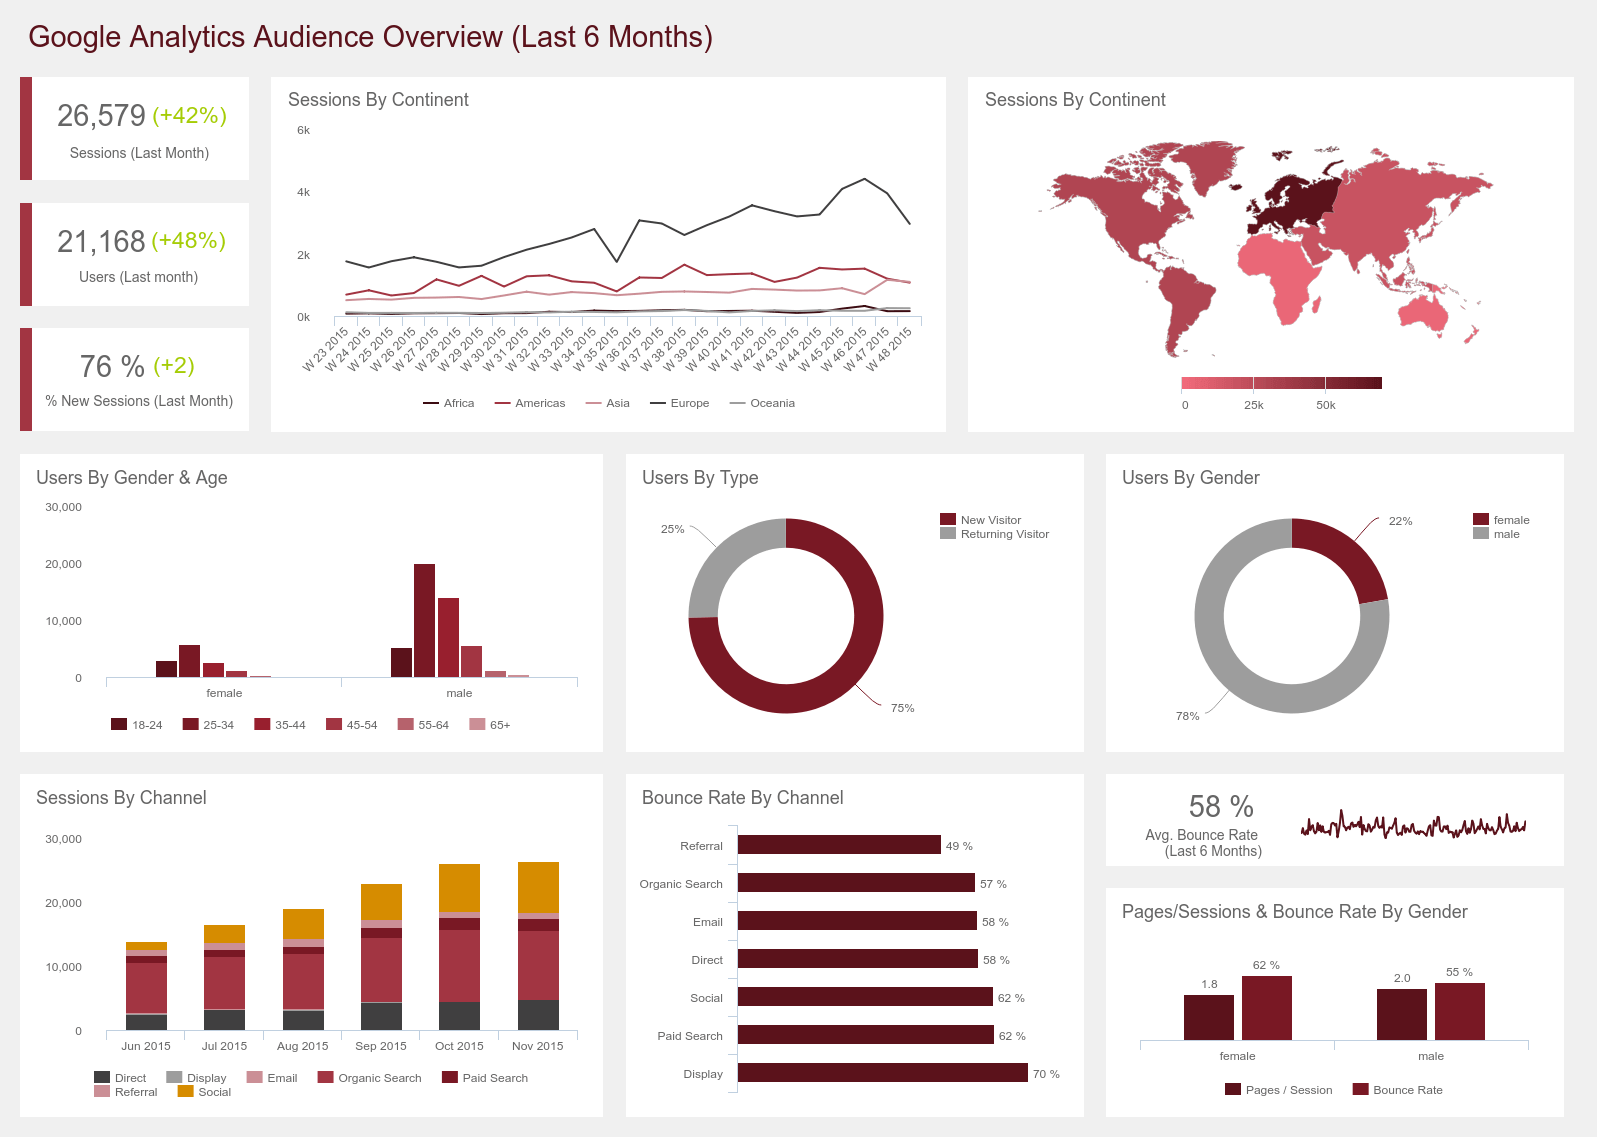
**click to enlarge**
We have seen all along this article that website metrics are plentiful and varied. They let you measure many different aspects of your website for you to understand better what is functioning and what isn’t, who is coming and how. All these insights will let you optimize it the best way you can so as to improve its efficiency and rank better on search engines.
On the dashboard above, you can see an illustration of a thoughtful utilization of some of these website traffic metrics. It focuses on the audience of the website by detailing their demographics, analyzing their behavior (sessions, channel sources, pages per session as well as bounce rate). To discover more professional dashboards like this one, take a look at our article on Google Analytics dashboards.
To track and manage all these metrics, opting for a marketing analytics software is the best solution. It lets you play around and create professional business dashboards visualizing your data in no time, giving you more room to focus on what you can do best: marketing, website optimization, content production, you name it. And it also comes with a 14-day free trial for you to test and see by yourself.