
KPI Examples for the Logistics Industry
Logistics Key Performance Indicators and Metrics
✔ See different templates & designs ✔ Find & track the right logistics KPIs to meet your corporate objectives
A logistics KPI or metric is a performance measurement logistics managers use to track, visualize, and efficiently optimize all relevant logistic processes. Among others, these measurements refer to transportation, inventory, warehouse, and supply chain aspects.
The logistics industry produces huge amounts of data on a daily basis coming from warehousing processes, orders transportation, picking and packing, among others. That said, companies that benefit from logistics analytics solutions to improve their performance are the ones that will thrive in the long run. To help you accomplish this type of success, we put together a list of professional logistics metrics that will not only ensure that your business’s operational processes are running smoothly, but will also help you optimize costs while still maintaining a quality service. If you want to extract deeper insights from these metrics, put them together in a logistics dashboard with the help of a professional dashboard tool and take advantage of powerful data visualizations.
Here is the complete list of the most important logistics KPIs and metrics, that we will discuss in this article in every detail:
Shipping Time: Spot potential issues in your order fulfillment process
Order Accuracy: Monitor the degree of incidents
Picking Accuracy: How many orders are picked without errors?
Delivery Time: Track your average delivery time in detail
Pick & Pack Cycle Time: Track the time it takes to pick and pack your orders
Order Cycle Time: Monitor the time it takes to ship an order
Equipment Utilization Rate: Is your equipment enough for your workforce?
Trailer Utilization Rate: Monitor the percentage of trailer space being utilized
Transportation Costs: Analyze all costs from the order placement to delivery
Dwell Time: Reduce the time drivers are waiting to drop off or pick up orders
Inventory Carrying Costs: Track all related costs of storing unsold inventory
Warehousing Costs: Optimize the expenses of your warehouse
Pick & Pack Costs: Monitor all costs related to your pick & pack process
Operating Ratio: Track the profitability of your operations
Use of Packing Material: Optimize your materials usage
Number of Shipments: Understand how many orders are shipped
Inventory Accuracy: Avoid problems because of inaccurate inventory
Inventory Turnover: Track how many times your entire inventory is sold
Inventory to Sales Ratio: Identify a potential overstock
Shipping Time
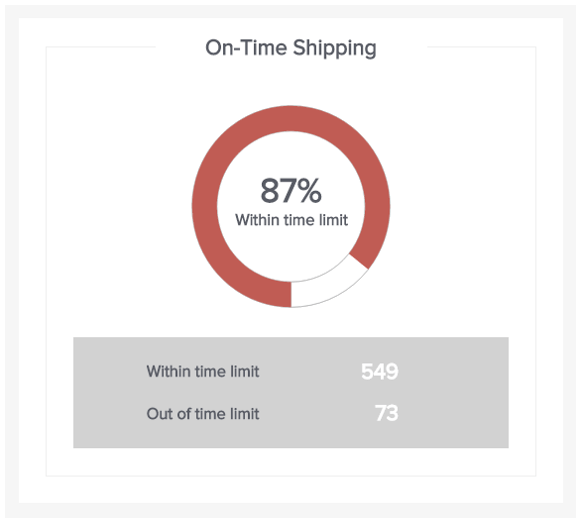
Spot potential issues in the order fulfillment processThe On-Time Shipping metric refers to the ratio of orders that have been shipped on or before the requested ship date divided by the total number of orders. This is a first logistics KPI to help you measure your supply chain performance. Indeed, if the amount of time between the moment the customer places his order and the moment that order is prepared to be shipped is too long, that can show some trouble in the process that needs to be fixed. Whether it is outdated planning processes or disconnected execution systems too slow to face an increasing demand, the issues need to be addressed to quickly answer unexpected events.
Performance IndicatorsAfter realizing a benchmark of the average time, you need to ship a certain type of order, such as setting a target shipping time relative to each product to achieve.
Relevant Showcase Dashboard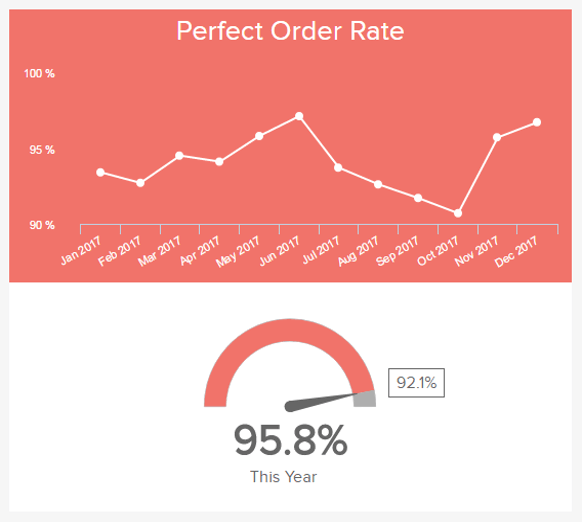
Order Accuracy
Monitor the degree of incidents in your warehouseThe Perfect Order Rate is another highly important logistics metric when it comes to your supply chain efficiency. It measures the number of orders that are processed, shipped, and delivered without any incidents on their way. The shipping time as well as the delivery time are both respected, the order is not a wrong one and the goods are not damaged. It is important as it shows the efficiency of your supply chain and delivery services, leading to more satisfied clients that are willing to come back or recommend your services.
Performance IndicatorsThe higher this rate, the better it is for your business. You will lose less money from returns of inaccurate or damaged goods, and increase the level of satisfaction of your customer base.
Relevant Showcase Dashboard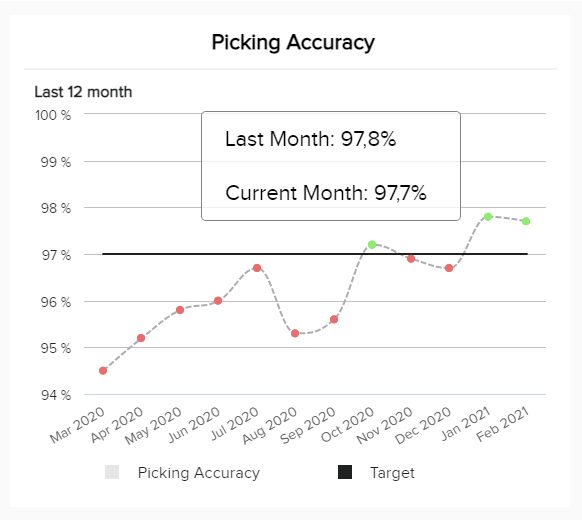
PICKING ACCURACY
How many orders are picked without errors?The picking accuracy is another warehouse KPI related to the quality of your pick & pack process. The aim of this metric is to track the percentage of orders picked without errors from your total number of orders, and it is calculated with this simple formula: (Total orders – Returns due Wrong Item) / (Total orders). This metric directly affects customer satisfaction levels since it ensures customers will receive the correct item from their order. Additionally, a higher picking accuracy will save money on relocating wrong shipped items. Therefore, companies should make sure to monitor it constantly.
Performance IndicatorsMeasure the picking accuracy based on your returned products but also do random checks of picks to ensure no mistakes are made.
Relevant Showcase Dashboard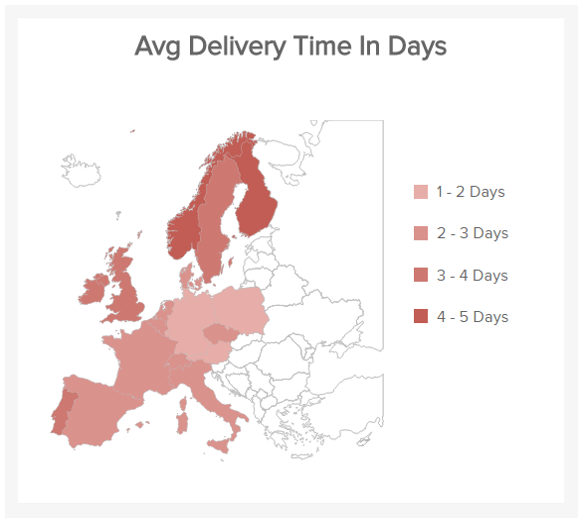
Delivery Time
Track your average delivery time in detailThe Average Time Delivery is measured from the moment the order is placed to be shipped and the moment it is delivered to the customer/post office. After benchmarking and having an idea of the average delivery time from your warehouse to anywhere, the goal would be to decrease it when possible - offering special delivery services for instance - but more importantly, to specify it. For example, saying that an order will arrive in 4-5 business days is better than saying it will arrive in 1-to-5 business days. Additionally, if you can precise the delivery hours (between 13h and 15h rather than between 8h and 18h), it is even better. That way, your customer knows when he should be home to pick the package up, increasing your order picking accuracy rate and avoiding returns.
Performance IndicatorsThis is a typical logistics KPI example to narrow down and precise as much as possible for a better service.
Relevant Showcase Dashboard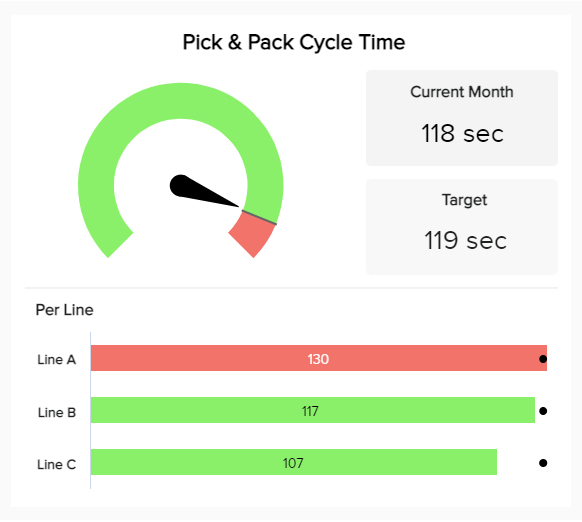
Pick & Pack Cycle Time
Is your pick and pack cycle efficient?The pick & pack cycle time is a logistic KPI that tracks the time it takes an employee to pick an item from a shelf to the time the packing process is done. This metric is calculated by dividing the total amount of time by the total number of items picked and packed in a set period. In the example, we see that the development of each line is being tracked based on a target, and that line A is a bit above it. This is valuable information as it allows you to take a deeper look into the process of that line and find out what could be delaying the pick and pack. Measuring each line of work separately also enables you to try different strategies for each and see which one is the most effective.
Performance IndicatorsSet realistic targets to track your pick and pack cycle time based on your total number of orders and the workforce available.
Relevant Showcase Dashboard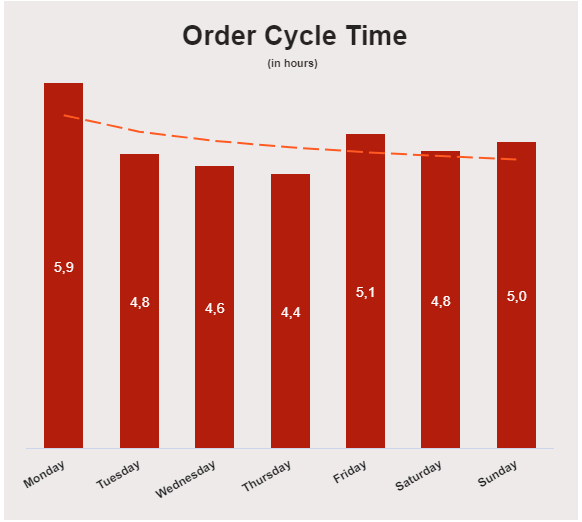
ORDER CYCLE TIME
How long does it take to ship an order?The order cycle time is one of the most important logistics KPIs to track, as it can highly influence customer satisfaction levels. It measures the average time it takes to ship an order from the moment it was placed to the time it leaves the warehouse (without considering the shipping time). A long order cycle time can shine a light on inefficiencies within your supply chain that can result in negative on-time shipping and perfect order rates, hence, negative customer satisfaction. For that reason, tracking this metric closely and assessing each area of your supply chain process is important to ensure everything runs smoothly and orders can be shipped without issues. For example, you can evaluate if there are any bottlenecks in the picking and packing process or think about automating the order-receiving process to avoid manual errors that can lead to delays.
Performance IndicatorsLook into other logistics metrics, such as the picking accuracy or the average dwell time, and find improvement opportunities to keep the order cycle time as low as possible.
Relevant Showcase Dashboard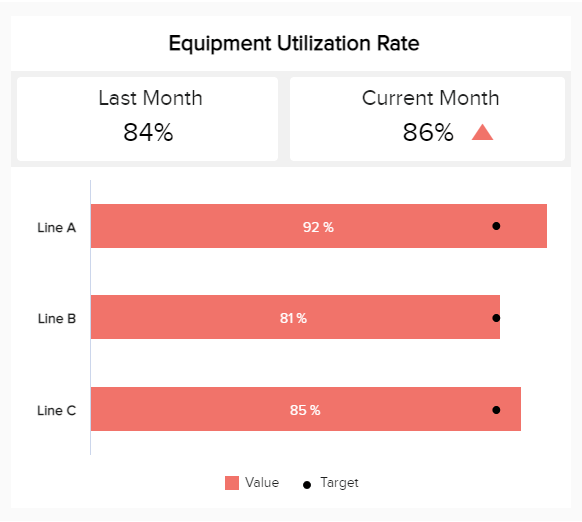
EQUIPMENT UTILIZATION RATE
Is your equipment enough for your workforce?Next in our list of logistics metrics examples comes the equipment utilization rate. Although employees are the ones doing the heavy work, technology and equipment are fundamental aspects of the efficiency of any warehouse process. The image above displays a percentage of the equipment usage in each line of work based on a target of last month’s performance. In this case we can see that lines A, and B are over the target and that C is at the limit, this could mean that an investment in more equipment might be needed to improve performance in this area.
Performance IndicatorsA healthy equipment utilization rate should be between 70-90% as this ensures that your employees are not waiting in line to use the equipment.
Relevant Showcase Dashboard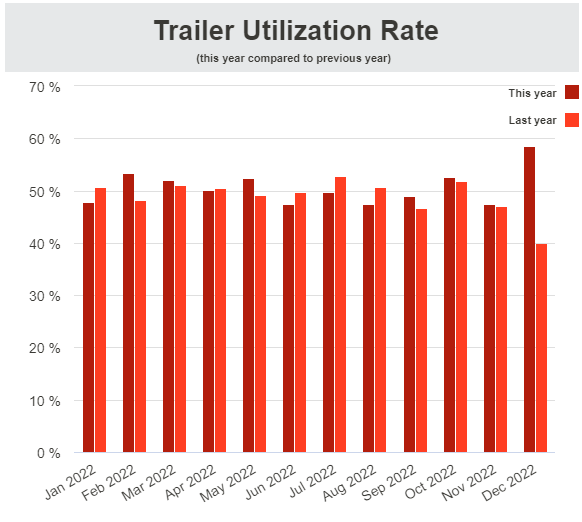
TRAILER UTILIZATION RATE
Monitor the percentage of utilized trailer spaceAs its name suggests, this straightforward KPI tracks the percentage of space that is being utilized on your trailers each month. Considering that every centimeter of truckload capacity that is not being used represents a lost revenue opportunity, extra money wasted on fuel, unnecessary wear and tear for trailers, and more, monitoring this rate regularly is of utmost importance. It can help you maximize the potential of your trailers to the fullest while minimizing expenses with efficient planning. By organizing your order shipping based on trailer utilization you can realize that you actually only need 80% of the trailers you currently have available, which translates into a significant decrease in costs.
Performance IndicatorsImplement different strategies and compare your trailer utilization rate monthly to observe positive or negative effects.
Relevant Showcase Dashboard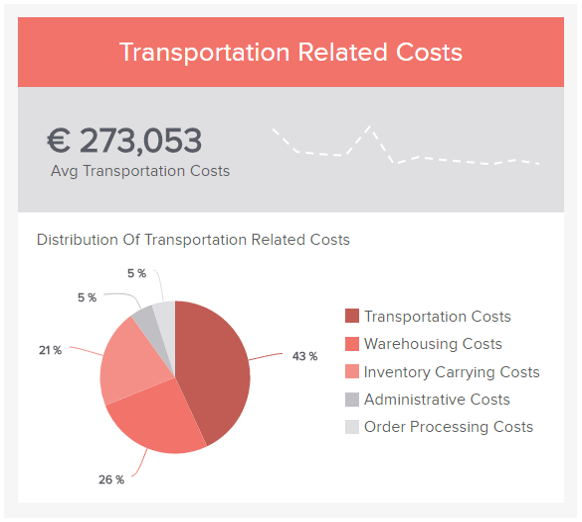
Transportation Costs
Track costs from the order placement to its deliveryThe Average Transportation Costs calculates an overall of the expenses involved in processing an order from the beginning to the end. It will break down all the costs related to this logistics KPI according to distinct categories: the order processing, the administrative, the inventory carrying, the warehousing and finally the actual transportation costs. After calculating all these, you can evaluate the percentage each stage of the process represents and see if that is excessive or in the norms. You can also calculate the transportation costs relatively to a product and see how much one item costs compared to how much revenue it brings you.
Performance IndicatorsThe goal is to decrease the transportation costs while maintaining a high quality of delivery.
Relevant Showcase Dashboard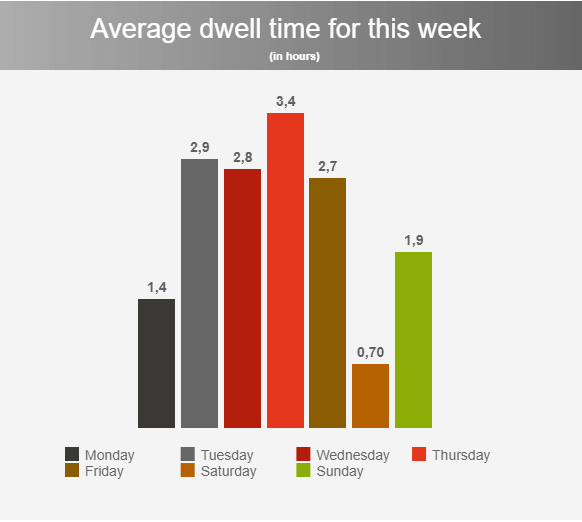
DWELL TIME
Reduce driver’s waiting time to pick or drop ordersNext, in our logistics KPIs list, we have the average dwell time in hours by day of the week. Also known as “detention time,” this metric tracks the average time drivers spend in the warehouse waiting for orders to be loaded or unloaded from the trailer. It is an important indicator to track as it can significantly influence the overall efficiency of the supply chain and its profitability. Multiple elements can cause long dwell times, such as vehicle delays, loading complex or heavy orders, tedious check-in processes, and order volume, among others. Keeping a close eye on each of these elements can help you stay on top of any issues and ensure dwell time stays on average. For instance, preparing in advance for days with high volumes of orders can prevent delays.
Performance IndicatorsHaving some level of dwell time is unavoidable and should be considered in your shipping plan to avoid issues with shipping partners and customers.
Relevant Showcase Dashboard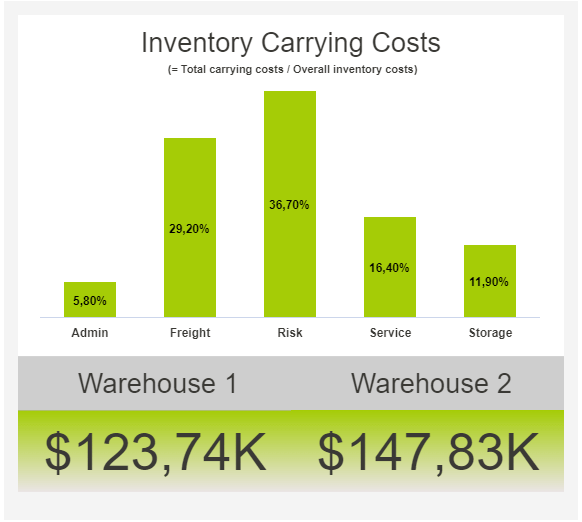
INVENTORY CARRYING COSTS
Track all related costs of storing unsold inventoryThe inventory carrying costs track all related expenses of storing unsold inventory and it is one of the biggest challenges for efficient inventory management as it can directly affect profitability. These costs can be related to keeping products shelved in storage facilities for a long time, labor salaries, transportation, taxes, insurance, and even investment opportunities that the company might lose because of resources tight to unsold inventory. That being said, your carrying costs can account for around 20-30% of the total inventory value. Therefore, it is fundamental to track this KPI regularly as it can help inform production strategies, inventory ROI, and a company’s financial statements.
Performance IndicatorsA good practice to keep carrying costs at a minimum is using predictive analytics tools to forecast demand and decide your inventory levels on that.
Relevant Showcase Dashboard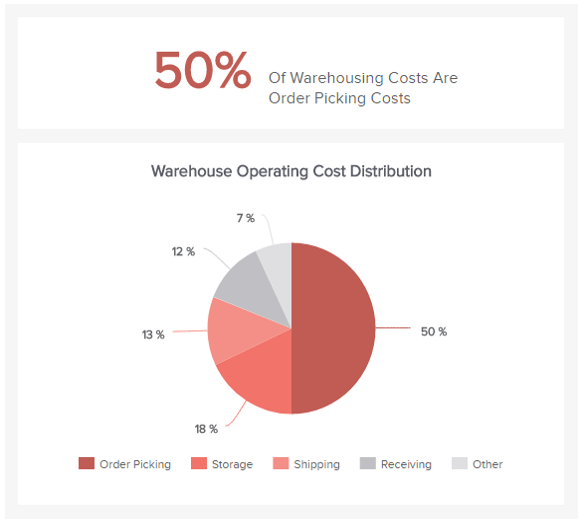
Warehousing Costs
Monitor the expenses of managing your warehouseWarehousing is the management of space and time. The Warehousing Costs refer to the money allocated to the goods moved into or outside the warehouse. These expenses cover equipment and energy costs like ordering, storing, and loading the goods, as well as more human-related one’s like labor, shipment, or delivery. The warehousing costs are a component of another logistics KPI, the total transportation costs. Measuring them is not easy, but once it is done, it will facilitate your overall management and add a lot of value, something that senior management or investors will appreciate.
Performance IndicatorsThe warehouse being the main area of your business, it is important to measure and review the costs on a regular basis, so as to improve your operations and evaluate such improvement.
Relevant Showcase Dashboard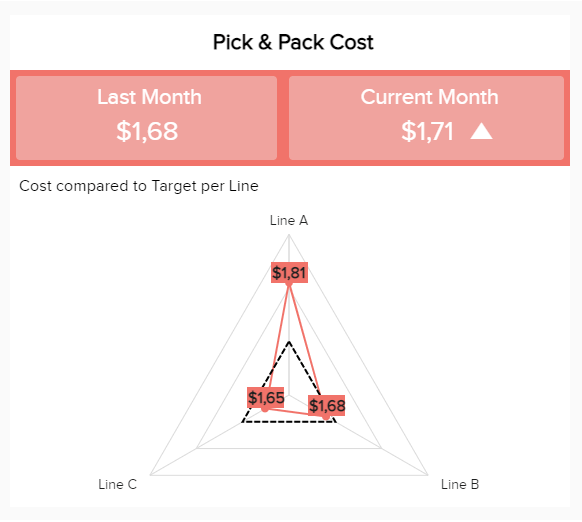
Pick & Pack Costs
Monitor all costs related to pick & pack processesOur next logistic KPI example is the pick & pack costs. This metric aims to measure all cost aspects related to the picking and packing of your orders - for example, the workforce, the packaging materials, or equipment. Your final goal here should be to keep costs as low as possible. Therefore, monitoring this KPI will be useful to understand if you are spending more resources than needed in the entire process. The pick & pack costs can also be analyzed more deeply by dividing it into products or product categories, this way you can see exactly where your costs are going up and find productive solutions for it.
Performance IndicatorsAn effective way to optimize this KPI, is to test different picking and packing methods and techniques on each line of work and see which one is more cost and time efficient for your business.
Relevant Showcase Dashboard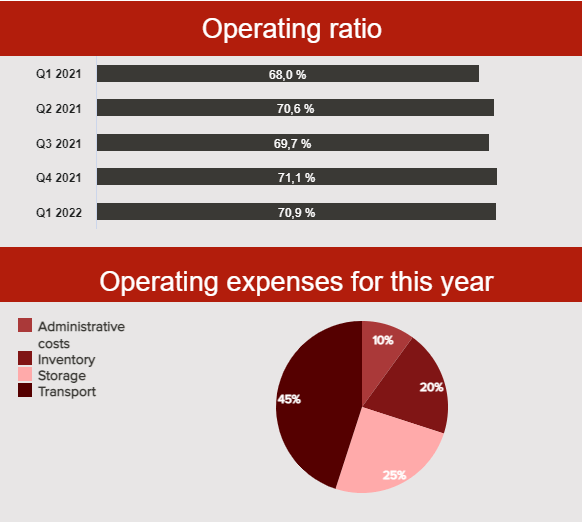
OPERATING RATIO
Track the profitability of your operationsOur next example concerns the financial aspect of a logistics department or company. The operating ratio evaluates how efficient a business is at keeping operational costs low while still generating revenue, the smaller the ratio, the better. When we talk about operational expenses, we mean all expenses directly and indirectly related to production, such as administration, inventory, storage, transport and more. Keeping these expenses as low as possible is important to ensure the business remains profitable but also to show investors that everything is running smoothly. OR is calculated with the following formula: Operating Ratio (OR) = Operating Expenses + COGS / Net Sales, and it can also be used as an indicator of performance against competitors.
Performance IndicatorsA good recommendation is to track the operating ratio over longer periods of time to identify trends and find the reasons behind them.
Relevant Showcase Dashboard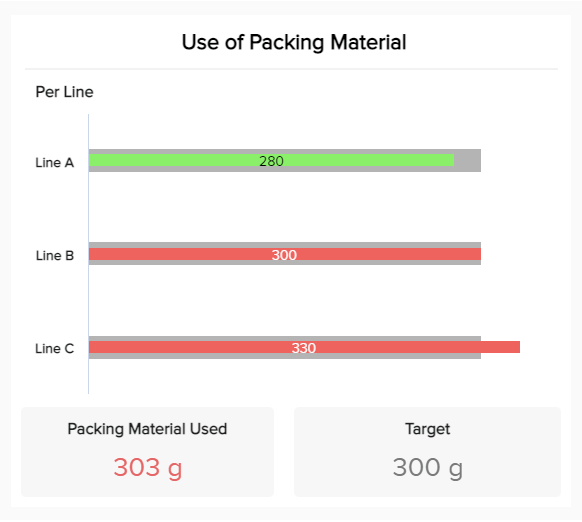
USE OF PACKAGING MATERIAL
Do you optimize your materials usage?The use of packaging material is a warehouse KPI that aims to track the amount of materials used for packaging in each line of work in your pick & pack process. This is an important metric to track since using more materials than needed can lead to higher costs but also negatively impact the image of your business for not adopting basic sustainable practices on your packaging. For example, in the image above, we see that line B and C are over the target of 300g of materials usage, this could mean they are packing small items in big boxes leading to a waste of resources.
Performance IndicatorsIn order to avoid waste of materials, set mandatory package dimensions related to the size of the item being packed. This way, you will save resources and keep your environmental impact to a minimum.
Relevant Showcase Dashboard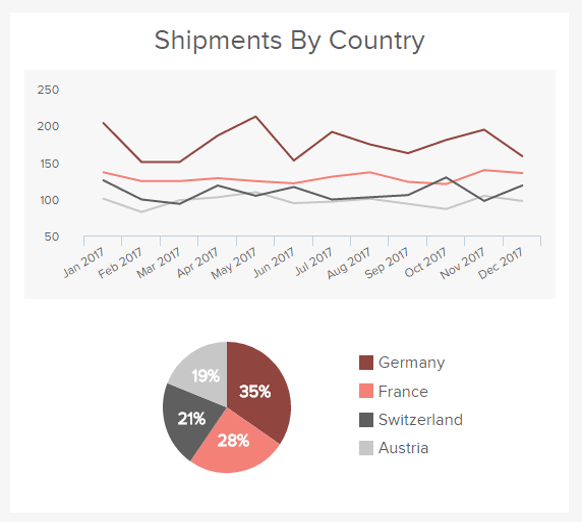
Number of Shipments
Monitor the orders shipped from your warehouseShipping is not only a matter of dispatching goods and packages in trucks or boats. Shipments are the showcase of your warehouse; their quality and the accuracy to primary order will demonstrate the quality of your service as well. The same way you measure the number of orders placed ready on time to be shipped (On-Time Shipping KPI), you can measure the number of orders shipped out of your warehouse. Analyzing the trends over time will provide great insights into rush hours or rush seasons (such as Christmas time), and enable you to anticipate and allocate more resources accordingly.
Performance IndicatorsBreaking down this figure into several categories (countries, regions, types of products) will provide you with greater information that you can use to optimize other logistics metrics, like the ones related to delivery.
Relevant Showcase Dashboard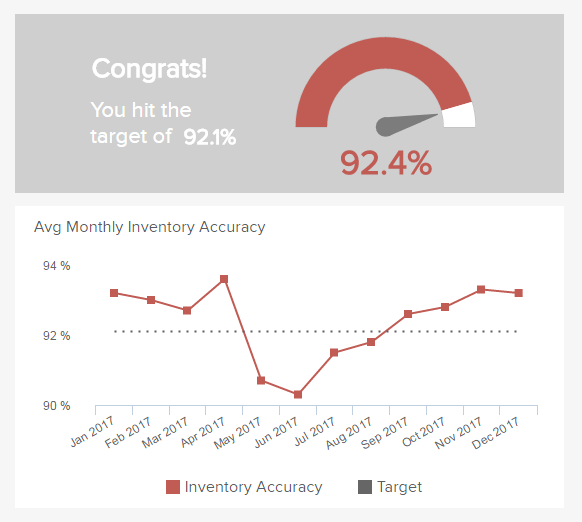
Inventory Accuracy
Avoid problems because of inaccurate inventoryInventory Accuracy is one of those logistics metrics that can make or break your warehouse. Indeed, having a certain record of all your goods in your database that doesn’t match the physical inventory can considerably harm your business. If your inventory is inaccurate, that can lead to unexpected backorders but also unsatisfied customers and more generally, higher overall costs. A regular inventory checking the existing discrepancies with your electronic inventory record ensures that bookkeeping practices are in order and that your business is reliable, avoiding phantom inventory nightmares. This ratio will also help you spot issues related to receiving, shipping, or accounting.
Performance IndicatorsOn a more realistic level, it is also normal to have some disparities between the record and the warehouse, but the idea is to maintain that ratio over 92% as much as possible.
Relevant Showcase DashboardBecome a data wizard in less than 1 hour!
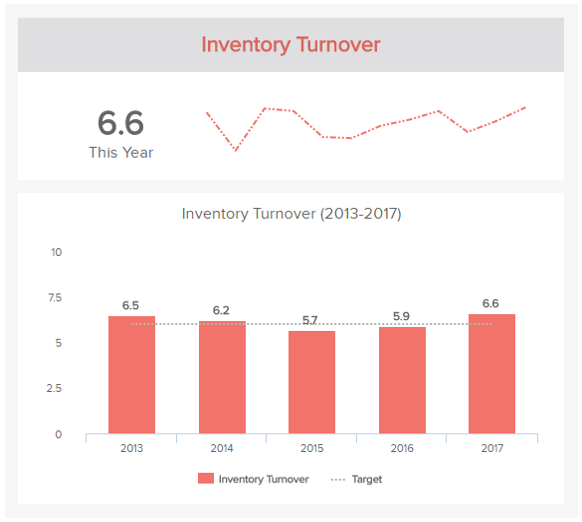
INVENTORY TURNOVER
Track how many times your entire inventory is soldThis logistics KPI measures the number of times your entire inventory has been sold over a certain period of time. It is a great indicator of efficient production planning, process, as well as marketing and sales management. In general, the higher your turnover rate, the better. A low turnover may translate to difficulties in turning your stock into revenue, and that can come from any stage of your supply chain process. There is not one general rate to achieve, as it depends on the industry your company is evolving in: a car dealership will have a lower turnover than a standard groceries store. The idea would be to benchmark your average industry rate and try to reach and exceed that target.
Performance IndicatorsAfter calculating yours, compare it to the average rate of your industry and surpass it.
Relevant Showcase Dashboard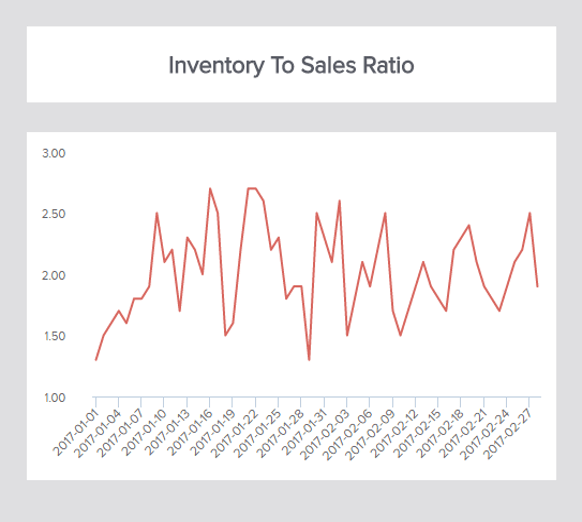
INVENTORY TO SALES RATIO
Evaluate how much inventory you carry in comparison to the number of sales performedThis logistics metric is good at evaluating overstock. It measures the ratio between the available inventory for sale and the actual quantity sold. This is a great performance indicator that will also tell you if your company is able to face unexpected situations. It is an even greater indicator if you measure and use it with other KPIs such, as Inventory turnover, or the Carrying cost of inventory. That will let you know about the financial stability of your business, but also the direction you want to take - selling your inventory as quickly as possible or not.
Performance IndicatorsAs described above it really depends on your business what your target ratio should be. Usually, you try to keep it not too high to avoid low inventory turnover rates.
Relevant Showcase Dashboard


Setup only takes a few minutes. No credit card required!