
KPI Examples for Google AdWords
Google AdWords Key Performance Indicators and Metrics
✔ See different templates & designs ✔ Find & track the right Google AdWords KPIs for successful ad campaigns
A Google AdWords KPI is a measurable, transparent performance indicator used to comprehensively monitor, analyze and optimize the performance of selected strategies and measures related to Search Engine Advertising (SEA) in the Google network over time.
Here is the complete list of the most important Google AdWords KPIs and metrics, that we will discuss in this article in every detail:
Number of Clicks: Which keywords generate the highest number of clicks?
Click-Through-Rate (CTR): How appealing do the advertisements appear?
Quality Score: How relevant are the advertisements?
Cost-per-Click (CPC): How much does a click on the ad costs?
Ad Position: How does the ad position affect the CTR?
Conversion Rate: Which campaigns convert the best?
Cost per Conversion: Which campaigns are most effective?
Budget Attainment: How exactly are budget targets implemented?
Cost per Mille (CPM): How high is the CPM for specific placements?
Impression Share: How well do your ads perform on GDN?
View-Through-Conversions: How often do users convert without clicking?
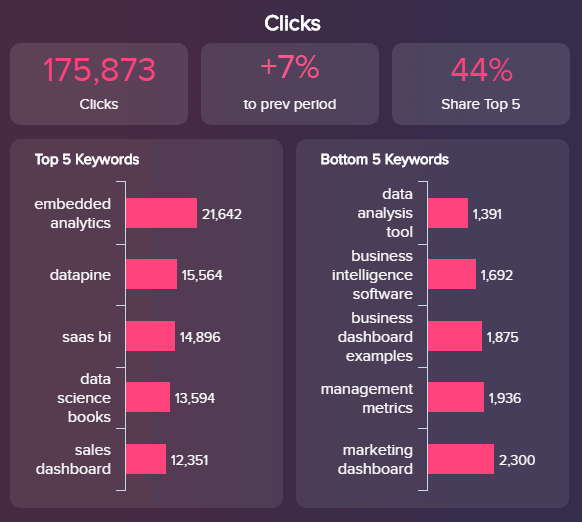
Number of Clicks
Which keywords generate most clicks?Our first Google AdWords KPI is unsurprisingly the number of clicks generated. This obvious SEA metric is very important and the basis for further analysis, because without clicks you cannot achieve any conversions. In addition to monitoring the aggregated number of generated clicks in a set time frame and comparing it with the previous period, you can get a good first impression of the main focus of your entire Google AdWords account, specific campaigns or even individual advertising groups. As an example, on the left, we have illustrated this for a Search AdWords campaign.
Performance IndicatorsAnalyze and monitor the number of clicks in the required granularity on an account, campaign, advertising group or keyword level.
Relevant Showcase Dashboard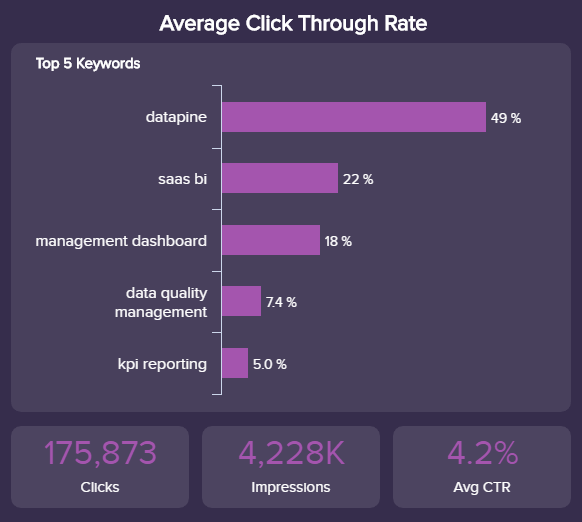
Click-Through-Rate (CTR)
How appealing do the advertisements appear?The click-through-rate (CTR) is a Google AdWords KPI that shows the ratio of clicks received on ads in relation to total Impressions. As a rule, marketers want to achieve the highest possible click-through-rates with their AdWords campaigns, as this can, for example, improve the ad position and have a positive effect on the quality score and thus also reduce click costs (CPC). In addition, a high CTR initially reflects a basic interest of the user, which can be achieved, among other things, by incorporating call-to-actions and a clear Unique Selling Proposition (USP) in the advertisements.
Performance IndicatorsTry to improve your CTR by performing A/B tests with different advertisements. Make sure that you test the smallest possible variations in the ads, such as different call-to-actions, against each other in order to be able to assign changes in performance without any doubt.
Relevant Showcase Dashboard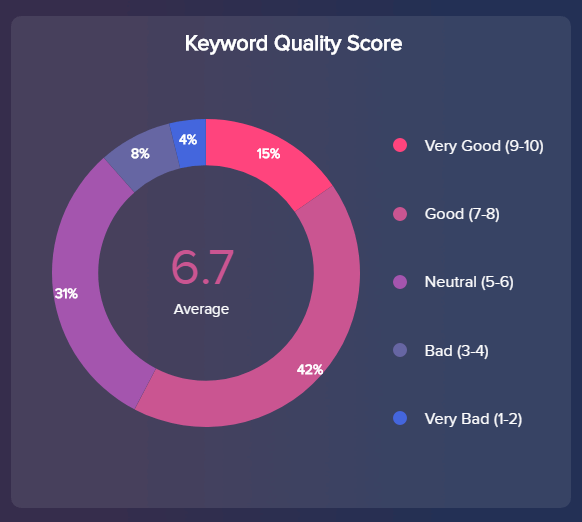
Quality Score
How relevant are the advertisements?The so-called "Quality Score" is displayed in Google AdWords at a keyword level and can take values from 1 to 10. The quality score is calculated considering 3 main factors: the (expected) click-through-rate, the ad relevance and the user experience with the landing page. In order to achieve the best possible quality factor of 10, the entire so-called "relevance chain" must be optimized: a relevant ad with the highest possible click-through-rate, but also an extremely positive landing page experience. To evaluate the landing page experience, you should consider Google Analytics KPIs in addition to the conversion rate, such as the bounce rate or time on page.
Performance IndicatorsDue to the fundamental influence of the quality score on the Ad rank, successful AdWords campaigns with low quality scores are virtually impossible. Put yourself in the position of the searcher and try to satisfy his search intention with relevant ads and high-quality content on the landing page in the best conceivable way.
Relevant Showcase Dashboard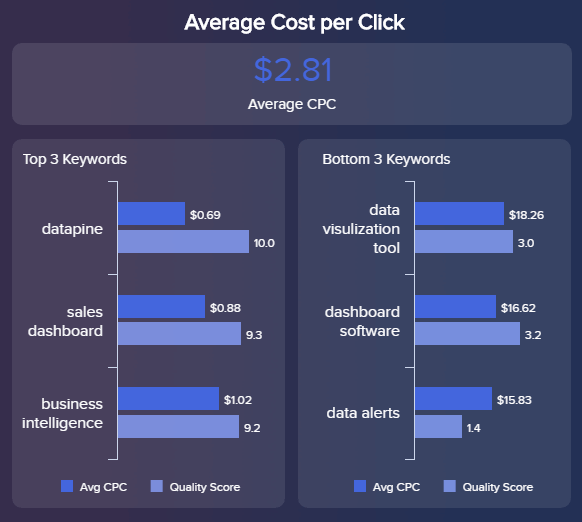
Cost per Click (CPC)
How much does a click on the ad costs?Our next Google AdWords KPI – the cost-per-click (CPC) – is a key success factor for every SEA campaign because it has a strong impact on cost-per-conversion and ROI. As a rule, the cost-per-click in Google AdWords is determined with the help of a fixed maximum bid (max. CPC), which is never exceeded. By multiplying the maximum CPC by the quality score, you will ultimately receive the ad rank, mentioned earlier, which determines the position of your ad. For display campaigns, other billing models can also be selected, such as the cost per thousand (CPM).
Performance IndicatorsTake a closer look at your keywords with the highest or lowest cost-per-click and the corresponding quality score. Check the relevance of ads and landing pages for important keywords with a high cost-per-click and / or low-quality scores.
Relevant Showcase Dashboard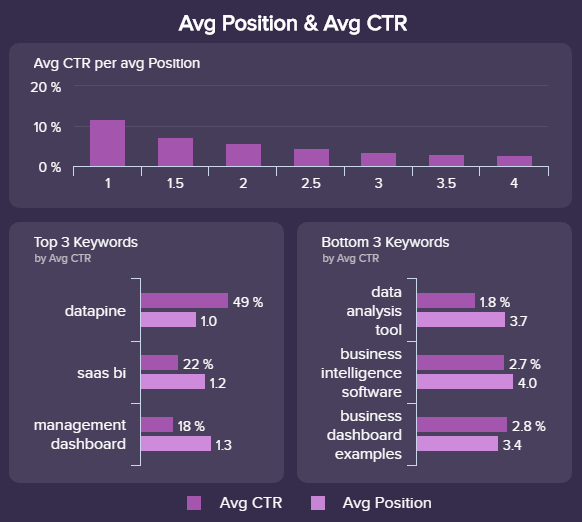
Ad Position & Average CTR
How does the ad position affect the CTR?The ad position shows you where your ad is delivered which is determined by the ad rank calculation: Ad rank = Max. CPC x quality score. The influence of the ad position on the CTR is illustrated on the right with our visual Google AdWords KPI example. In general, the average click-through-rates increase with each position, so you should never analyze the CTR of a keyword or the associated ad independently. For example, a CTR of 7% at position 4 can be considered much more favorable than a CTR of 9% at position 1. The cause of the low ad position 4 in this example could be a low maximum CPC.
Performance IndicatorsNote that ad position 1 is not necessarily always the best option. Especially for very competitive or keywords with a large search volume, a lower ad position often makes sense because of the low click costs (high quality score is a prerequisite).
Relevant Showcase Dashboard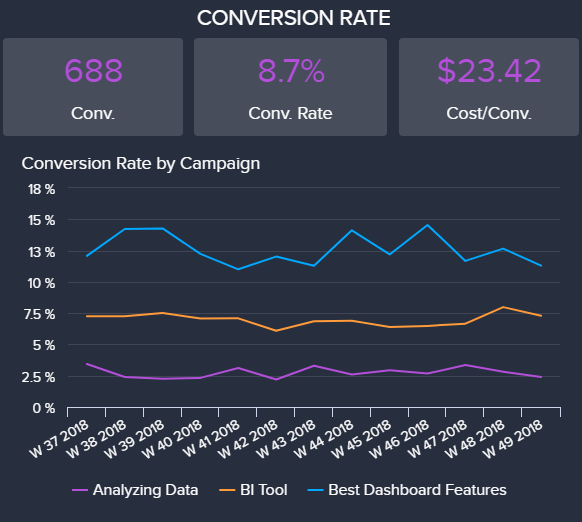
Conversion Rate
Which campaigns convert the best?With our sixth Google AdWords KPI example – the conversion rate – we are moving away from the keyword level and taking a deeper look at key performance indicators of Google AdWords campaigns. Of course, you can also view the conversion rate for individual keywords or ad groups within your campaigns. A conversion is a desired target action of the user (e.g. purchase of a product or download of a white paper) and the conversion rate, accordingly, indicates the average number of conversions per ad click in percentage. In our example, the average conversion rate is 8.7%, but for the 3 campaigns that are shown it varies between 2.5% - 15%.
Performance IndicatorsStart by analyzing your conversion rate at campaign level to get an initial overview of the performance of your individual campaigns within your AdWords account. Then you can also view ad groups or individual keywords with sufficient sample size.
Relevant Showcase Dashboard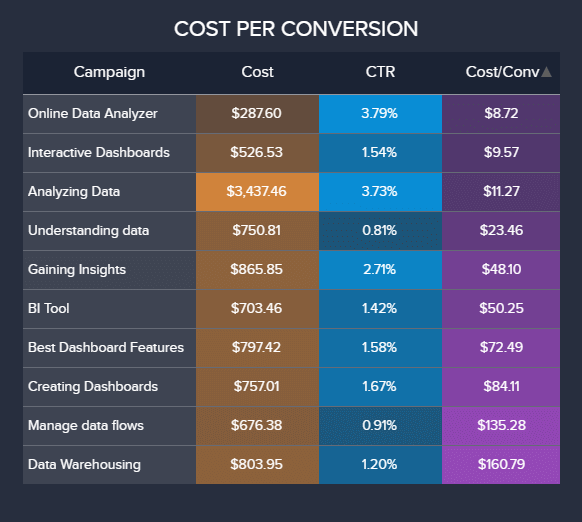
Cost per Conversion
Which campaigns are most effective?When it comes down to it, you want to use your marketing budget as effectively as possible, and the best way to do this is to compare the conversion costs of different campaigns. conversion costs are ultimately influenced by two main factors: cost-per-click (CPC) and the conversion rate on the landing page. Once again, it illustrates how important a high quality, relevant landing page is, in addition to the ad design. This has a double influence on the cost per conversion: on the one hand via the quality score (landing page experience) and on the other via the conversion rate on the landing page. You can also use this Google AdWords KPI to compare conversion costs with other SEA platforms (Bing Ads, Yahoo Ads, Yandex Ads etc.) or with other marketing channels (social media, affiliate, SEO etc.).
Performance IndicatorsDo not neglect the landing page in addition to the ad design. Avoid generic pages that do not satisfy search intends. Consider the type of search query (informative vs. navigational vs. transactional) when creating the content for the target page.
Relevant Showcase DashboardBecome a data wizard in less than 1 hour!
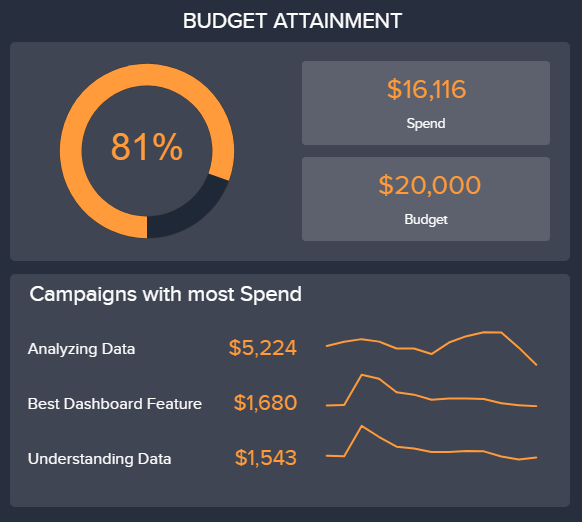
Budget Attainment
How exactly are budget targets implemented?Budget attainment is not a classic Google AdWords KPI, but rather a general controlling figure in marketing. This measures how close a marketer comes to achieving the specified budget. If the planned monthly budget is, for example, 20,000$ and costs only 16,166$, this would correspond to a budget achievement of 81%. Especially in AdWords accounts with many campaigns, hundreds of ad groups and tens of thousands of keywords, it is quite difficult to achieve an exact budget with the most effective budget distribution possible in order to maximize results.
Performance IndicatorsMonitor budget attainment in detail, on a daily and weekly basis, to make the most of the monthly budget as accurately as possible, and to avoid exceeding or falling short of the budget.
Relevant Showcase Dashboard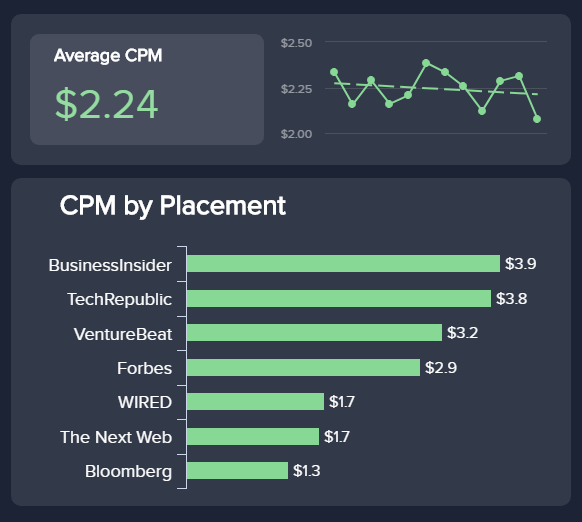
Cost per Mille
How high is the CPM for specific placements?Our last 3 examples are specific or particularly important key metrics for Google AdWords Display campaigns. The cost per thousand or CPM (Cost-per-Mille) is a bid strategy in which you do not pay for clicks but per 1000 Impressions of your ads in the Google Display Network. Accordingly, the click prices achieved are determined by the click-through-rate (CTR), which is influenced by the visual design and relevance of your banners. We have exemplified the cost per thousand as an example for different placements – in this case, different websites in the Google Display Network. The CPM can vary greatly depending on the placement, which would also result in very different click prices if similar CTRs were expected.
Performance IndicatorsAn analysis of the cost per thousand in combination with the average CTR for different placements helps you to identify the cheapest traffic sources – first.
Relevant Showcase Dashboard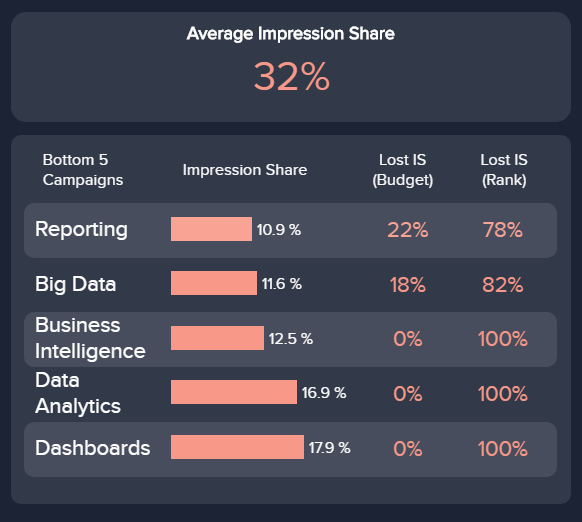
Impression Share
How well do your ads perform on GDN?The percentage of potential impressions (impression share) is calculated from the number of impressions achieved by your ad, divided by the total number of theoretically achievable impressions. This key figure is particularly critical for the success of display campaigns in the Google Display Network (GDN). There are 2 main reasons for "missed" impressions: a) a too low ad rank or b) a limiting budget. In our visual example, we can see that our display campaigns have an average impression share of 32%. In addition, we take a closer look at the 5 campaigns with the lowest impression share. For the "Reporting" campaign with the lowest impression share of 10.9%, for example, we found that 22% of the Impressions were missed due to budget, and 78% due to poor ad rank.
Performance IndicatorsIdentify campaigns with a low impression share. Check the allocated budgets or increase the quality and relevance of your ads and landing pages with a low ad rank.
Relevant Showcase Dashboard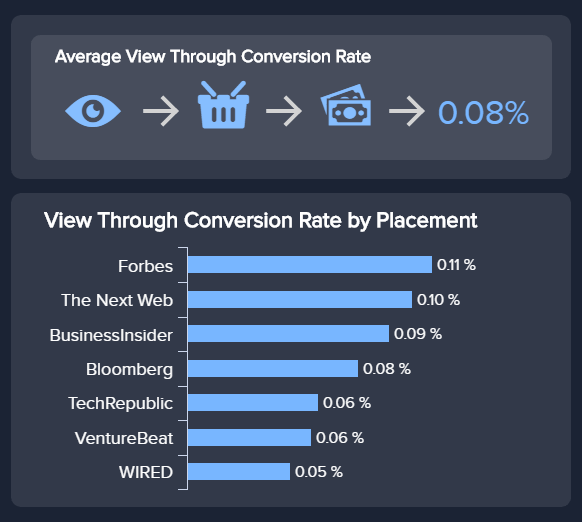
View Through Conversions
How often do users convert without clicking?The view-through-conversion rate is also used to track conversions from users who only saw an ad but did not click on it. The default measurement period is 30 days but can be increased. This KPI is seen critically by many marketers because only because a user was shown a banner in the GDN, this does not necessarily mean that he really (actively) perceived this. Nevertheless, it might make sense to consider the value of the view-through conversions to some extent in the chosen attribution model.
Performance IndicatorsDecide whether the achieved view-through conversions for your use case are relevant, and consider their value in your attribution model, if necessary.
Relevant Showcase Dashboard


Setup only takes a few minutes. No credit card required!