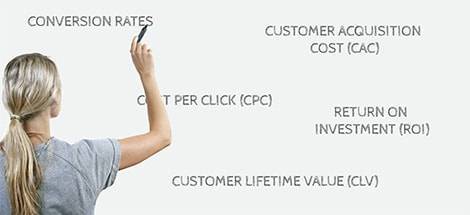
FAST MOVING CONSUMER GOODS (FMCG) KPIs
FMCG Key Performance Indicators and Metrics
✔ See different templates & designs ✔ Find & track the right FMCG KPIs to meet your corporate objectives
A FMCG KPI or metric is a measurable value that helps to monitor and accomplish pre-defined organizational goals. Key performance indicators for the FMCG industry consider branch-specific characteristics such as its fast-moving nature, high consumer demands and short sales cycles.
Here is the complete list of the most important FMCG KPIs and metrics, that we will discuss in this article in every detail:
Out of Stock Rate: Measure your ability to meet customer demand
Delivered On-Time & In-Full: Monitor the delivery performance
Average Time To Sell: Track how long you need to sell your products
Sold Products Within Freshness Date: Take care of expiration dates
Cash-to-Cash Cycle Time: Analyze your cash cycle time in detail
Supply Chain Costs: Understand supply chain costs by category
Supply Chain Costs vs Sales: Compare your supply chain costs against sales
Carrying Cost of Inventory: Assess the costs your inventory holds
On-Shelf Availability: Measure the impact on your sales
Margin by Product Category: Identify your most profitable products
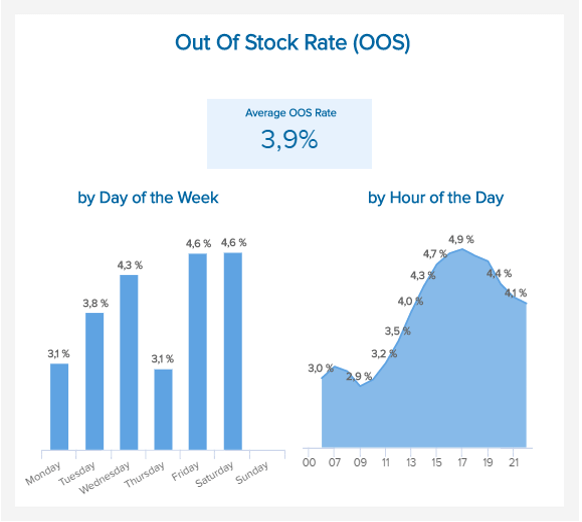
Out of Stock Rate (OOS)
Measure your ability to meet customer demandThis FMCG KPI shows the moment of the day and of the week where your inventory is exhausted, and how much of it is unavailable. Managing your inventory is of course a must-do in the fast-moving consumer goods industry. You need to have an even-more accurate vision of your stocks because of the short sales cycle time and high demand: evaluating the Out of Stock Rate will give you a great advantage in terms of supply. You should also know that around 80% of the ‘stockouts’ are actually caused by defective shelves replenishment practices: implementing appropriate internal measures to refill your store’s sections will decrease the OOS rate. That way, you can easily avoid frustrated customers who in response tend to switch stores. You should also understand the reasons behind inventory stockouts so that you can address the causes more efficiently and avoid a situation to repeat itself over and over.
Performance IndicatorsStudies for the FMCG industry usually show an average OOS rate of 8% – managing to keep your stockouts below this line is crucial.
Relevant Showcase Dashboard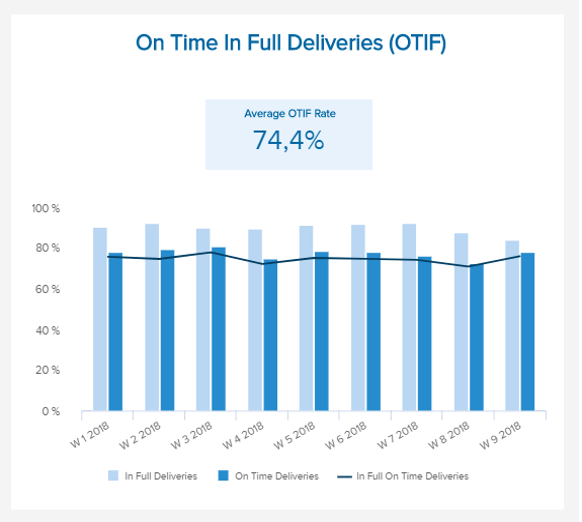
Delivered On-Time & In-Full (OTIF)
Do you receive your exact orders on-time?The OTIF measures the delivery performance within a supply chain: On-Time, In-Full delivery. It measures several levels of delivery: if the right product was delivered to the quality standards agreed upon, in the quantity ordered, at the place agreed on, and at the time expected by the customer – often with a tolerance range predefined. As a supermarket, you can use this FCMG KPI to compare the performance of your suppliers: how often do they provide you with what you want, when you need it. It is usually calculated as a percentage according to the following formula: OTIF = (number of deliveries “OTIF” ÷ total deliveries)*100. The “OTIF” deliveries used to calculate this percentage should answer a couple of requirements: they have a delivery date, they measure the date and hour of said delivery, archive it in the system, and maintain a track record of the reasons behind an order not “OTIF”.
Performance IndicatorsImplement the right measures so as to keep your OTIF rate above 90% for a well-performing supply chain.
Relevant Showcase Dashboard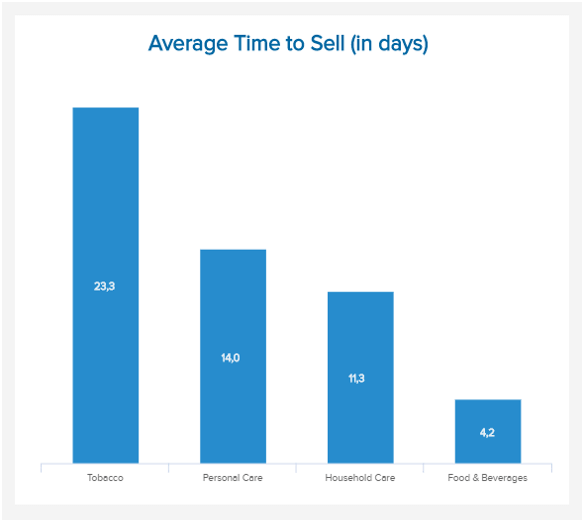
Average Time To Sell
How long do you need to sell your products?This FCMG metric is all the more important in the fast-moving consumer goods industry. Speed being an inherent part of this sector, that deals with a lot of fresh products, the Average Time To Sell is a crucial KPI to measure. According to the type of items (food and beverages, personal care, tobacco, household care etc.), the freshness varies and has to be respected to avoid poisoning and observe the law. Evaluating how long it takes for your products to be sold will give material for the procurement strategies, but will also help in the inventory management. Holding items in your inventory incurs costs, such as labor, storage, or freight costs.
Performance IndicatorsIdeally, you want the time to sell to be as low as possible, meaning that you manage to sell most of your inventory within the short deadlines.
Relevant Showcase Dashboard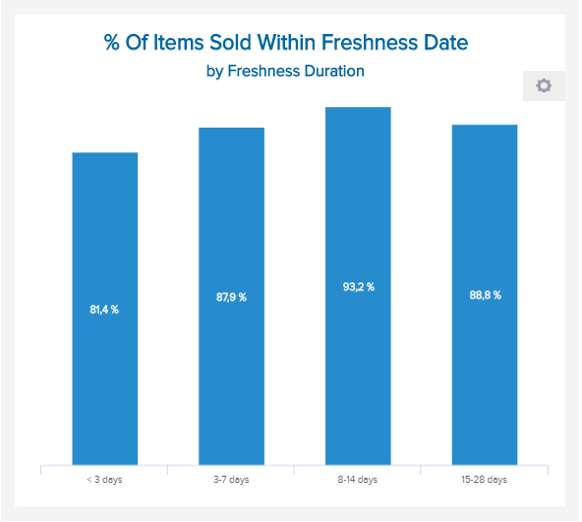
PERCENTAGE OF SOLD PRODUCTS WITHIN FRESHNESS DATE
How many products are sold before expiration?This FMCG KPI calculates the percentage of your inventory sold within the freshness date, depending on the type of product. On the illustration aside, we see that only 81,4% of the freshest products needing to be sold within 3 days, are actually sold. Where is that coming from? Actually, you will always face a trade-off between the availability of your products on the shelves, and their expiration date. Indeed, if you want to have 100% of your products sold, that means that your store will have to deal with shelf unavailability at some point – and this is why many discounters who have such strategy cannot provide you with anything you want on a Saturday evening, one hour before closure.
Performance IndicatorsAlign your metric’s target with the strategy of your store and what has the priority: availability at any time, or selling the inventory within due date.
Relevant Showcase Dashboard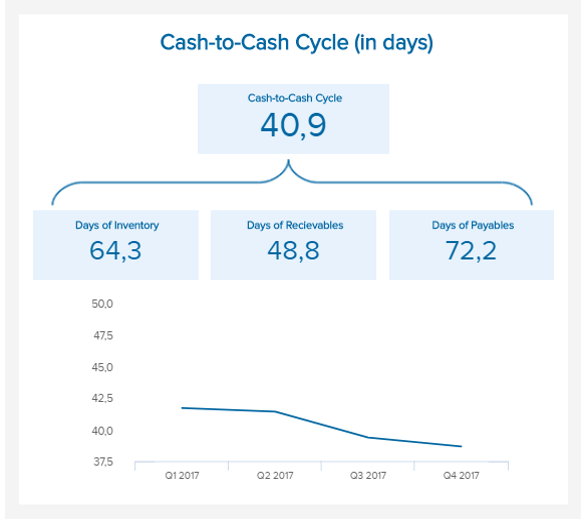
Cash-to-Cash Cycle Time
Analyze and monitor how long you need to convert resources into cash flowsThis FMCG KPI combines 3 ratios: the days of inventory (DOI), the days of payables (DOP), and the days of receivables (DOR). It represents the time period needed between the moment a business pays cash to its suppliers, and receives cash from its customers. It is also referred to as “cash conversion cycle”, and is useful when you need to determine the amount of cash needed to fund ongoing operations. For fast moving goods, estimating the financing requirements is crucial for smooth operations. The formula used to calculate the cash-to-cash cycle is the following: Cash-to-Cash Cycle = DOI + DOP – DOR. A cycle of 40 days means that a business must support its expenses for 40 days – not more. This is a useful calculation for forecasting or trying to address an expensive debt for instance.
Performance IndicatorsThe shorter the cycle, the better it is for a company’s operations. A short cycle means that a business can operate with less cash tied up in operations.
Relevant Showcase Dashboard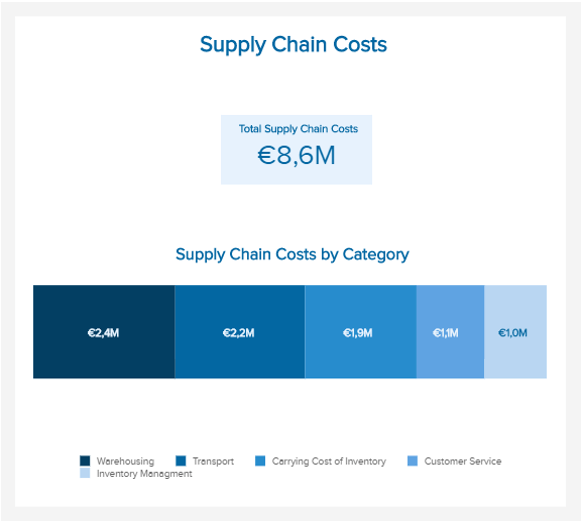
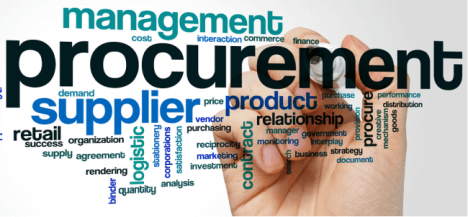
Supply Chain Costs
How much does your supply chain require?The Total Costs of Supply Chain gather all the costs associated with the supply chain management: planning, sourcing, delivering, managing returns, labor, etc. Reducing supply chain costs can notably increase the profits, without needing to increase sales. The supply chain costs have a strong correlation with the carrying costs of inventory: to reduce the total costs, many companies have used strategies to reduce inventory safely. However, you have to be careful and assess the impact of cost reductions on the supply chain as a whole: cutting on one part can result in increasing costs elsewhere, which is a waste of time and energy. Analyze carefully all the changes incurred by a certain cost saving, to avoid such situation.
Performance IndicatorsPerform a benchmark within your specific sector, and compare your supply chain costs to those of your competitors.
Relevant Showcase Dashboard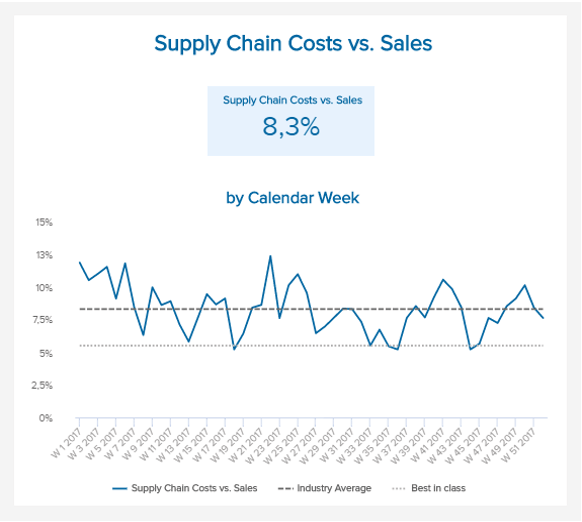
Supply Chain Costs vs Sales
Compare your supply chain costs against the salesDirectly linked to the previous FMCG KPI, calculating your supply chain costs as a portion of sales will give you an understanding of how much you are spending relatively to the whole. By doing such a spend analysis, you can identify where you could do savings. As stated above, savings are a good thing if made soundly: cutting costs here that increase the operations there is a useless hassle. There are many benchmarks out there comparing the costs of supply chain to the sales (as a percentage), but you can also perform your own with specific competitors. In any case, comparing your ratio to your industry average is a best practice, as it will show where you stand and if you can do better.
Performance IndicatorsThe industry average for ambient, non-frozen food and beverages companies is of 7,6%. You should aim at maintaining your ratio below that value.
Relevant Showcase DashboardBecome a data wizard in less than 1 hour!
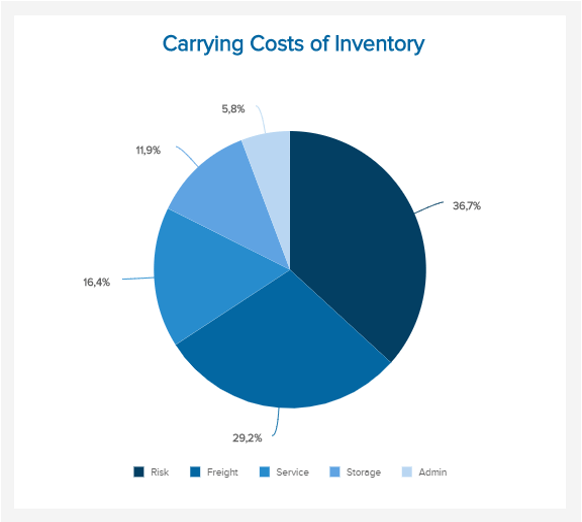
Carrying Cost of Inventory
Assess the costs your inventory holdsThe Carrying Costs of Inventory are also referred to as ‘holding costs’, and are calculated as a percentage of the inventory value. It is essentially all the costs incurred by a business to hold and store its inventory over a certain time. It includes employee costs, insurance, opportunity cost, cost of capital, but also the losses caused by obsolescence, pilferage, and damage. You can calculate them with the following formula: Carrying Cost of Inventory = Inventory carrying rate * Average inventory value. By determining the carrying costs of inventory, businesses know how much profit can be made on current inventory. In the fast-moving goods sector, businesses have a “JIT” (Just in Time) inventory, since most products expire quickly.
Performance IndicatorsThe ideal, like with any costs, is to reduce them. An efficient inventory management is key in the matter. Coupling low costs and high inventory turnover rates is a success factor.
Relevant Showcase Dashboard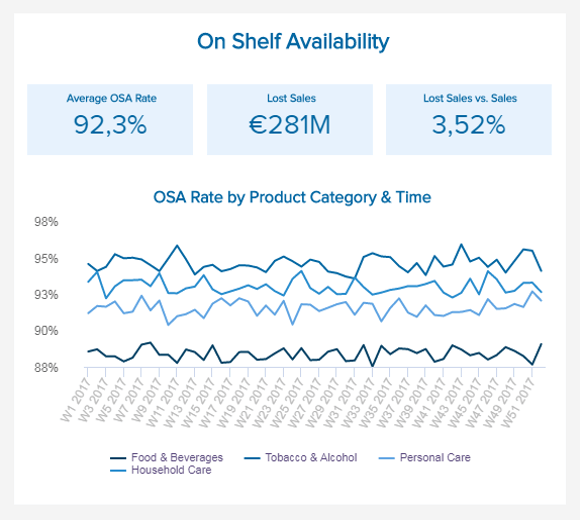
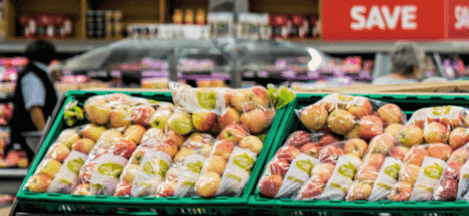
On-Shelf Availability
Measure the amount of time a customer can find his favorite product on your shelvesOn-shelf availability (OSA) measures the percentage of time an item is visibly accessible for sale on shelf by consumers, where they expect it and at the moment they want to buy it. This can be performed by a physical audit or an inventory data analysis. When measuring the OSA, other metrics are also considered: the out of stock rate, the value of sales lost due to unavailability, or the proportion of lost sales compared to actual sales. This FMCG metric evaluates the performance of a business to address demand. If shoppers are repeatedly facing out-of-shelves items in the same store, they will move to another one. An item that isn’t on shelf might however be available somewhere else in the store, or in the warehouse: to avoid losing customers who won’t ask for the item, implement good staffing measures that reduce out of shelves situations.
Performance IndicatorsAn increase in OSA can impact sales significantly: measure your availability over time and improve it as much as possible.
Relevant Showcase Dashboard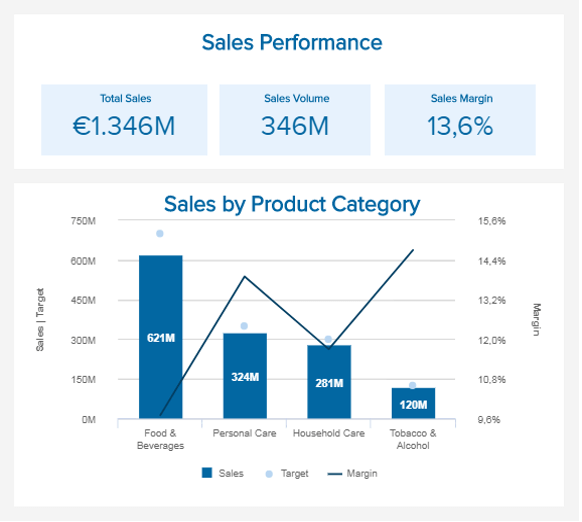
Sales Volume and Margin by Product Category
How much do you sell and how big is your margin for different products?As for every business, you need to measure the amount of sales performed over a certain time and the total volume they represent. Calculating how much sales you have done and breaking it down per category will give you an idea of your strong areas. Comparing it to the target you fixed (actual sales versus forecasted sales) lets you know if you are on track with your planned goals – and if not, you have to find the reasons why: were you too optimistic? Were there unplanned issues, like stockouts or an on-shelf availability always low due to staffing shortages? Likewise, calculating the sales margin helps you determine how much of every dollar made in sales, actually stays with your company as gross profit after accounting for the cost of an item sold.
Performance IndicatorsComparing sales margins per product lets you know which are the most profitable.
Relevant Showcase Dashboard


Setup only takes a few minutes. No credit card required!