
Excel Charts – Find a better way to visualize and monitor your company data
- Easily create advanced charts and dashboards with a few clicks using our intuitive drag-and-drop interface
- Monitor all relevant business information in just one place
- Share generated insights using automatic reporting guidelines and customized dashboards
DATAPINE – CREATE ADVANCED EXCEL CHARTS
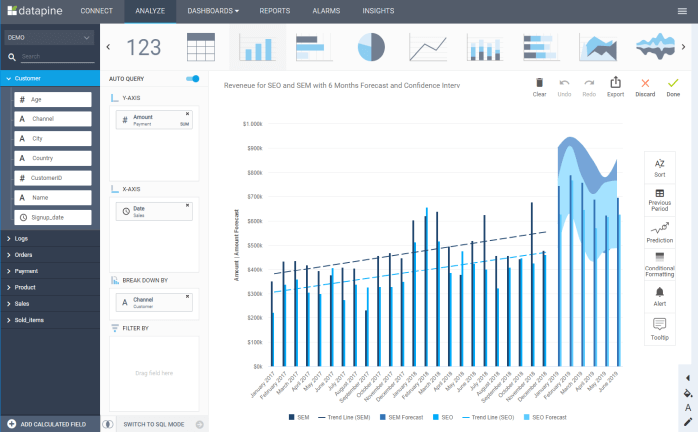
Advanced Excel charts and data visualization
Advanced excel charts are among the most popular solutions used for data visualizations. Visualizing and communicating quantitative information in form of charts or graphs is a highly effective business practice to monitor business performance and track Key-Performance-Indicators (KPIs). With datapine you can create professional and beautiful charts with simple drag-and-drop motions in our data visualization software.
Data analysis in Excel allows people to get good information out of their business data, but datapine takes this one step further so that everyone who utilizes basic tools to create a chart in Excel can now utilize a real database. No matter which field of business you are coming from, start analyzing your own data and extract the KPIs that are relevant to you and your business unit. You can do so without ever writing a single line of SQL code or having to do any of the other heavy technical lifting involved in data analysis. Excel is a great tool but, for most businesses, the ability to create an Excel chart isn’t enough. With datapine, the doors to real data analysis are flung wide open.

Become a data wizard in less than 1 hour!

Take your Excel chart one step further
Almost everyone can work with simple Excel chart tools with a few clicks. But when it comes to analyzing and visualizing data from SQL databases most business users are limited by their lack of SQL knowledge and the ability to build SQL queries on their own. datapine is an easy-to-use data analysis tool that makes it easy to unlock the insights that are stored in your company database.
With datapine you can analyze complex databases and CSV files and you are able to directly create charts and graphs in our intuitive user interface that can then be structured in dynamic dashboards. Our tool is fully compatible with simple Excel CSV sheets as well as with sophisticated database systems like PostgreSQL, MS SQL Server or MySQL. This makes datapine particularly good for small and medium-sized businesses. If your business is likely to expand in the future we will grow with you and adapt to your extending data source and analytical needs, through an Excel chart or otherwise.
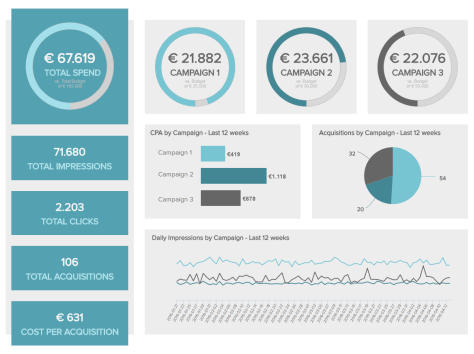
Take Excel charts and graphs to the next level
Excel charts and graphs are staples of the business world. They enable the visualization of data in a way that is easy to understand and can support the decision making process within an organization. What has been lacking in the IT world was an easy way to work with data analysis in Excel at a higher level. datapine enables every business user without any advanced IT skills to conduct comprehensive data analytics. With our dashboard software The results can be visualized in interactive dashboards and customized according to the user needs. For any salesperson, marketing pro or other professional who needs to create a chart in Excel, datapine enables them to build a meaningful and customized KPI dashboard in a matter of minutes to convey the importance of the data they have extracted out of the company database.
Start a free trial of datapine right now. With the power to create advanced Excel charts and graphs, a business can do well but, with datapine, a business is able to utilize its data and information to a competitive advantage.


We were amazed how easy it was to use datapine and get the first KPIs within a couple of minutes. datapine is definitively a game changer for us as now all decision makers have quick, easy access to ad hoc analysis, KPI dashboards and reports.Sebastian Diemer, Founder at KreditechGO TO PRODUCT OVERVIEW
Become a data wizard in less than 1 hour!