Analytics, BI Dashboards & Reports for PostgreSQL
Explore, Visualize & Communicate PostgreSQL Data With StyleTAKE ADVANTAGE OF OUR POWERFUL POSTGRESQL CONNECTOR
CONNECT YOUR POSTGRESQL DATABASE WITH EASE
PostgreSQL is an open source object-relational database system. It is powerful, reliable and has a strong reputation of correctness and data integrity. It has been developed by a world-wide team of volunteers and runs on all major operating systems. A standard PostgreSQL workbench has many advantages related to speed and stability for large data volumes.
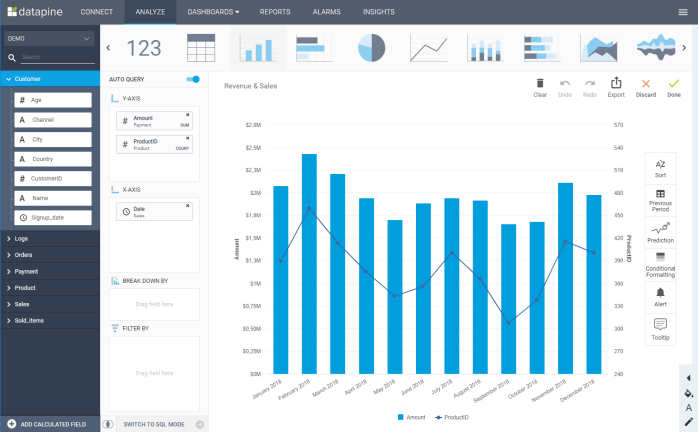
However, by connecting your PostgreSQL database to datapine in a couple of clicks, you will level up your visualization, dashboarding and reporting possibilities to answer your sharpest business questions. Thanks to our visual interface you can run cross-database queries without any technical knowledge. However, if you are more advanced in the matter, our interface also offers the possibility to manually input SQL queries for analyses.
DYNAMIC & INTERACTIVE DASHBOARDING WITH OUR POSTGRESQL DASHBOARD BUILDER

datapine provides you with the best reporting tool for any relational database, and lets you connect additionally all your other data sources like flat files, ERPs, CRMs, web analytics, social media data etc. By connecting all your data sources in one place, you will be able to work efficiently with all the information you need to address important business questions and make strategic data-driven decisions. The dashboards you build visually summarize all the important metrics you have chosen to track, and they gave the quick and easy overview of your business activities. With real-time PostrgreSQL reporting, you know exactly what is happening at any moment, which is a competitive advantage over the old-fashioned and usually systematically outdated manual reporting. Enhance collaboration within your teams by sharing the access and enabling anyone to work with data and extract valuable results, by spotting trends, patterns, anticipating potential problems or on the contrary, new business opportunities.
Thanks to visual presentation, you can make sense of these raw rows of data that would otherwise remain a pack figures aligned. That naturally lets you perform an improved analysis and measure your organization’s strengths and weaknesses, to better align the company’s strategies and goals. You can now make better informed decision backed up with effective data, thoroughly analyzed and understood. Building up compelling business dashboards will no longer be difficult thanks to datapine’s intuitive interface that has been designed to be accessible to non-technical people alike, empowering them with analytics and insights.
Become a data wizard in less than 1 hour!

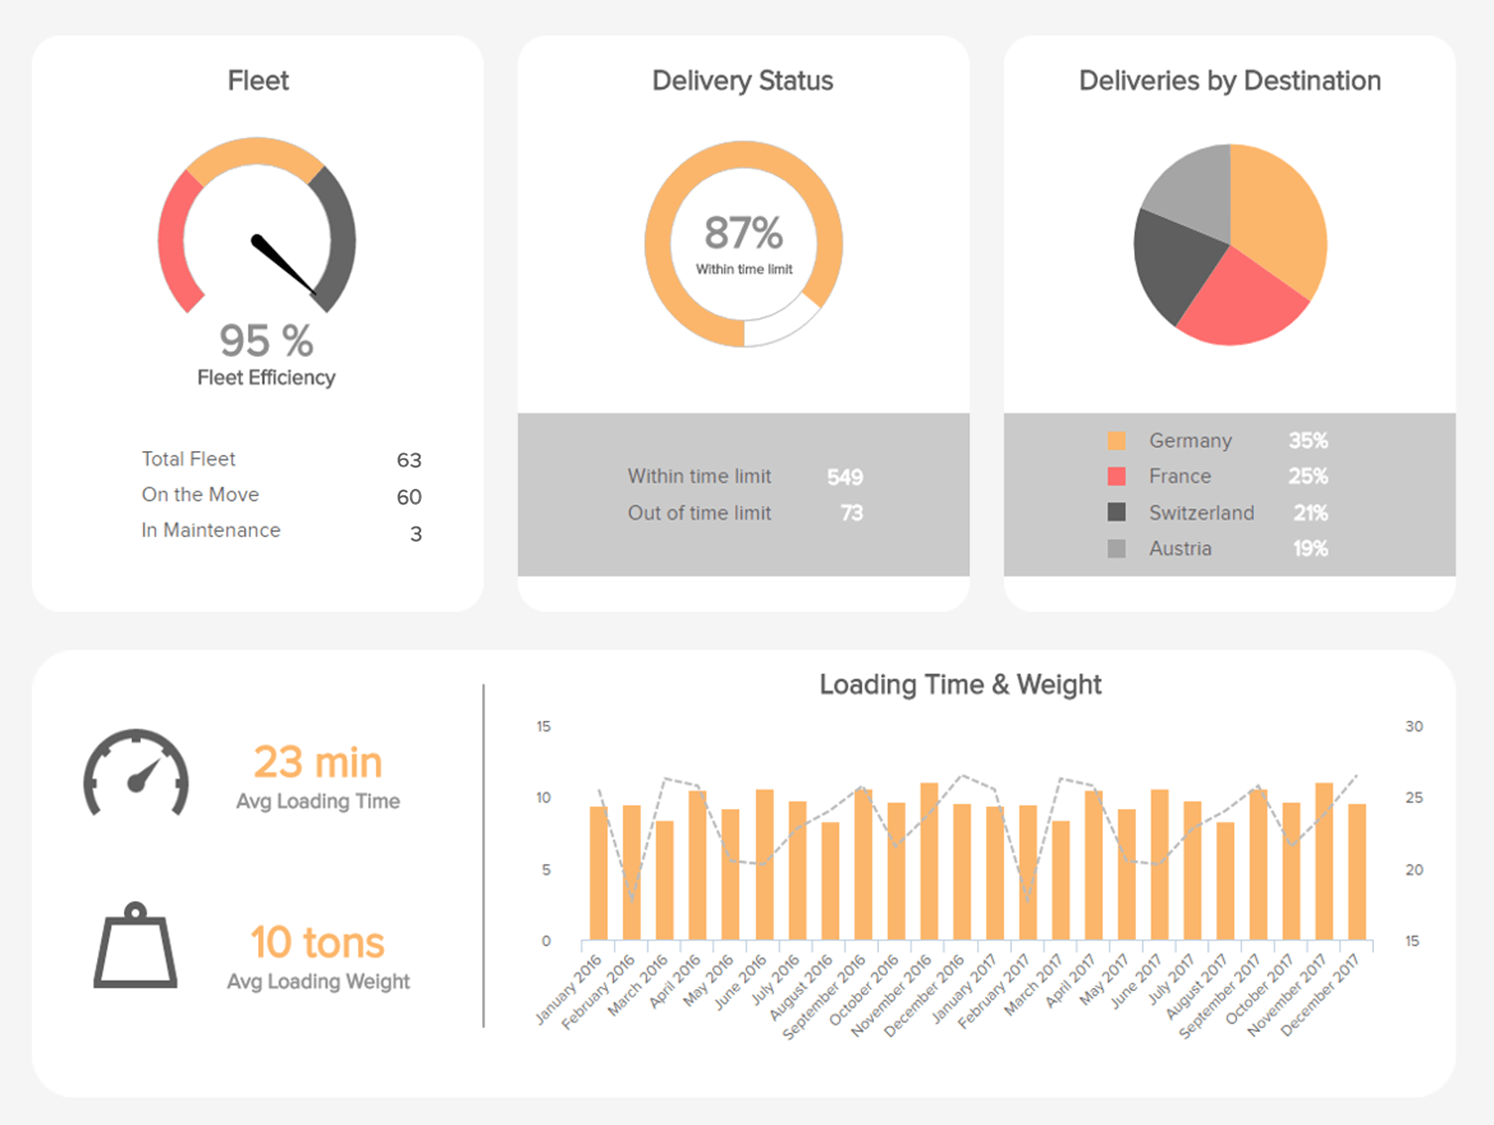
SHARE YOUR KPIS WITH OUR POSTGRESQL REPORTING
Connect your PostgreSQL databases to datapine’s high speed and secure data warehouse in the blink of an eye and start analyzing your Key Performance Indictors (KPIs). Our smart caching layer lightens your database and reduces query time significantly: you can create meaningful graphs and charts with just a few clicks, combine them smartly to communicate your insights through professional dashboards.
Having the possibility to analyze all your data even if stored in different formats or in several databases is a great opportunity to understand your business activities as a whole. You can connect your database remotely and perform your queries there, but you can also choose to transfer it to our warehouse and combine it with other data sets, for a broader analysis. datapine’s PostgreSQL BI software adapts to your needs.
BENEFIT FROM THE INTUITIVE USER-INTERFACE OF OUR POSTGRESQL ANALYTICS SOFTWARE
Get started with datapine’s PostgreSQL connector and fully enjoy our powerful and easy-to-use data analytics solution. Benefit from advanced cross database analysis, as we offer you native connectors to almost every data source. In comparison to standard PostgreSQL Workbench tools, our intuitive drag & drop interface empowers everyone, from the freshly arrived intern to the experimented data scientist, to dig into data and extract valuable insights from it. With datapine, monitor your business activities and always be informed of your performance, and if you are on track with your goals or not. Set up a set of Key Performance Indicators (KPIs) to have the framework that will help you analyze your data and manage your way to the desired results. When deciding which KPIs to track, always keep in mind to define beforehand the specific business problem you wish to solve. That way, you will be better aligned with your company strategy, have a clear understanding of the situation and thus can reach the desired outcome. KPIs are here to help your benchmarking and progress assessment. datapine’s PostgreSQL BI software lets you do these benchmarks, internally, across departments, offices, or externally, in order to compare your company’s performance to others in your industry. Our goal is to make data discovery accessible to everyone and to make your team less dependent on the IT department of your company when it comes to answering crucial business questions. By accessing and reporting on your data whenever you want, you save a lot of time and that is critical in our fast-paced economy.