Analytics, BI Dashboards & Reports for MS SQL SERVER
Explore, Visualize & Communicate SQL Server Data With StyleTAKE ADVANTAGE OF OUR POWERFUL MS SQL SERVER CONNECTOR
CONNECT YOUR MS SQL SERVER WITH A FEW CLICKS
MS SQL server is a relation database management system (RDBMS) developed by Microsoft, storing and retrieving data as required by other applications. Use datapine’s SQL Server Connector to run ad-hoc queries and enjoy the power of modern data visualizations.
During the connection process you can decide which tables and fields you wish to integrate, edit data labels, and you can set additional foreign keys or create custom metrics without affecting the underlying data structure. With datapine, experience a fast and easy set-up process without heavy IT involvement. Our smart SQL Server BI solution is ready and awaiting you to start generating new insights.
DYNAMIC & INTERACTIVE DASHBOARDING WITH OUR MS SQL SERVER DASHBOARD BUILDER

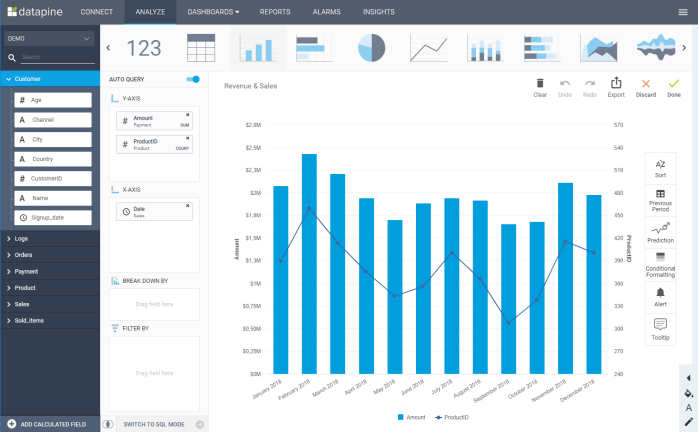
Visualize your all your data thanks to our innovative SQL Server Analytics on interactive and dynamic business dashboards. No need to write hundreds of lines of code to produce automatic reports, today you can benefit from state-of-the-art software that lets you connect all your data sources in one centralizing place within minutes. That way, you can easily perform cross-database analyses that would otherwise require a lot of time and preparation. To do so, it is as easy as everything else with datapine: a couple of clicks and you are ready to go. Our intuitive drag & drop interface simplify the time-consuming and hard data modelling, and gives you all the keys you need to set up the best SQL Server reporting to bring your business a step further with better informed decisions.
Start digging into your data without being an IT crack, as our interface automatically turns any user interaction into a SQL query. If however you are a more experienced worker, you can make good use of our advanced SQL Query box that lets you manually enter code to perform the analysis you want to see. Working with our MS SQL BI solution will let your stay alert, as you will always be working on real time data: it is thus easier to spot anomalies and unexpected event as they arise, to face them on time and with an appropriate manner.
Become a data wizard in less than 1 hour!
SHARE YOUR KPIS WITH OUR SQL SERVER REPORTING
datapine empowers everyone in your team with the possibility to explore, drill-down, dig in the data and glean insights. It is no longer only in the hands of a few and waiting for reports is a thing of the past: working with a Software-as-a-Service (SaaS) solution like ours enables anyone with the access to work on the data 24/7, from any internet-equipped device, as long as they want.
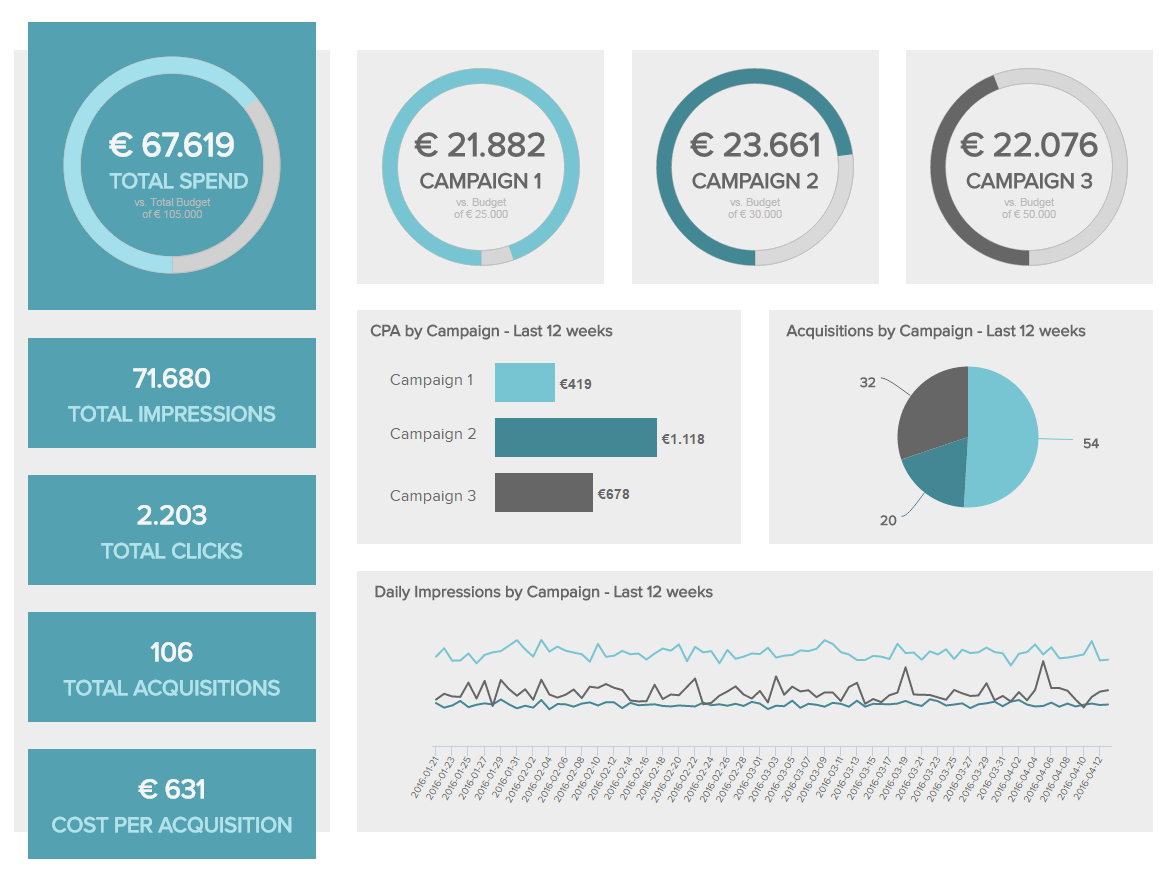
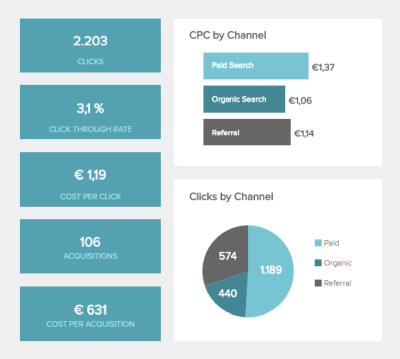
Communicate your findings the most efficient way thanks to professional SQL Server dashboards, backed up with datapine’s wealth of advanced data visualizations: maps, bar graphs, stacked columns, scatter plots, spider’s web, tables, area charts and many more. Customize your charts as much as you want and compile all of them into meaningful dashboards. These dashboards will take the pulse of your business at any time and help you implement and adjust your different business intelligence strategies.
BENEFIT FROM THE INTUITIVE USER-INTERFACE OF OUR MS SQL SERVER ANALYTICS
Get started with datapine’s MS SQL Server Analytics and fully enjoy our powerful and easy-to-use data analytics solution. Gather all your information in one central place thanks to our native connectors to almost every data source, and perform advanced cross database analysis in the blink of an eye. Start digging into your data and quickly glean insights even if you are a non-technical user: datapine’s intuitive drag & drop interface enables anyone to work on their data while being independent from the IT department. Easy data discovery is possible and we help you answer critical business questions on time. Bring your data story to life thanks to SQL Server reporting with datapine, and make sense of the findings you obtained in your various analyses. Choose from a wide range of charts and graphs, that you can personalize to your brand’s colors, integrate text boxes, frames, images and logos, so as to custom your dashboard to the degree that you want. Share it with who you want and to the interactivity level that you want, by setting up automated reports in different formats (PDF, PNGs, XLS) or simply with a URL. Do not worry about never-ending synchronization and reports accumulation: the data you work with is always in real-time, meaning that all your reports will always be up-to-date. Foster a strong dashboard culture within your organization to strengthen your decision-making. Backed up with better-informed, data-driven decisions, your business intelligence strategy will go a step further and help your business thrive.