Analytics, BI Dashboards & Reports for Amazon RDS
Explore, Visualize & Communicate Amazon RDS Data With StyleTAKE ADVANTAGE OF OUR POWERFUL AMAZON RDS CONNECTOR
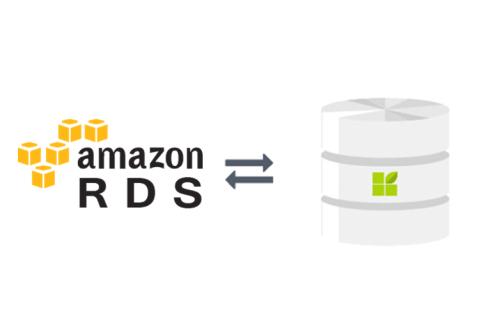
CONNECT YOUR AMAZON RDS DATA WITH EASE
Amazon Web Services (AWS) is a cloud computing platform providing numerous products and services of global computing, storage, analytics, application or deployment. Among them is their relation database service (Amazon RDS), a fully-managed SQL database cloud service that makes it easier to set up, operate and scale relational databases.
It provides you with six databases engine to choose from – Amazon Aurora, MySQL, Oracle, MS SQL Server, MariaDB and PostgreSQL. With datapine’s Amazon RDS AWS connector, you can run freely ad-hoc queries to get the most out of your Amazon Web Services data, and enjoy the full potential of cloud computing.
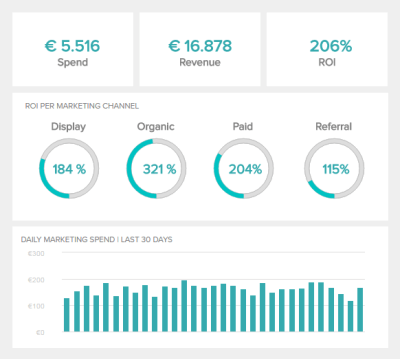
DYNAMIC & INTERACTIVE DASHBOARDING WITH OUR AWS DASHBOARD BUILDER

Combine your various databases in one central place and get the opportunity to work on different types of data sources conjointly: augment your AWS analytics with datapine to make the analysis broader, smoother and deeper. Visualize your insights with a high level of data expressivity thanks to the numerous charts our solution holds in store, and customize your Amazon RDS AWS dashboards at your will. Foster a data-driven culture within your company by supporting the use of dashboards and empowering your teams with the access to the data they need. Information is a precious source of insights whose potential remains untapped if only explored by a few people with similar views.
Dashboards are a great way to display the information you collect from your analysis in an efficient way: their interactivity lets anyone drill down, filter, zoom-in or export selected charts at their will. They engage end-users more easily, with an intuitive experience and attractive visuals that really make sense of the huge amounts of data you have in store. They let you have a good overview of what is happening in your business at a moment, and they are not static or frozen: working with real-time data, you are assured to always have the right metrics and the right information, which is not outdated. That is highly valuable in our globalized economies where everything is at internet-speed, and where reacitivity is a must. Analyzing and gleaning insights is a best practice – but being able to communicate and share them with the people that matter is an undeniable advantage that dashboards provide you with.
Become a data wizard in less than 1 hour!
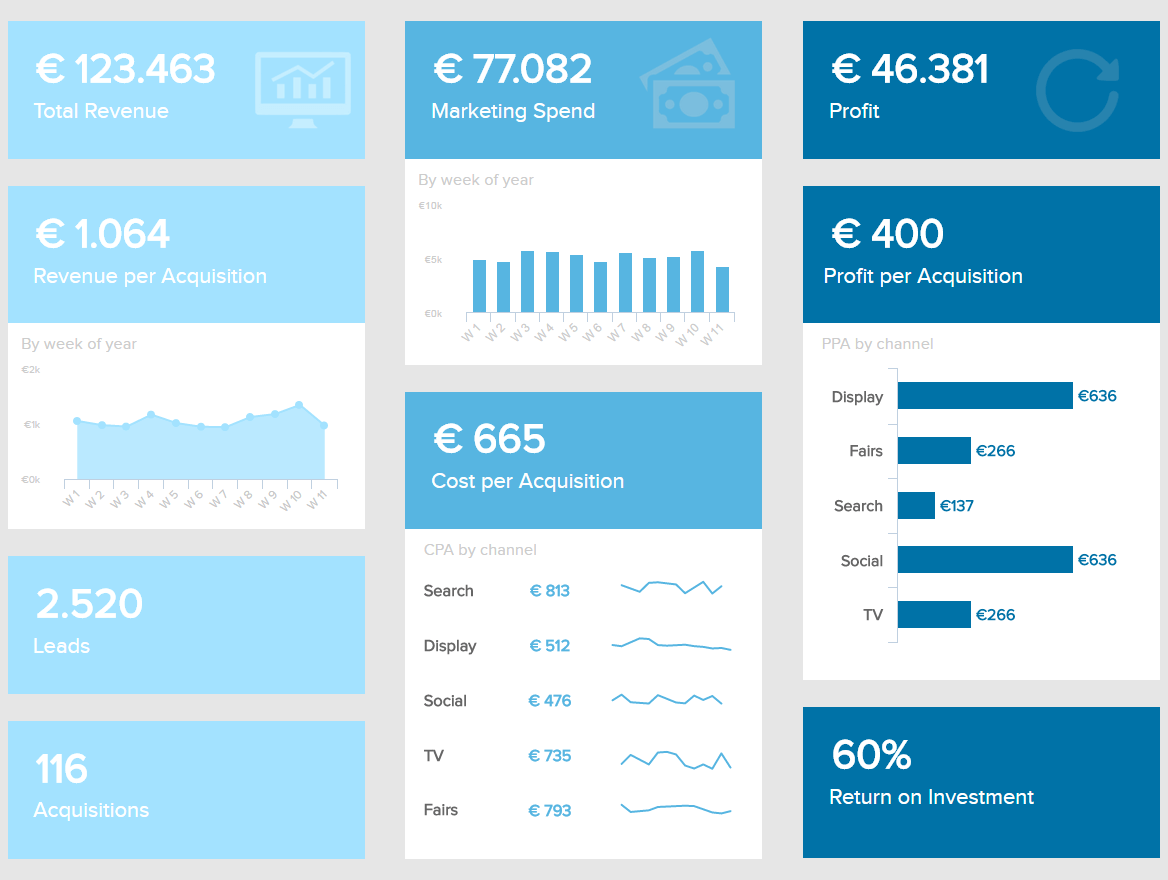
SHARE YOUR KPIS WITH OUR AWS REPORTING
The vast amount of data visualization offered by datapine will help you convey your information in the best way possible. Set up in a first time a handful of metrics you wish to track, and follow their evolution through stunning data visualizations. These metrics should answer your most important or most relevant business questions at the moment you choose them – adapt them accordingly to your industry or sector, and to your business needs.
Then, you can then compile them into a professional business dashboard to visualize in a glance all the information you need. Share freely your findings with the people you want, or work together on them: this is a great opportunity to boost your Amazon RDS AWS Analytics features and uncover solid insights that will upgrade your business strategy.
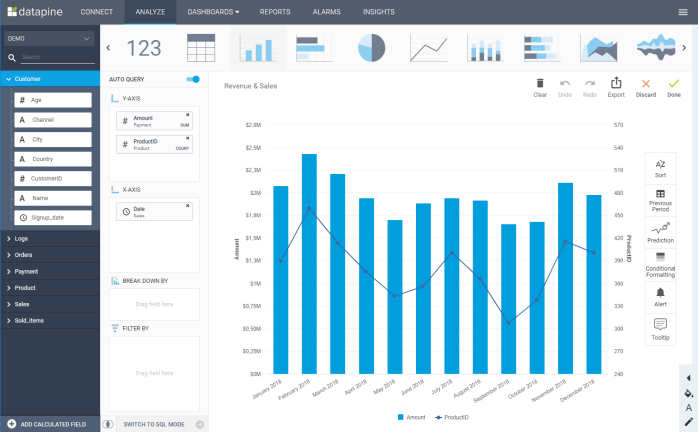
BENEFIT FROM THE INTUITIVE USER-INTERFACE OF OUR AWS ANALYTICS
Get started with datapine’s AWS analytics and fully enjoy our powerful and easy-to-use data analytics solution. Benefit from our wealth of native connectors to almost every data source and perform advanced cross-database analysis. It only takes a couple of minutes to connect all of your databases and sources to datapine’s high speed data warehouse. The intuitive drag & drop interface enables even non-technical user to dig into data and glean actionable insights from it. No need to know how to code complex MySQL queries as any interaction you have with our interface is automatically turned into a query. We make data discovery easy for everyone and enable you to be independent from your IT department to answer critical business questions. However, if you do have technical knowledge, you also have the opportunity to enter SQL code manually in our advanced SQL Query box, so that you can perform the analysis that you want. After setting up our software in a couple of minutes, all your data is gathered in one central place - you can then provide access to everyone who needs it and empower each member of your team to work on analytics and visualize complex data. Together build powerful AWS dashboards that will display the insights you found and tell the data story of your business or unit. Benefit from the best dashboard software that makes it easy for you to work collaboratively and that facilitates the information circulation for everyone in your company.