Facebook Dashboard examples
A Facebook dashboard is a reporting tool to monitor and analyze important KPIs concerning your business profile and its performance. It provides an at-a-glance view of your overall Facebook operation on which you can base your future decisions and take relevant actions.
Let's take a look at these 3 Facebook dashboard examples: Facebook Page Dashboard - Facebook Post Dashboard - Facebook Ads Dashboard.
Facebook Page Dashboard
Open Facebook Page Dashboard in Fullscreen
The largest social media network in the world has its own sets of metrics and best practices to follow, which enables the delivery of the best possible results from organic, paid and viral posts. While you can easily tinker the results on the Facebook Page itself, a complete Facebook dashboard can provide a clear overview of all metrics included to create a successful Facebook strategy. By analyzing the dashboard, gained insights can provide a clear guide on where to invest more resources, how to attain better results, and, most important, is my Facebook strategy on track.
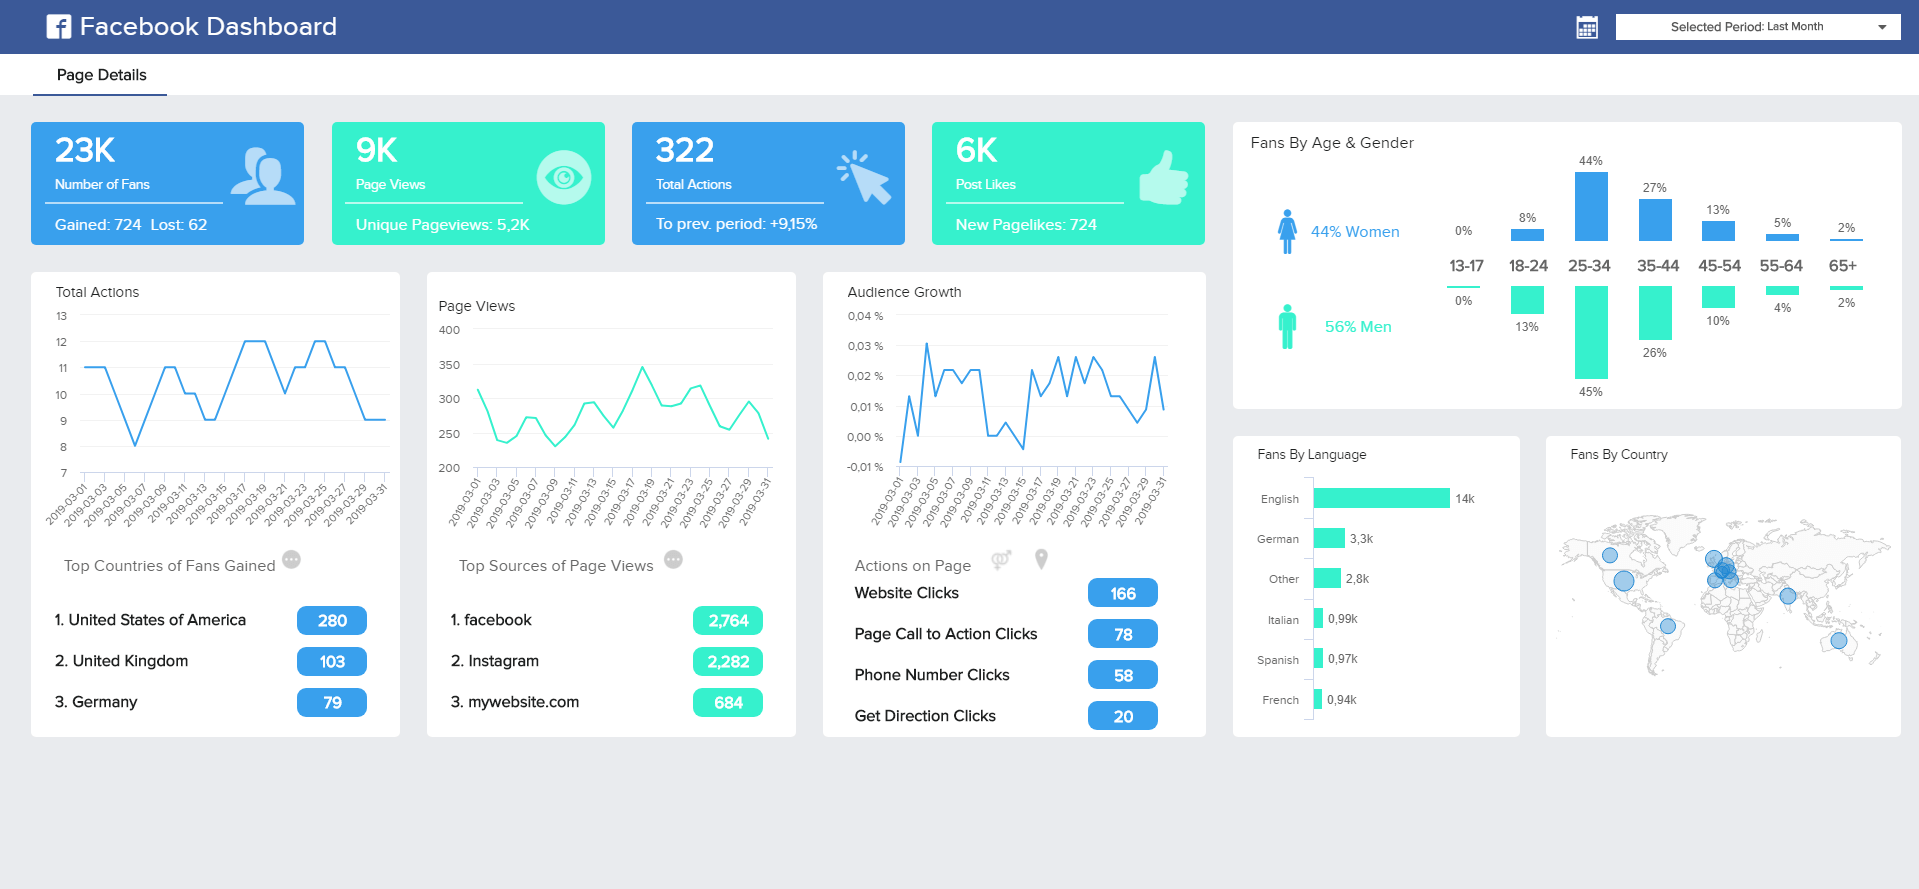
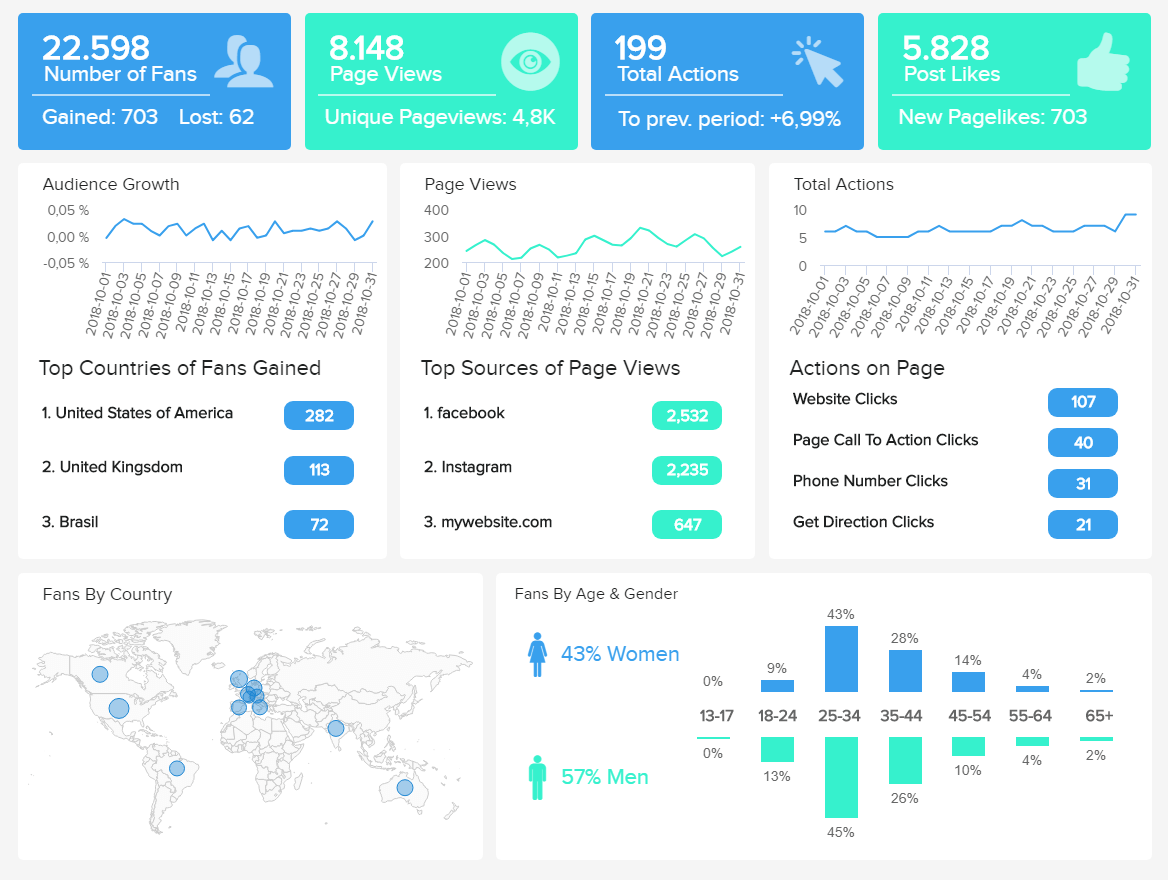
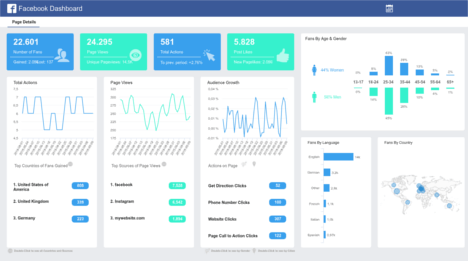
The top of our Facebook Page dashboard example is dedicated to the overall engagement of the Facebook Page. In the Number of Fans tab, you can immediately spot how many have you gained or lost. If the numbers of those metrics are significantly high, you should analyze them and use those findings for future posting. The next metric, Page Views will show the total amount and, also, present how many Unique views your Page has gained, so you don’t have to deal with exports from other files – all data can be presented in a single dashboard. The Total Actions and Page Likes will provide additional insights: comparing to the previous period and New likes obtained, will evidently show what kind of reactions and perception people have when it comes to your Page. But let’s dig even deeper.
Not to be limited just by these data, you can also perform the analysis of your Audience Growth, and from which countries your fans are coming from. The sources of Page Views indicate the specific channel your views are coming from and you can even break down this data on a daily, weekly, monthly or custom-made time-set. The Total Actions on Page can indicate whether your clicks are obtained to Get directions (from people near you), or Website Clicks, for example.
The bottom side of the dashboard is dedicated to the demographics of people connected to your Page. You can clearly separate fans by age and gender, by language, or country. These metrics are important since you want to tailor your Page to correspond specific needs of your target audience.
And last, but not least, you can select the specific time-frame for your data to be shown – no more exporting or limiting your data for 28 days. With just a few clicks, you can have the entire visual ready to present the complete Page details dashboard on a meeting, to your clients or internally.
Having a clear understanding of the Post details of your Facebook channel can certainly decrease the time spent into making actionable insights and provide a cost-effective solution to achieve better results of the overall social media strategy, be it organic or paid. A well-designed Facebook dashboard will deliver an ideal overview of top metrics and KPIs to track and keep an eye on.
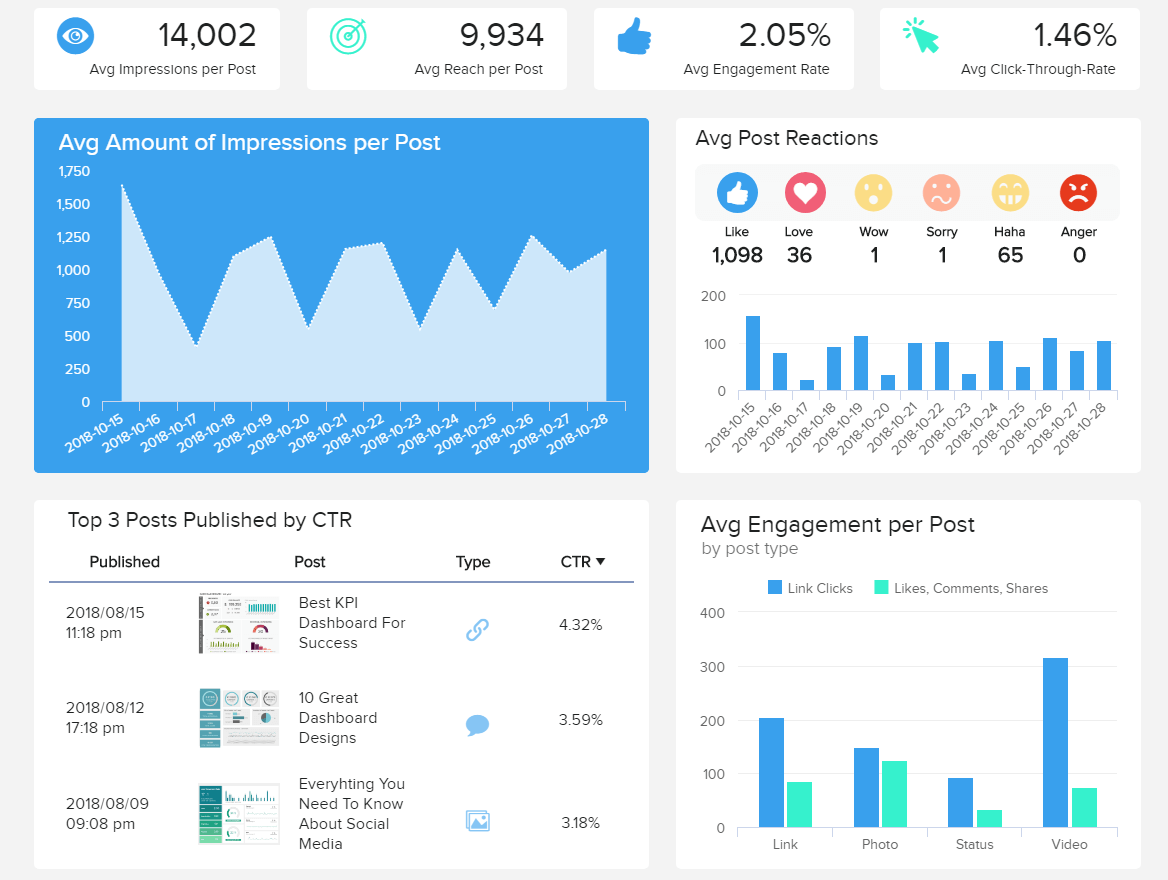
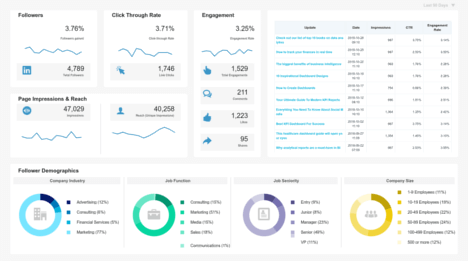
The Facebook Post dashboard above represents the main metrics used in analyzing Post details. Average numbers of Impressions, Reach, Engagement Rate and Click-Through-Rate clearly illustrate the overall Post-performance based on these 4 main Post details metrics. Breaking down these KPIs, each of them can be examined into even more datasets and details. This first indicator defines the number of displays (Impressions) the specific post has gained, on an average level. Through the set time frame option, the average amount of Impressions can be viewed on a daily, weekly or custom-made period. The Reach indicator specifies the Unique number of views a post has received. Users on this social media can interact in multiple ways: The Average Engagement Rate on Facebook will provide the answer on the percentage of people that have actually engaged with the post in any possible way, such as by liking, sharing, commenting, or clicking a link. The higher these percentages are, the higher the number of engaged people.
By digging deeper into this dashboard, it is advisable to notice what kind of Post Types work best: link, photo, status or video. This can clearly define your future posting style decisions: if you get more engagement on a video post, you might want to invest more time and resource into your video posts. But do keep in mind the costs of production and the quality of videos you want to share.
It is also valuable to track the Average Post Reactions number. If you receive a high number of angry emoticons, you might want to consider why. Although it is known that a negative PR is still a PR, you need to consider what are your goals with the specific post and how to communicate that goal with your audience.
The last part of the dashboard shows the top 3 Posts published by the CTR metric. You can also see on which date and time the post was published and what kind of Post Type was published. Keep in mind the benchmark data for your business and don’t forget to optimize your content on a regular basis.
Being a Facebook Advertiser is certainly not an easy task. Optimizing campaigns, delivering reports, keeping up with the algorithm, and metrics changes on this platform can be time-consuming and demanding. That’s why having Facebook dashboards ready to analyze all your data into one single place can reduce the time and, consequently, costs of your business operations. Let’s see this through a Facebook dashboard example dedicated to Ads.
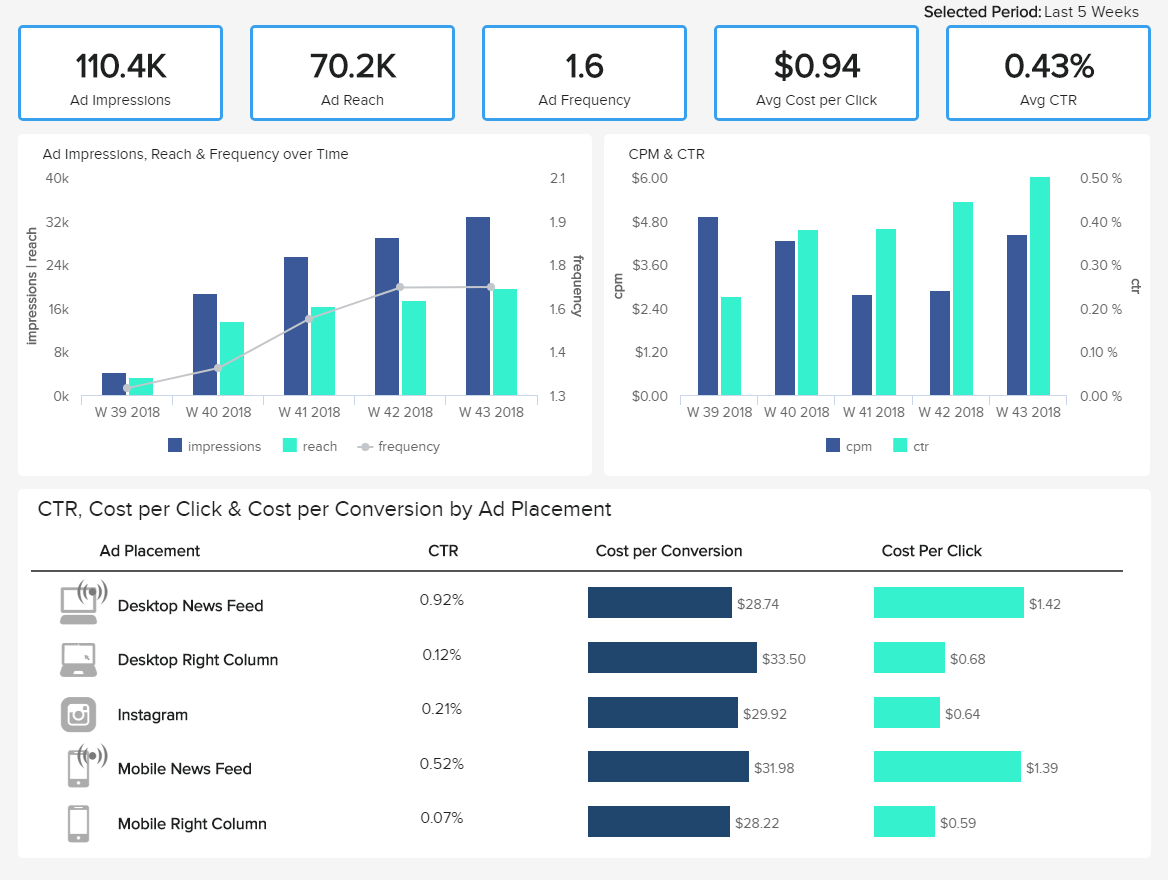
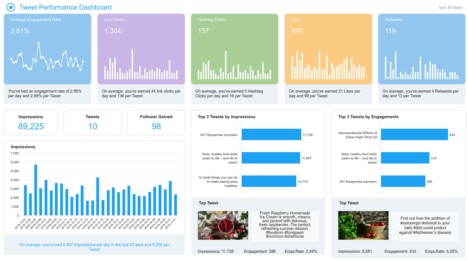
On the top of our Facebook Ads dashboard example you can see the total amount of Impressions, Reach, what was the Frequency, Average CPC, and the Average CTR developed over time. Breaking down these insights by a specific set of time can visually and interactively show in which direction your campaigns are going. If you look it on a weekly level, you can monitor your performance in more detail than waiting for the time-consuming creation of a monthly report. By simply clicking on the specific week you can dig deeper into the single day of the campaign. It would make sense to also filter your campaigns by top 5 performing ads by Impressions and Frequency, and that way you can see how many times the ad was displayed and how many times a single user has seen the same ad. This can tell you if you’re saturating your audience with the number of ads shown.
Important metrics to consider are CTR (Click-Through-Rate), CPC (Cost-Per-Click) and Cost-Per-Conversion by Ad Placement. You can see different results by different Ad Placements, which means that you have to decide which ad strategy performs best for your business. If your Right Column placements had a lower CPC in comparison to the News Feed but, in the end, a higher Cost-Per-Conversion, is it worth investing in that kind of strategy? The CPC and Cost-Per-Conversion metrics can be influenced by the CTR and the Conversion Rate. By having a clear visual dashboard, interactive in its features, your decision time can be significantly reduced since you see your expenditures and results in just a few clicks.
The CPM (Cost-Per-Mille) is another key factor to consider while you set and optimize your campaigns, as it will vary a lot between your audiences. The more detailed targeting you apply, the higher the CPM you will reach. Together with the CTR metric, it can be expanded through weeks or a custom set time frame, so you can visually compare your results, making your next decisions easier and quicker. Fluctuations are shown depending on your targeting and placements sets. You can enlarge this section of the dashboard to get a full-screen view and elaborate on these findings in more detail.
The metrics, KPIs and relevant parameters we have elaborated on are concentrated on the benefits of modern Facebook dashboards and how they can help your overall Facebook strategy. Test it 14 days for free, connect your Facebook account and create your own demo dashboard in a few seconds!
Setup only takes one minute. No credit card required!