
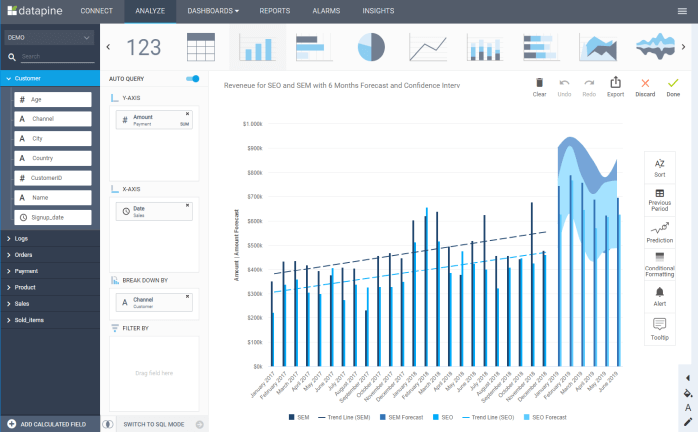
Cohort Analysis – Easily conduct complex calculations without any SQL knowledge
- Analyze & visualize your data without writing a single line of code
- Visualize your cohorts through stunning charts and tables
- Share your results with interactive dashboard or automated reports among your organization or with external parties
DATAPINE – DISCOVER EASY-TO-USE COHORT ANALYSIS TOOLS
Use cohort analysis to calculate customer retention rates
A cohort analysis gives you a deeper understanding of your customers and provides actionable insights for your business. By measuring customer retentions, you can see the value of each customer cohort and recognize how to retain them for your long-term business growth.
But how to perform cohort analysis? Here are simple guidelines to help you get started:
Define your cohort groups: If you want to look at your long-term trends, it is wise to group your cohorts on a quarterly basis. On the other hand, if you’re looking for the specific performance of a channel or campaign, it makes much more sense to group customers by week or month.
Monitor cohort behavior: You can follow your groups’ behavior by first transaction date and then look into their spend or repeat rate over time. With a powerful dashboard creator, you can use a built-in analytics solution that will take you only seconds to extract your data.
Compare cohorts: Different cohorts should be compared in order to determine if you do an excellent job keeping your customers engaged.
But how this can be done fast and effortless? It’s simple: use datapine to easily conduct a cohort analysis and gain insight into metrics such as your customer retention over time, per segment or acquisition channel. The resulting numbers can be used for further analyses, such as the calculation of customer lifetime value for different customer groups, to optimize marketing channels and sales processes. In this context, it is important to mention that in contrast to most online BI tools, all cohort analyses with datapine can be easily conducted without any prior technical or statistical knowledge. That is why our software is so versatile; specialist IT knowledge is not needed to perform what once was a complex set of SQL queries.
datapine also offers a flexible hosting service for your data. By relying on our dedicated high-speed servers, which are located in Frankfurt am Main in Germany, you can increase query speed significantly or if you prefer to retain your data in-house, then connect datapine remotely to your own database. The ease and flexibility of our software make it appealing to any department within a company.

Become a data wizard in less than 1 hour!

Identify important customer patterns using smart cohort analysis tools
By using cohort analysis in your business strategies, you can study the behavior of a specific group that interacted with your company in a set period of time, which provides an additional form of analyzing data that would otherwise stay omitted.
Additional benefits of performing a cohort analysis include:
Extracting meaningful patterns: Aggregating data around events to compare previously incomparable data points is one of the strongest points cohort analysis provides. That way you can discover and break down the customer journey to discover new opportunities for improving efficiency.
Optimizing the conversion funnel: How user experience affects your conversion rate from the top of the funnel to the bottom is another benefit that cohort analysis can determine more accurately in comparison with linear analysis. For example, if you segment your revenues per channel for unique cohorts each month, you will be able to establish where your optimization is most effective and where it needs additional improvements.
Understanding unique behaviors: Segmenting the users’ or customers’ behaviors allow you to paint a much clearer picture of how they interact with your product or service. Defining groups based on actions taken (or not taken) enables you to analyze how unique behaviors affect conversions, churn and retention, revenue, and much more.
Improving retention: You can use cohort analysis to optimize the retention rates of your customers or clients. After you segment your users as cohorts by acquisition and cohorts by behavior, you can focus your efforts on user engagement before their drop-off point, and identify which segments are most likely to become long-term customers, users or clients.
When it comes to an easy solution to utilize these benefits, datapine provides you with simple access to large sets of data and enables you to quickly process them. With our effective cohort analysis software, you will investigate the activities of a particular section within your dataset, with an objective to identify related groups which share common characteristics or experiences. This makes it a powerful analytical tool which could provide better decision making for your business. For example, these identified cohorts could be valuable to the marketing department to help it better understand specific customer groups and react to common behavioral patterns which might otherwise remain hidden. The results can then be presented in a comprehensible marketing dashboard which combines all relevant analysis in a visual and interactive manner.
Furthermore, cohort analysis tools can be used to track the effect of retention campaigns. Many companies conduct those calculations with data analysis tools to find out after how many purchases a customer becomes loyal and sticks to the brand. Based on those insights, you can target customers individually, for example, by offering coupons or discounts, so that they will reach the critical number of purchases to become loyal.
Test our cohort analysis software for free
datapine is an easy-to-use and flexible SaaS BI tool that offers professional cohort analysis without the need to learn how to work with complicated statistical software. It enables you to quickly analyze different customer segments and visualize trends and activities. You can easily conduct your own analysis by using our intuitive drag-and-drop interface. The generated insights can be automatically shared among your colleagues by setting up automated reporting guidelines. Your reports can also be accessed via a mobile device, on-the-go, which reduces time and effort of the IT department to perform complicated analysis and ensures speedy delivery of requested business queries. Every business user, from c-level executives, department managers, and employees can utilize the benefits of a powerful analysis tool that saves time and reduces costs. That way, business productivity increases while the budget saved.
With datapine, ensure a fast calculation of your cohorts, even with big data sets. Of course, we follow extremely strict security standards and processes to ensure that your data is safe with us and is only accessed by authorized members of your organization. It only takes a few minutes to set up and connect it to your data. Modern BI reporting tools with advanced data analytics including cohort analysis doesn’t have to be expensive or have a complicated interface - sign up for a 14-day free trial with datapine today and start generating valuable insights now.


We were amazed how easy it was to use datapine and get the first KPIs within a couple of minutes. datapine is definitively a game changer for us as now all decision makers have quick, easy access to ad hoc analysis, KPI dashboards and reports.Sebastian Diemer, Founder at KreditechGO TO PRODUCT OVERVIEW
Become a data wizard in less than 1 hour!