7 Customer Metrics & KPIs To Track For Happier Clients & More Revenue

“Every company's greatest assets are its customers, because without customers there is no company.” - Michael LeBoeuf.
Your customers are the lifeblood of your business. Whether you are B2B or B2C, fulfilling your customers’ wants, needs, and expectations on a consistent basis will make the difference between a rock solid company with an upward trajectory and yet another failed business. There are many, many books and resources devoted to how to improve your relationship with your customers. However, actually measuring your relationship with your customers isn’t talked about nearly as much. We decided that we needed to do something about that, because if you can measure your relationship with your customers, it’s much easier to improve it. Here at datapine, we pride ourselves on making data actionable and easy to understand. That is why in this article we are going to go into 7 customer KPIs related to your customers’ relationship with your business, helping you in the elaboration of your customized KPI dashboards. These customer metrics will improve your ability to serve your clients - but which ones should you choose?
How To Choose The Right Customer Metrics
You should choose the KPIs that most accurately reflect how well you’re executing on your core business model.
So if you’re primarily a B2B SaaS company that gets its business through cold emails and referrals, using Recommendation Rating (KPI #2), Lifetime Customer Value (KPI #4), and Customer Acquisition Cost (KPI #5) would make a lot of sense.
Or, if you’re a brick and mortar store that sells consumer goods, you may want to focus on your overall Customer Satisfaction (KPI #1) and Customer Effort Score (KPI #7).
Finally, if you’re an e-commerce store that uses a lot of Google AdWords and Facebook ads to drive traffic in addition to selling to an email list, your checkout abandonment rate (KPI #6), Customer Acquisition Cost (KPI #5), and email open rate (KPI #3) would be very useful KPIs to look at.
If you’re currently not tracking any of these KPIs, just start out by keeping track of 2-3. That way you won’t get overwhelmed by information - but you’ll still be making more effective and data-driven decisions.
1) Customer Satisfaction
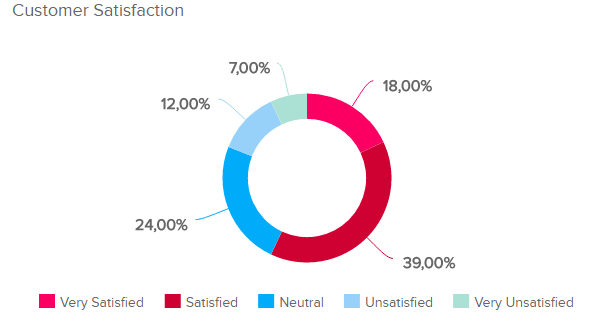
This is probably the most well known customer KPI of all time - even by consumers with no business experience. Almost everyone has been asked at the end of a customer support call or chat, “How satisfied are you with your experience?”.
Even apps are doing this now - they’ll ask users how they would rate the app while they are using it, and then transfer that rating to the iOS or Google Play store. Customer satisfaction is quite useful as a metric because of how simple is is. You’re essentially asking the question: “How do you feel about dealing with us?”. Here are a few ways you can get a read of this KPI according to your business:
- As a brick and mortar store, you can put a link to a web survey on your receipts.
- If you’re a SaaS business, you can have a popup one question survey that displays while users are browsing your site.
- You can simply email a survey to your customers.
Whatever you choose, make sure to incentivize customers through loyalty points, a discount code, or entrance into a sweepstakes - or else almost nobody will fill out the survey. Giving incentives also makes your data more accurate, as otherwise only the truly angry or absolutely ecstatic customers will answer your questions, leading to skewed results.
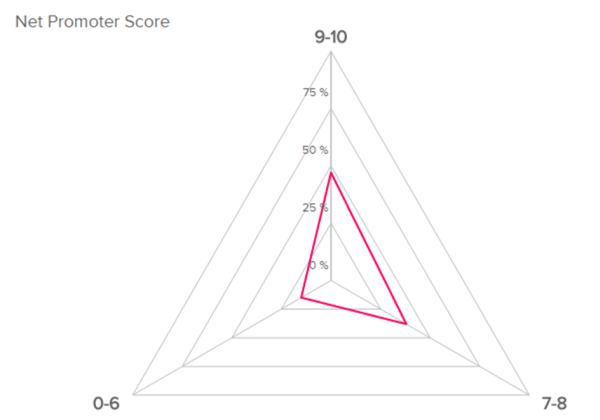
2) Net Promoter Score
Referrals are one of the best possible forms of marketing in almost any business. Referrals cost you nothing, carry a lot of trust and credibility, and are a sign that your product or service is truly serving your customers.
So how do you figure out how often your customers recommend you to others? You use what’s called the Net Promoter Score. This Customer KPI has been found by the Harvard Business Review to correlate with higher company income as the Net Promoter Score has increased.
Source: sketchbubble.com
Here is how to calculate Net Promoter Score, as explained by this helpful Survey Monkey article. You ask your customers this question through whatever mechanism works best: “How likely is it that you would recommend us to a friend or colleague?”. You put the responses into 3 groups:
- 0 – 6: Detractors
- 7 – 8: Passives
- 9-10: Promoters
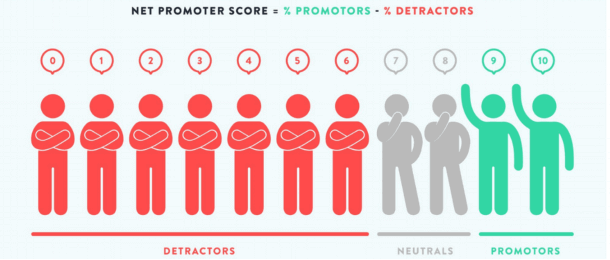
Then you do this equation:
(Number of Promoters — Number of Detractors) / (Number of Respondents) x 100.
Here are some other ways to view this equation:
Net Promoter Score = % of Promoters - % of Detractor
Net Promoter Score = (#Promoters/Total responders) - (#Detractors/Total responders)
3) Email List Open Rate
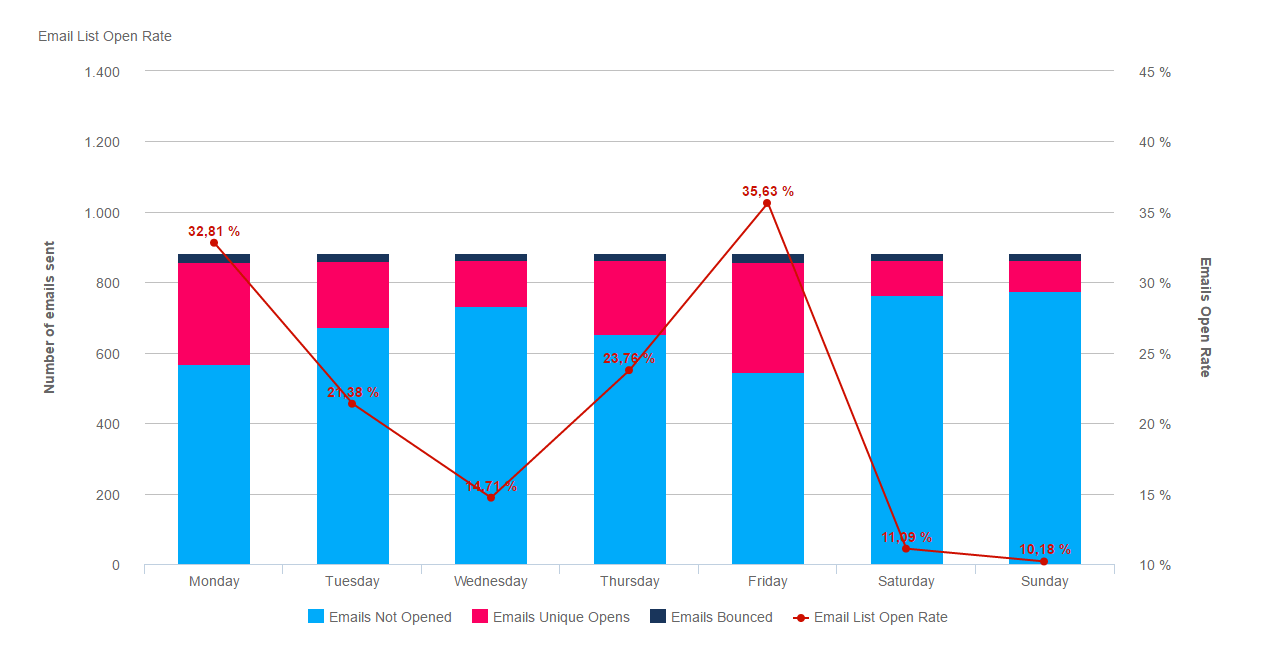
** click to enlarge **
This customer KPI is an easy one to quantify as it simply is the ratio of your emails open divided by the total amount you sent out. If you conduct a significant amount of your business online, your email list is one of your company’s biggest assets. However, even if you do all of your selling in a brick and mortar retail store, an email list can be an incredible way to market to your customers.
With that being said, email marketing doesn’t work well if none of your customers are opening your emails. Thinking about the trend of your email open rates over time is better than comparing your company’s open rates to some generic “average open rate’ by industry. If your email open rate was significantly higher a year ago than it is now, that’s an issue that should merit some concern. Is it because:
- Your email subjects & headlines are bad?
- You are not using a trusful email sender?
- Your emails are covered as spam from email providers?
- You aren’t giving your customers valuable content/offers in the emails themselves and therefore they stop to open them?
This isn’t a minor concern. Depending on the size of your company and email list, a small reduction in open rates could have big implications on your bottom line.
4) Customer Lifetime Value
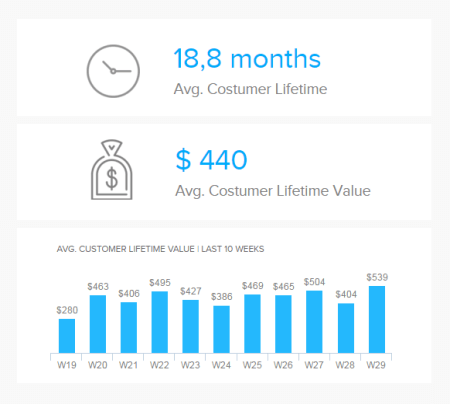
This customer metric is especially relevant to SaaS companies, but it’s useful for any kind of business (although it may be hard to track for B2C brick and mortar companies without a rewards program). We define the Customer Lifetime Value (CLV) as “the amount of money you would expect to make from a customer over the lifetime of your relationship.”
If you’re a SaaS company, the logic is easy: once you’ve acquired a customer, the longer you can keep them paying, the more profit you’ll make. However, any business based on email marketing also can make great use of the CLV metric.
As true email funnel pros know, you make most of your profits off your die hard fans who buy all of the upsells in your funnel. So finding more ways to increase the CLV of your best customers can directly translate into much better profit margins.
5) Customer Acquisition Cost
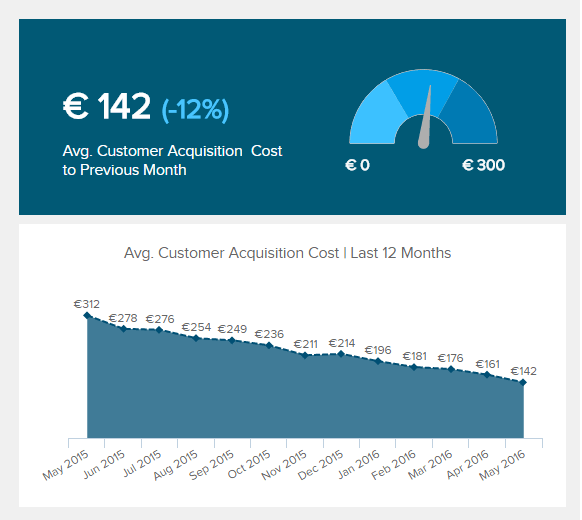
While this metric may not be as relevant for all brick and mortar stores, for B2B businesses and SaaS companies, the Customer Acquisition Cost (CAC) is a crucial customer metric. It represents all the costs you invest in order to sign in a new customer.
CAC and CLV are also intimately linked. Let’s say that you are a SaaS company that gets a lot of new leads through paid traffic. Since on most paid traffic platforms you are “bidding” for clicks, if you have a higher CLV than your competition, you can “afford” to have a higher customer acquisition cost than your competition while still remaining profitable.
However, if you are in the early stages of your business and your CLV isn’t as high as you would like it to be yet, you may have to find other traffic sources that are less expensive in order to bring your CAC down and keep your cashflows healthy.
6) Checkout Abandonment Rate
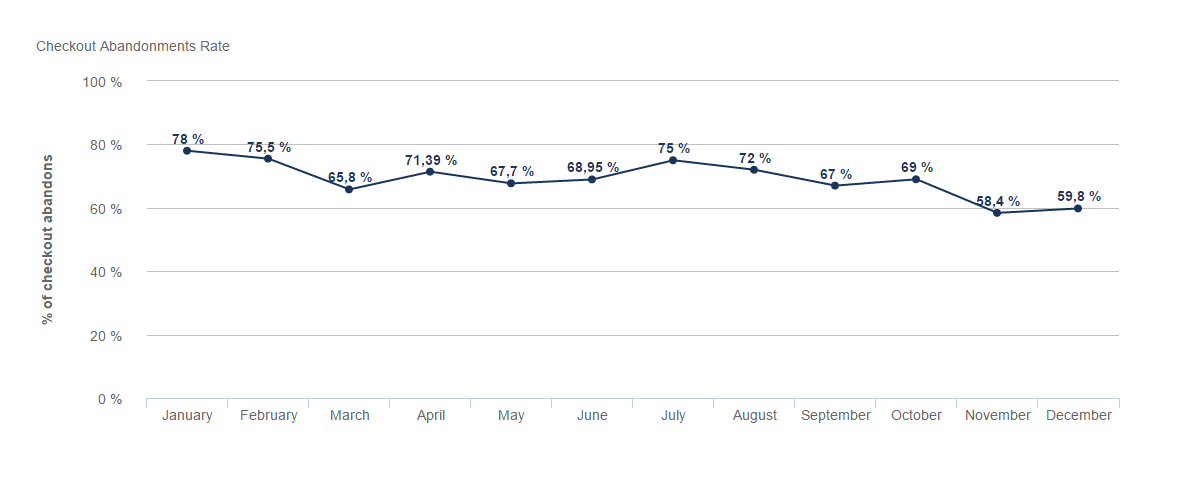
** click to enlarge **
While this customer KPI is useful for any business with an online sales process, it’s mostly applicable to ecommerce companies. When people are putting items into a shopping cart without checking out (and paying), you’re leaving money on the table. The average checkout cart abandonment rate is pretty high - 69.23% according to the Baymard Institute, which focuses on ecommerce research. Why do customers abandon their carts?
Well, many people are just doing the online version of “window shopping”. As the Baymard Institute states: “...a large portion of cart abandonments are simply a natural consequence of how users browse e-commerce sites – many users will be doing window shopping, price comparison, saving items for later, exploring gift options, etc. These are largely unavoidable cart and checkout abandonments.”
However, many of the remaining reasons are within your control, and are shown in this useful graph by the Baymard Institute:
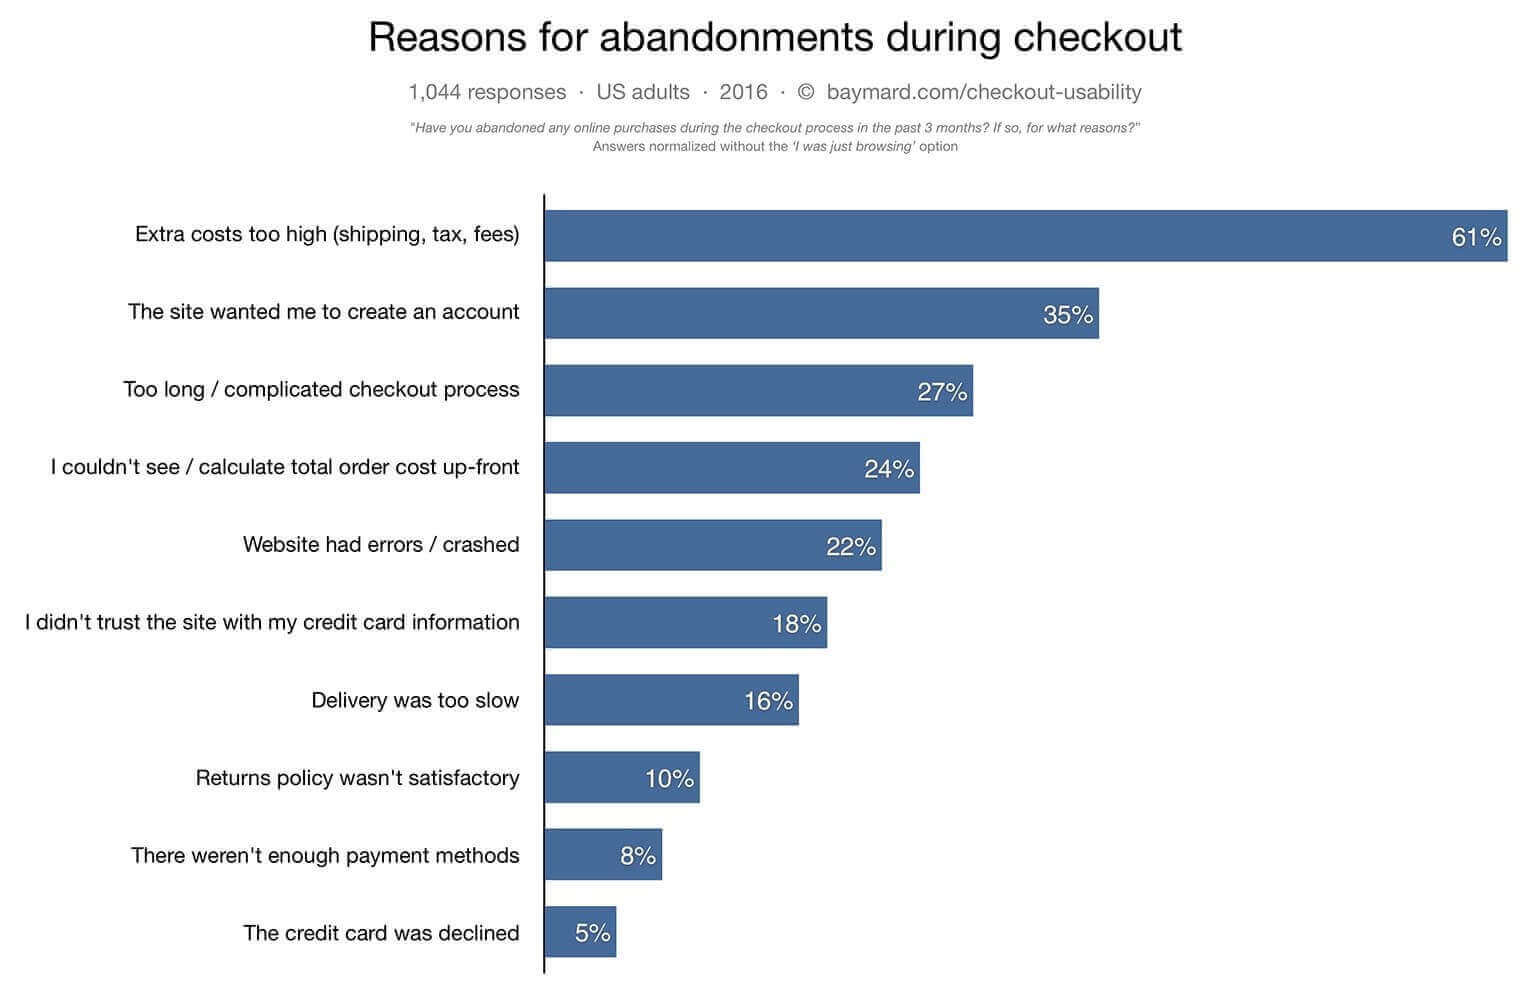
** click to enlarge **
7) Customer Effort Score
This is a very useful metric for both SaaS companies and for brick and mortar stores. Basically, the customer effort score asks your customers how easy it was to get what they wanted from your company.
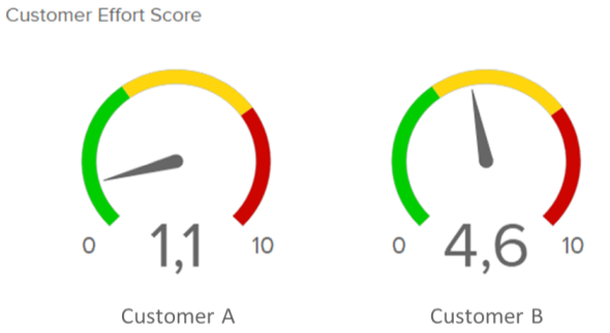
If you’re a SaaS company, you need to have a low Customer Effort Score - otherwise, users will complain that your offering is too hard to use, and they’ll cancel. If you have a retail store, you want to make sure that customers aren’t getting frustrated looking around for the right items. Here’s the question to ask: “On a scale of 1-10, how much effort did you have to expend while using our product?” Or for a retail store, “On a scale of 1-10, how hard was it to find what you wanted today?”
The 7 Customer Metrics You Should Track
- Customer Staisfaction
- Net Promoter Score (NPS)
- Email List Open Rate
- Customer Lifetime Value (CLTV)
- Customer Acquisition Costs (CAC)
Customer KPIs are incredibly important to your business. If you aren’t keeping track of any of the 7 above customer metrics on a regular basis, now is the time to do so. You don’t need to track all of these KPIs, and you probably shouldn’t, as you might get overwhelmed over time. Because the true value of these KPIs doesn’t come from a one time “snapshot” but rather from examining the trends from quarter to quarter. To automate this process it makes sense to take advantage of a professional CRM dashboard.
At the end of the day, make sure to examine different KPI examples and pick the ones that are most relevant to your core business model, and use that data to improve your customer experience.