
KPI Examples for Google Analytics
Google Analytics Key Performance Indicators and Metrics
✔ See different templates & designs ✔ Find & track the right Google Analytics KPIs to optimize your website performance
A Google Analytics KPI is an objectively measurable performance indicator used to monitor, analyze and optimize user behaviors on websites. Google Analytics metrics, among other things, help website managers in the operationalization of their marketing goals.
Here is the complete list of the most important Google Analytics KPIs and metrics, that we will discuss in this article in every detail:
Sessions and Users: How does the website traffic develop?
New and Returning Visitors: How often do users return to the website?
Bounce Rate: Are the visitors' requirements being met?
Goal Conversion Rate: Do visitors perform desired target actions?
Time on Page: How much time do visitors spend on a page?
Average Page Load Time: How important is the page speed, actually?
Bounce Rate by Browser: Are there issues with certain browsers?
Organic vs Paid Sessions: What is the share of organic traffic?
Average Session Duration: What is the quality of the generated traffic?
Top 5 Search Queries: What are the most common search queries?
Users by Gender: What is the gender and age distribution?
Pages per Session: How many pages are being visited on average?
Best Pages by Gender: What content has the most page views?
Top 10 Landing Pages: Which landing pages are most relevant?
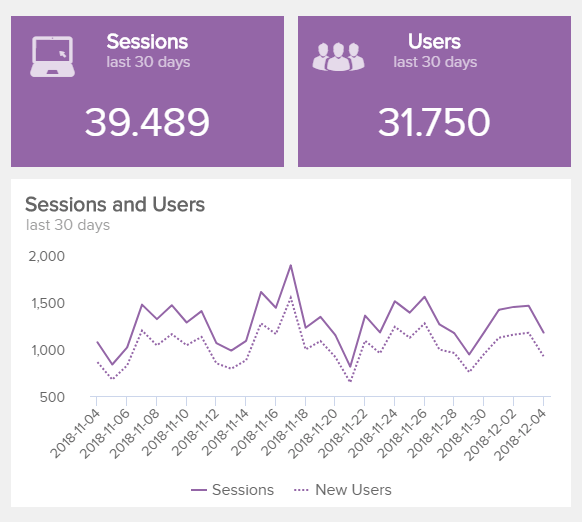
Number of Sessions & Users
How does the website traffic develop?Our first two Google Analytics KPIs form the fundamental basis for monitoring the traffic to the tracked website: the number of sessions and users in the considered period. In Google Analytics (GA), each visitor is initially referred to as a user, whereby a distinction is made between new users and returning visitors. In addition, each user who visits the website also generates a session. A single user can open several sessions, whereby the tracking of a session is terminated after 30 minutes of inactivity on the one hand and at midnight on the other. Therefore, the number of users can never be greater than the number of sessions.
Performance IndicatorsMonitoring the quantitative development of website traffic is the cornerstone of website performance and an important component for further analysis.
Relevant Showcase Dashboard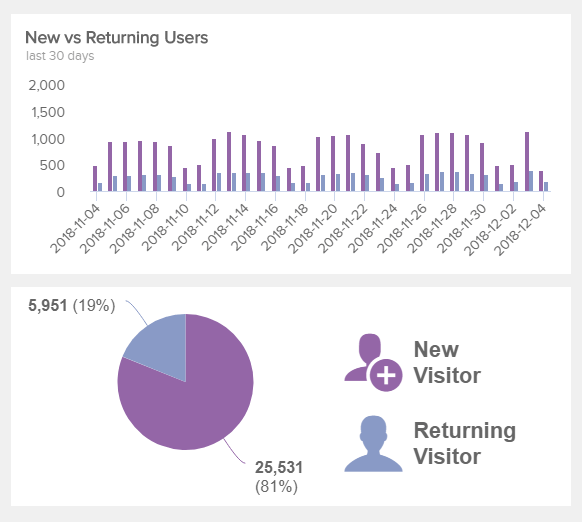
New and Returning Users
How often do users return to the website?The distinction between new and returning visitors is very helpful, as these two user groups often differ greatly in their website behavior, which can then be viewed separately. As a rule, returning visitors already have an increased interest in the offered website content or brand and can, for example, be guided to the desired target actions with the help of dynamic, individualized content. The relationship between new and returning visitors to a website is influenced by numerous factors: the business model, the industry, the marketing channel responsible for the initial first contact, the user's intention and many more.
Performance IndicatorsAnalyze the behavior of new and returning visitors in more detail in order to gain valuable new insights to improve performance. With the help of remarketing, you can increase the number of returning visitors.
Relevant Showcase Dashboard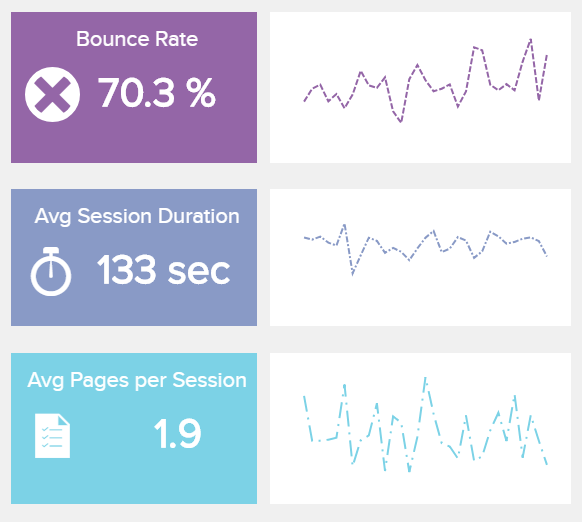
Bounce Rate
Are the visitors' requirements being met?Our third Website KPI is the bounce rate, which describes the percentage of sessions in which a single page on the website (the "landing page") was visited. Usually, the bounce rate is a good indicator of whether the visitor finds the desired content on the website and whether the respective demand has been satisfied. If this is not the case, the visitor often leaves the website without further interaction and "bounces". Please note that you can also define bounces in GA individually, for example, when a session with certain actions on the landing page (e.g. events) is not counted as a bounce even if no further page is visited.
Performance IndicatorsFor an initial, quick evaluation of the quality of the website traffic, the bounce rate is helpful. A low bounce rate usually correlates with a higher average session duration and a higher number of pages viewed per session.
Relevant Showcase Dashboard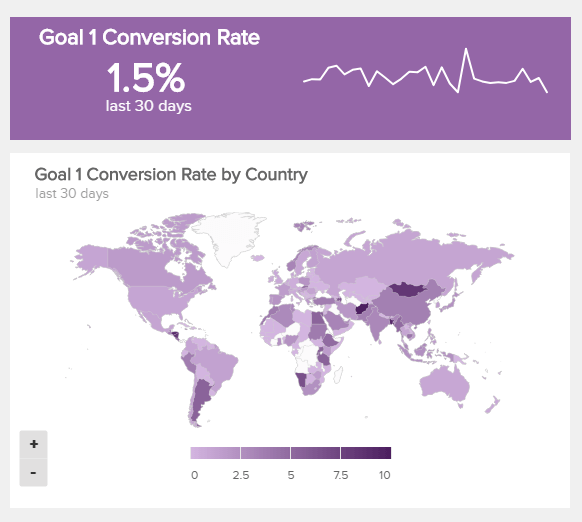
Goal Conversion Rate
Do visitors perform desired target actions?In online marketing, a conversion is the execution of a desired target action by a website visitor. For example, an online purchase, a newsletter subscription or a contact registration. In Google Analytics you can create a maximum of 20 conversion goals, or target actions, which are tracked from the time they are created. You can also attribute a monetary value to these conversions. Detailed conversion tracking is the basis for in-depth analyses and sustainable optimization of website performance to achieve the defined business goals. Conversion rate optimization (CRO) plays a central role in increasing the goal conversion rate.
Performance IndicatorsDefine and create target actions in Google Analytics to cover all relevant business goals. View them from different angles in your analytics, such as for different marketing channels, landing pages, product categories or geolocation.
Relevant Showcase Dashboard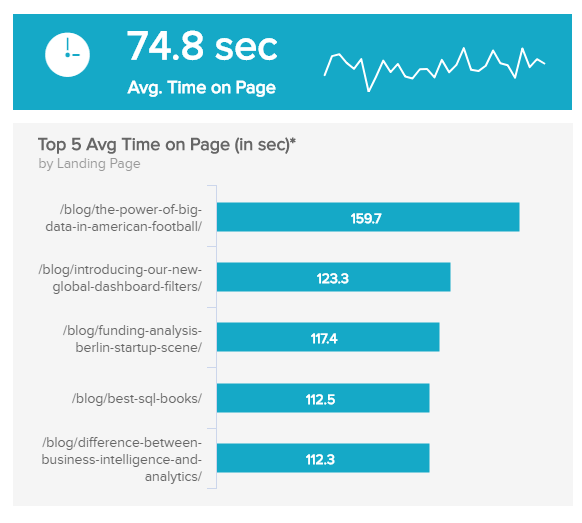
Average Time on Page
How much time do visitors spend on a page?Our next 3 Google Analytics KPIs focus on the so-called "page tracking", i.e. the performance measurement of individual pages of a website. The time on page shows how long visitors have stayed on average on an individual page or URL. Like the bounce rate, it is a good indicator of the quality of the traffic on a page and reflects how well the visitor's needs are met. In our visual KPI template you will find the average time spent (74.8 seconds) as well as the times for the 5 landing pages with the highest time duration. Such an overview helps you to quickly identify the most interesting content on the website.
Performance IndicatorsThe time on page and average session duration are very often misunderstood. Be sure to consider the way these metrics are calculated when interpreting them.
Relevant Showcase Dashboard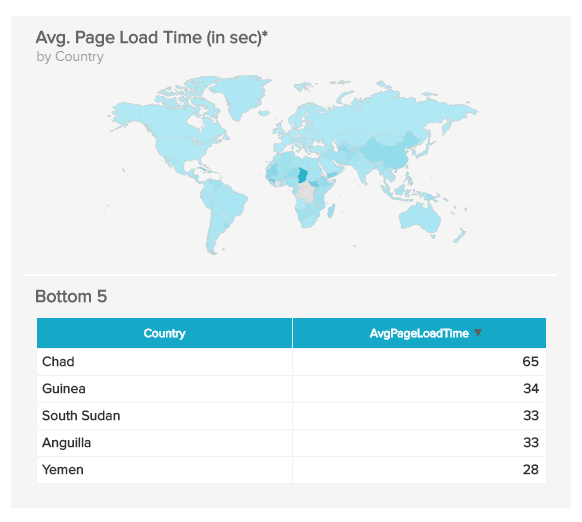
Page Load Time by Country
How important is the page speed, actually?The average page load time or page speed is undoubtedly a key success factor for your website performance, and in many various aspects: 1) Users: long loading times are no longer tolerated by most visitors in the digital age and lead to an increase in the bounce rate. 2) Search engines: loading times are a relevant ranking factor for the organic search. 3) Paid advertising: the loading time for Google Ads, for example, indirectly influences the quality factor via the landing page experience and thus the click prices. 4) Mobile first: especially for the constantly increasing number of mobile accesses, short loading times are critical for success 5) Data volume: measures to optimize loading times (minimization of images, CSS, JS, HTML, etc.) inevitably lead to lower data traffic.
Performance IndicatorsTo analyze page load times with the help of GA with as accurately as possible, make sure to increase the proportion of tracked visitors to 100% (see opt_sampleRate). Analyze the page speed for individual pages and countries in detail.
Relevant Showcase Dashboard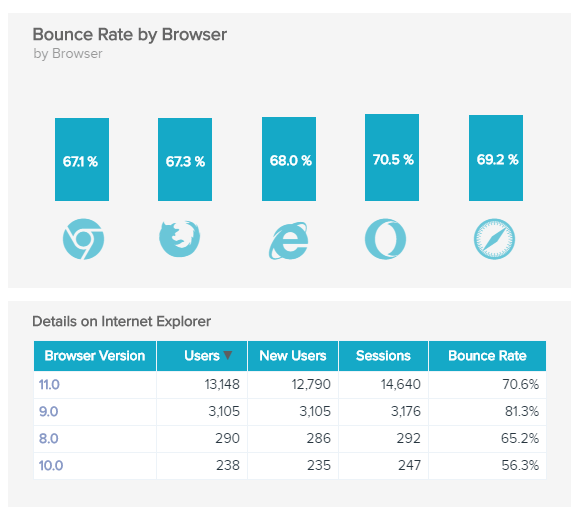
Bounce Rate by Browser
Are there issues with certain browsers?A high level of browser compatibility is nowadays a central requirement for a successful web presence. In practice, however, browser-based problems occur again and again, which can lead from harmless minor display errors to the total loss of function of individual pages or functions. Some of these problems also occur after browser updates, so that this problem may not have existed when developing the website. You can use our Google Analytics KPI example to continuously monitor the relevant browsers and browser versions. As a rule, you should be able to identify problems by an increased bounce rate. In addition, you can also analyze the time on page and the corresponding conversion rates.
Performance IndicatorsWith the help of GA, first analyze which browsers and browser versions are most frequently used by your target group. Based on this, you monitor the most relevant combinations in detail.
Relevant Showcase Dashboard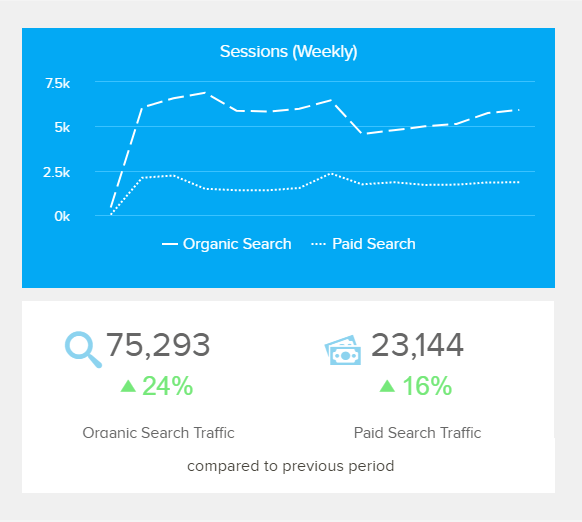
Organic vs Paid Sessions
What is the share of organic traffic?We will explain our 3 following Google Analytics KPI examples with a comparison of organic and paid search engine traffic (Google, Bing, Yahoo, Yandex etc.). First of all, we compare the number of organic and paid traffic in Google Analytics. This shows that the proportion of organic visits is over 75%, which suggests an SEO focus (Search Engine Optimization). The proportion of paid search engine advertising (SEA) is thus less than 25%, but at the same time it accounts for more than 20,000 clicks. Of course, the number of paid clicks generated is strongly dependent on the size of the corresponding budget, so this metric is rarely suitable as the sole performance indicator.
Performance IndicatorsAt this point, it is interesting to compare the number of clicks in the Google Search Console (organic traffic) and in Google Ads (paid traffic) with the tracked number of sessions in Google Analytics.
Relevant Showcase Dashboard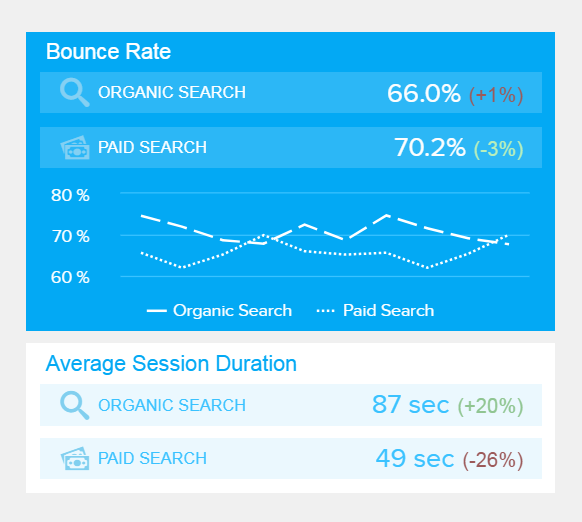
Average Session Duration
What is the quality of the generated traffic?Although the differences between SEA and SEO are obvious, the performance should always be considered individually, depending on the use case and industry. Frequently one area delivers also valuable findings for the other, and, therefore, the strategies and measures should also not be analyzed apart from each other. In Google Analytics, the average session duration and the bounce rate can be used to compare the quality of the generated traffic. The lower the bounce rate and the higher the average session duration, the higher the quality of the traffic and the conversion probability.
Performance IndicatorsThe average session duration and bounce rate are the standard metrics that you can use in GA to evaluate the quality of traffic. The comparison of the individual conversion goals also offers you even more detailed analysis options.
Relevant Showcase Dashboard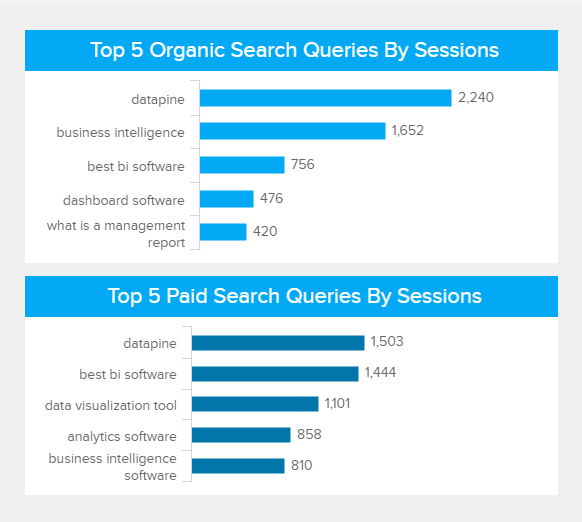
Top 5 Search Queries
What are the most common search queries?A comparison of the most frequent organic and paid search queries or keywords, which ultimately result in clicks, can also lead to valuable new insights: Do you receive the majority of clicks for dubious or irrelevant search queries? How many overlaps are there? Are different search intents covered? For example, in practice, transactional search queries (e.g. "buy business intelligence software") are often accessed via SEA, whereas more informational search queries (e.g. "business intelligence best practices") are often covered via SEO. The third main category are so-called navigation-oriented search queries, such as "dashboard datapine".
Performance IndicatorsTo get a detailed overview, compare and analyze the most common organic and paid searches in detail. You must link your GA account to Google Ads and the Google Search Console in order to obtain the search queries directly in Google Analytics.
Relevant Showcase DashboardBecome a data wizard in less than 1 hour!
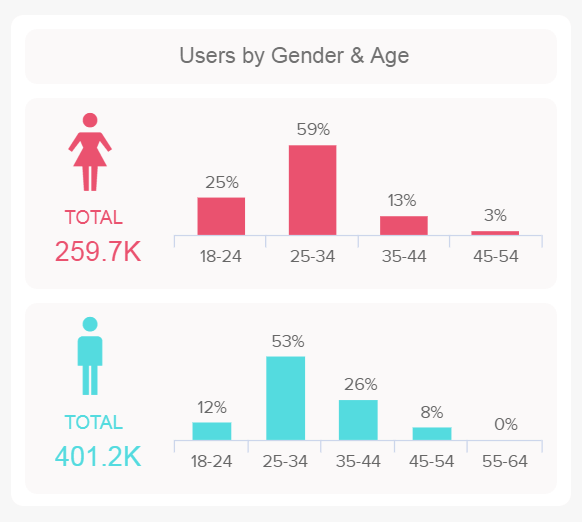
Users by Gender
What is the gender and age distribution?Google Analytics provides a variety of demographic characteristics of website visitors: for example, age, gender, and general interests. This data is particularly important for marketing in tailoring content to specific target groups. However, the availability of demographic data in your GA account is not set by default, therefore, you need to enable the reports on demographic characteristics and interests. In our visual Google Analytics KPI example we have clearly compared the gender and age ratio of website visitors.
Performance IndicatorsWith the help of the demographic data of website visitors, you can, on the one hand, ensure that you reach the predefined target group and, on the other, identify new (converting) target groups.
Relevant Showcase Dashboard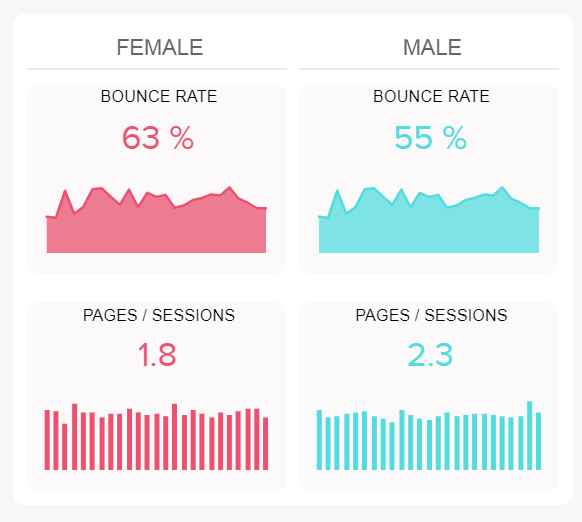
Average Pages per Session
How many pages are being visited on average?The average number of pages per session can be used to evaluate the quality of the traffic received, just as the bounce rate and the average session duration. We have illustrated this as an example for male and female visitors. Due to the lower bounce rate and correspondingly higher number of pages visited per session, a higher conversion potential of male website visitors can be derived from this data. As already mentioned, you should additionally analyze or confirm this with the help of your individually defined conversion goals.
Performance IndicatorsIf conversion tracking is not (yet) implemented, you do not have access to it, or the number of target actions tracked so far is very small and therefore does not allow meaningful analyses, use the 3 key figures discussed to evaluate traffic quality: bounce rate, session duration and pages visited per session.
Relevant Showcase Dashboard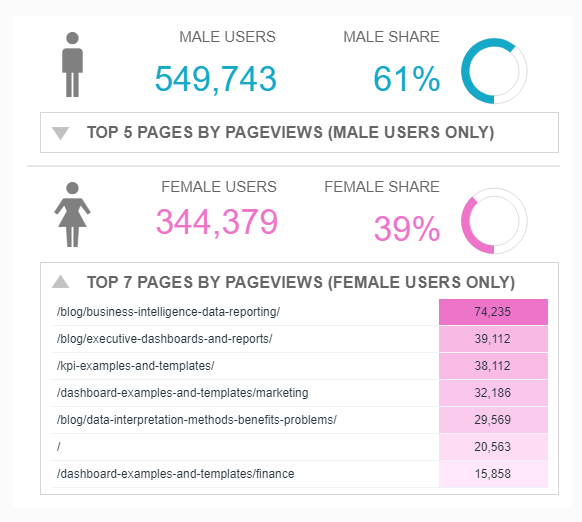
Best Pages by Gender
What content has the most page views?In our penultimate visual Google Analytics KPI example, first we show you the general gender distribution of website visitors and also give you the opportunity to view the most frequently viewed pages of both genders. Such an overview helps you to identify gender-specific differences on the one hand and to take this into account when addressing and planning future content on the other. We deliberately chose the page views rather than the number of users per landing page in order to record the differences on the pages visited afterwards, because here are often significant differences in click behavior, too.
Performance IndicatorsIdentify gender-specific topics and behaviors on the web page to take into consideration in your content and website design.
Relevant Showcase Dashboard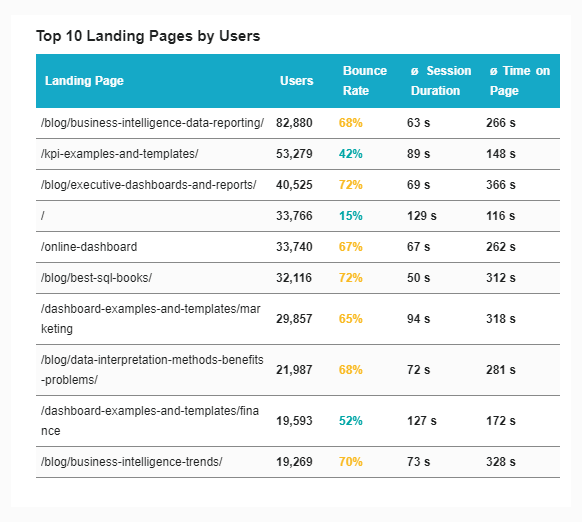
Top 10 Landing Pages
Which landing pages are most relevant?In practice, it is often the case that more than 90 percent of traffic is generated on a maximum of 10 percent of all landing pages, especially in the case of organic visits. Accordingly, "problems" or optimizations for these pages also have the highest influence or potential on the development of the generated overall traffic and should be monitored in detail. As an example, we have shown you this for the 10 landing pages with the most visitors, but also a descending ordering according to the number of conversions would be very useful. In addition, you will find the key metrics, already discussed in detail, for evaluating the quality of traffic: the average bounce rate, session duration and time spent on site.
Performance IndicatorsMonitor the quantitative (sessions and users) and qualitative (bounce rate, retention time and conversions) performance of your most important landing pages in detail, as they have the greatest leverage on achieving your marketing goals.
Relevant Showcase Dashboard


Setup only takes a few minutes. No credit card required!