9 Call Center Metrics & KPIs You Need To Know For Excellent Customer Service

Data is crucial for successfully running an inbound call center. With so many calls coming in each and every day, it can be quite hard to know what’s going on without meaningful metrics. This makes choosing the right metrics very important, as when you choose to focus on a given call center KPI, you are implicitly saying that this metric represents an important reality in your business. And if you’re going to spend all of the effort to quantify and track that metric, you want to get a positive return on your investment. To consolidate all your data and make the most out of it, consider using a KPI software that will help you in the elaboration of various business dashboards.
Explore our 14-days free trial & get the best out of your call center data!
Why You Need To Track Your Call Center Metrics
"Customers don’t expect you to be perfect. They do expect you to fix things when they go wrong." – Donald Porter
Once upon a time, brands, businesses, and organizations made strategic call center decisions based on educated guesses and vague insights. However, this is no longer the case. The evolution of digital technology means that, to assess performance, set valuable goals, increase efficiency, and boost service levels, call center managers can make informed strategic choices by analyzing comprehensive call center metrics and KPIs.
According to a Harvard Business Review, the number one factor in consumer loyalty is a reduction in customer effort. What's more, 77% of people state that valuing their time is the most essential thing a business can do to provide customers with solid service. A recent survey from Call Center Helper discovered that according to 380 call center managers, 95.7% viewed Customer Satisfaction Levels as their most important metric.
With all this in mind, it's clear that to run a contact center to its optimum ability, taking measures to boost customer satisfaction levels and reduce call waiting time is critical. Not only this, but by using comprehensive metrics you also stand to reduce running costs, improve staff morale, enhance your NPS scores, and more.
In this post, you’ll learn 9 call center KPIs that you need to know. You don’t necessarily need to track all of these metrics. Just choose the ones that work best for you. For example, if you have a very small agency that is more focused on a low volume of high touch support calls, maybe your problem resolution time and call volume trends aren’t that important. A much more useful call center KPI would be how your customer rated their interaction with the customer support agent. On the flip side, if you offer customer support for a consumer product, your first response time and your call volume trends could be exactly what you need to be paying more attention to. A best practice you can get isn't only to track these metrics, but also to compare and visualize them altogether on a customer service dashboard for instance.
Just remember – knowledge is power, and this is especially true when it comes to call center performance. Now let’s get into these metrics!
Top 9 Call Center Metrics & KPIs To Stand Out
1) First Response Time
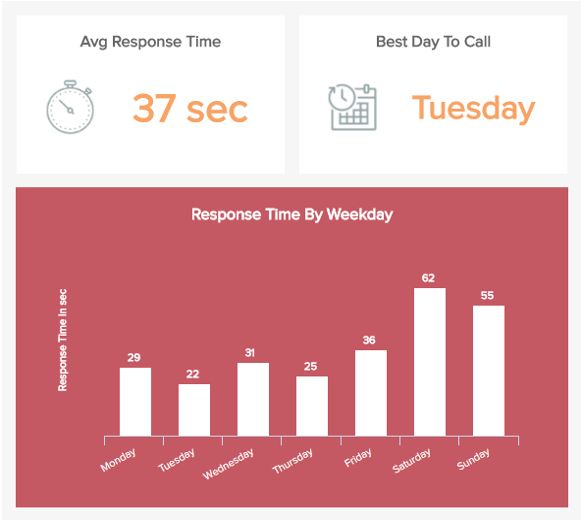
** click to enlarge **
This is our first and most important call center KPI, as it is the first (and most important) impression you will give when clients call your customer service.
Nobody enjoys being put on hold. Despite how cheery and upbeat your waiting music may be, it’s unlikely that customers are going to be downloading it to their phones anytime soon. When people call your center, it’s because they have a problem that is important enough that they are willing (or forced to) spend time on resolving it. By getting your customers on the line with a support rep relatively quickly, you can respect their time and give customers a positive impression of your brand. On the graphs above, response time is shown per hours of the day and per days of the week. Later in this article you will also find this metric displayed on an annual basis.
How long is too long when it comes to waiting? Well, that’s a bit subjective, so let’s turn to some hard data to help us make this decision. This helpful graph created by OrdelrlyQ from a study by Call Centre Helper shows how many customers hang up as time passes while they are waiting to talk to a customer support rep.
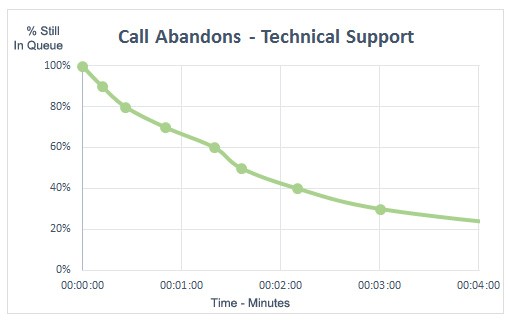
As you can see, about 35% of callers will hang up within 1 minute of waiting. After 3 minutes of waiting, about ⅔ of your callers will have hung up.
While it’s hard to calculate a direct cost for these missed calls, it’s not hard to imagine. If someone has a problem calls you, and is forced to wait for longer than they’d like, leading to a hang up… they probably won’t refer you new customers.
They also are more likely to:
- Rant on social media about your poor customer service
- Stop using your product or service
- Complain to their friends and family about your poor customer service
The solution is simple: make sure you have enough representatives to handle your expected calls at any given time and date – and then throw in some buffer. Obviously this is easy to say, and much harder to execute. Why do you need the buffer? Because you inevitably will make errors in regards to predicting how many people will call in, and there’s not much you can do about that. So you have to choose: do you err on the side of over-optimizing or covering your bases? Let’s examine these two choices.
Over Optimizing Vs. Creating a Buffer
Over optimizing: having exactly enough agents for your predicted demand, which saves money in the short run but could lead to very long waiting times if agents are sick and/or if there are many more callers than expected. Worst case scenario: you have a lot of very unhappy customers, leading to less referrals, good reviews, and revenue.
Creating a buffer: having more than enough agents for your predicted demand, which costs more money in the short run but leads to consistently short waiting times for customers, and average waiting times if agents are sick and/or there are many more callers than expected. Worst case scenario: you spend more money paying customer support reps than you would like.
We believe that a strategic, long term view is to accept the increased cost of more customer support reps, which hedges your bets against worst case scenarios. This is a view supported by the work of bestselling author Nassim Nicholas Taleb, who writes about decision making under uncertainty in the modern world. Taleb warns against the perils of over optimization in his book Antifragile, where he gives the example of a roadway where a 10% increase in traffic results in a 50% increase in wait time.
We won’t go too far into strategies to reduce your first response time here – just know that this is a KPI you definitely should be tracking, and actively working to make as short as possible.
2) Call Volume Trends
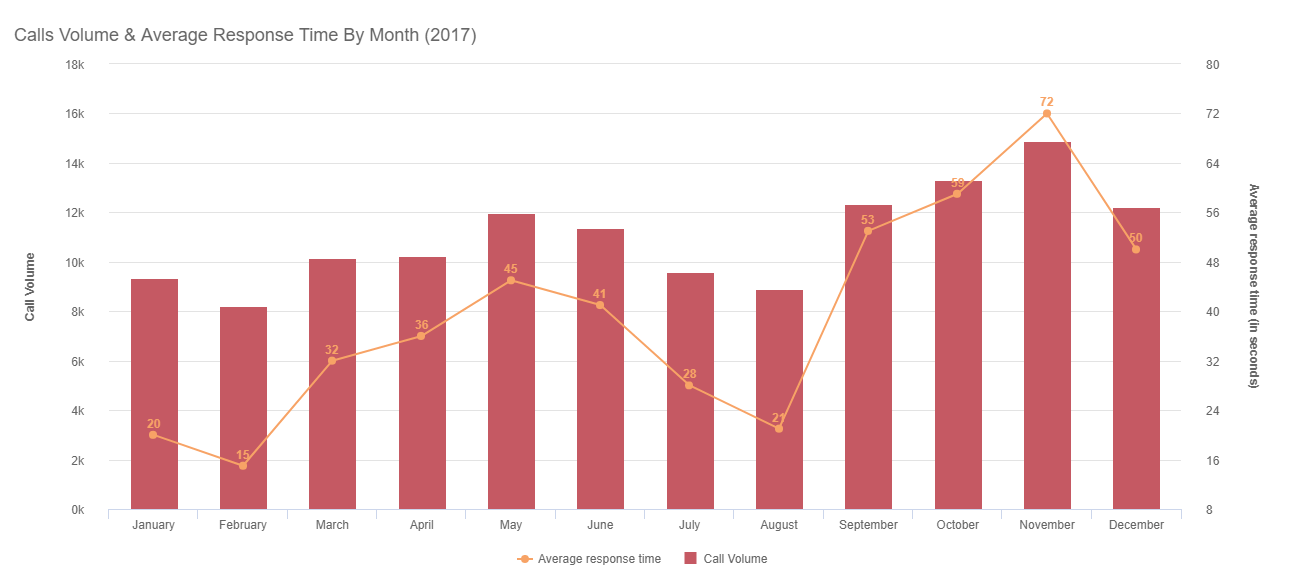
** click to enlarge **
Understanding your call volume trends is a really good way to keep your overall customer satisfaction scores up and your call waiting times down. All you have to do is keep track of how many calls you have while your call center is open. Then, over time, you can see things like:
- Your busiest times of day
- Your busiest days of the week
- Your busiest months of the year
Using this information, you can adjust your call center staffing needs accordingly. You can also use these numbers in an absolute sense: is your total number of customer support calls going up or down over time? In order to get a meaningful number here, you will want to compare your call volume to your number of customers, as all else being equal, more customers = more support calls.
With that being said, if you’re seeing a large spike of calls over the last 4-6 weeks, that could be an indication of a deeper problem. You may want to examine the content of these calls in order to determine if a new patch or product feature you’ve implemented is leading to all these additional calls from your customers.
3) Call Handle Time
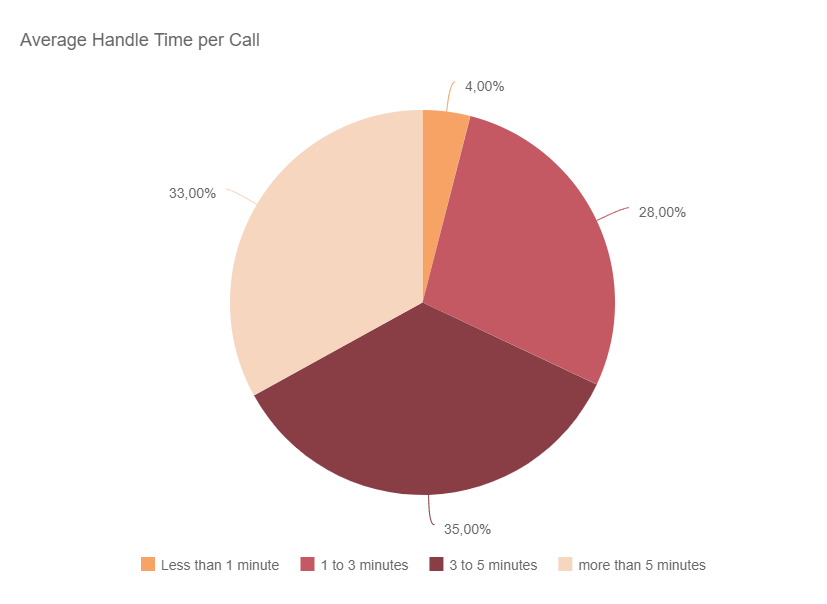
** click to enlarge **
This call center KPI essentially asks: how long are your average calls taking?
This metric can be a bit tricky however. While you want to provide your customers with a solution as quickly as possible so as to respect their time, you also want to make sure you are providing them with effective service and not just “hustling them off the phone”. As the customer experience company Impact Learning states in an article on problem resolution time (a different way of thinking about call handle time): “While keeping TTR [Time-to-Resolution] as short as possible is a goal of every technical support team leader, care needs to be exercised so that the goal doesn’t become ever-shorter resolution times. If root cause analysis is abandoned in favor of a quick workaround, or if rapport is jeopardized by an overworked or under-trained representative, then customer satisfaction can be diminished no matter how quickly an issue is resolved.”
You can set an optimal time per call for instance (3 minutes in our example below), and see how your agents place themselves around that target time. Then you should examine them and try to understand the reasons they have longer calls or on the contrary shorter ones, and if they are not too expeditious in the matter.
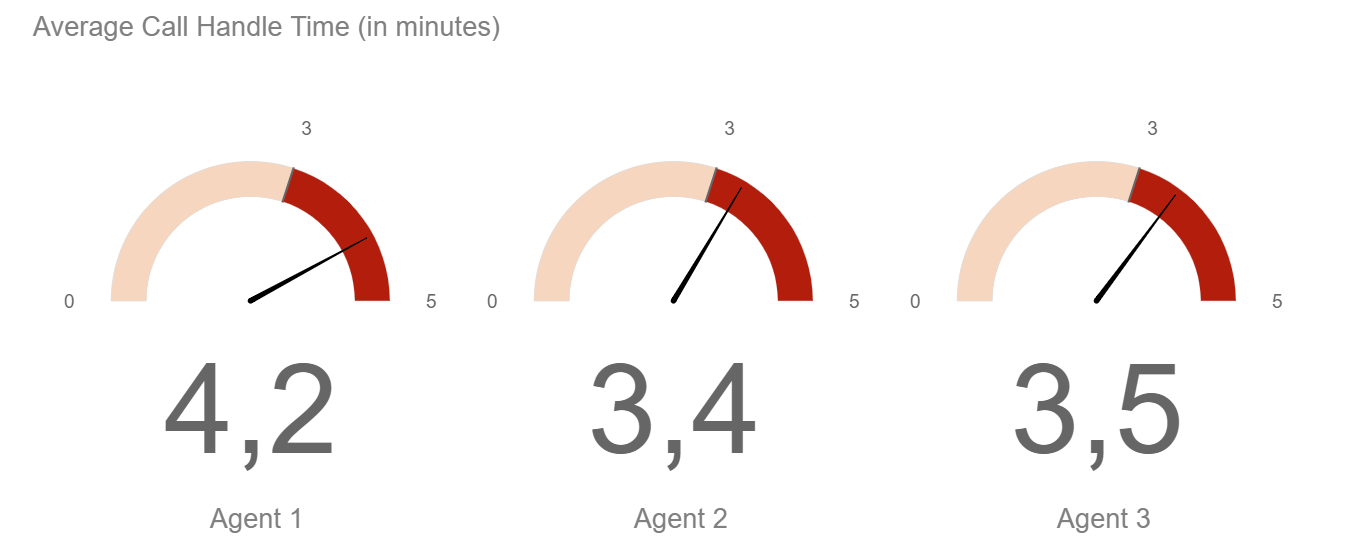
Generally, the goal shouldn’t be to make problem resolution time as short as possible. However, if you see a trend of your call handle time getting much longer than normal, that could be a sign that there is an inefficiency somewhere in your resolution process that needs to be addressed.
Explore our 14-days free trial & get the best out of your call center data!
4) First Call Resolution (FCR)
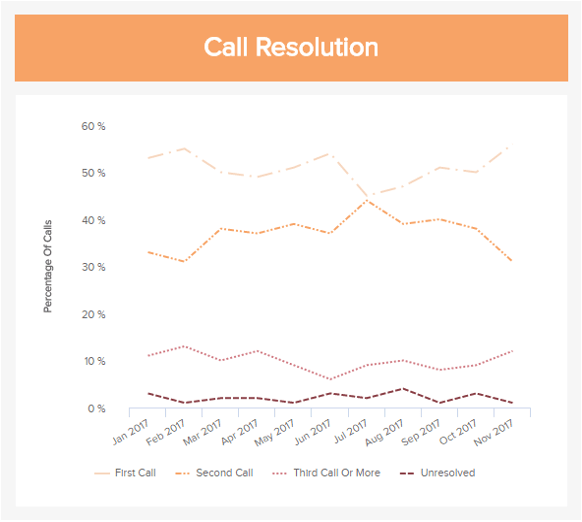
** click to enlarge **
Another important metric among the call center metrics. Imagine now one of your customer’s lives for a moment. It’s 6 pm. They just got home from a long day at the office, and they’re starving. However, your customer support center closes at 6:30, and so they call in because they need their problem fixed – now.
After calling in, they are told to do a couple of actions and then call back. The agent quickly gets off the phone, feeling great because the call was done so quickly. However, it would have been wiser for your rep to stay on the phone with your customer until the problem was resolved with certainty. Because if the actions your customer were given don’t work, now they have to call in again… and that’s a major hassle.
They might choose instead to not call in and stop being your customer. As ICMI writes in their article on call center success: “SQM research shows that if the customer’s issue is resolved on the first call, only 3% of those customers are at risk of defecting to your competitors – compared to a whopping 38% of customers at risk of doing so if their issue isn’t resolved on the first contact.”
We can’t stress this enough: the more respect you treat your customers with in terms of their time and energy, the better your brand will look in your customers’ eyes. So many modern companies drop the ball when it comes to call center support. You have the chance to shine and win more loyal brand promoters if you can resolve most of your customers’ issues on the first call.
How do you measure this metric? Well, it’s a bit hard to measure at times, but Call Centre Helper gives these ways of measurement:
- Does the caller get a useful enough answer on the first call so that they don’t have to call back?
- How many callers call back within 7 days?
- How do callers rate their support in post call surveys?
- Having a third party examine the quality of the answers given by support.
5) Quality of Recent Support
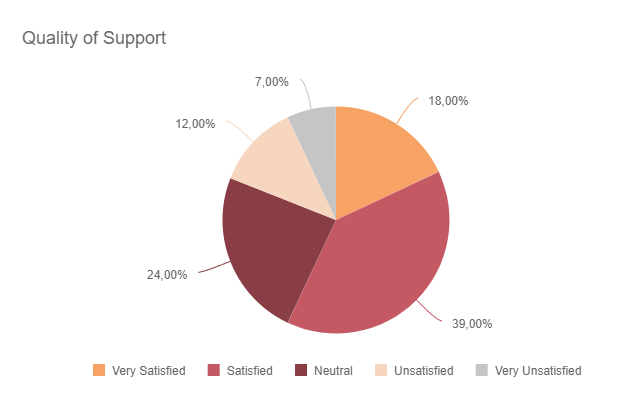
** click to enlarge **
Quality of recent support is a very telling customer support metric. In call centers, the modern trend is to ask customers at the end of the call using an automated system:
“How would you rate the quality of the support you received today?”
This metric is a bit more defined than overall customer satisfaction, as it’s specifically directed at the most recent interaction on the phone. This is call center KPI is very useful for determining which customer support agents on your staff are stars destined for manager status, and which ones need a bit more training. However, make sure you aren’t making decisions too hastily: there is variance and randomness with any measurement.
We all know that some customers who call a support line are simply upset about something completely unrelated to your company. These callers will tend to give low support ratings, at no fault of the agent in question. If one support agent gets unlucky, they might get more than their fair share of these irate callers.
So track this rating over at least a few weeks, if not a few months before making decisions based on this data. A few days is much too short to have a meaningful sample size with this metric.
6) Customer Satisfaction & Recommendations
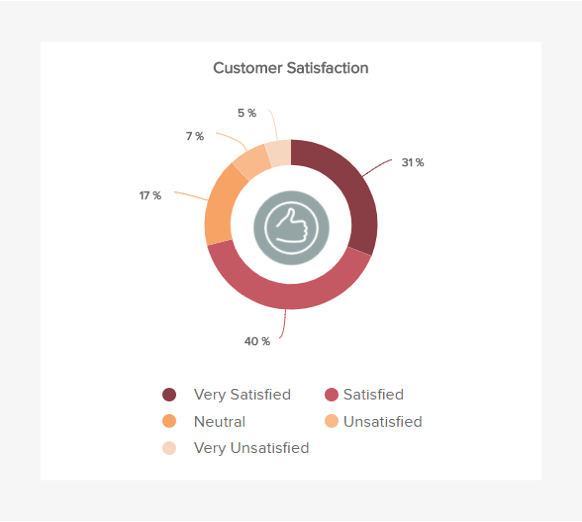
** click to enlarge **
Building on our previous point, the overall customer satisfaction level is vital to the success of any contemporary call center regardless of its size. It’s the beating heart of your entire operation, so monitoring and reacting to call center metrics of this kind is essential.
The Customer Satisfaction, inevitably linked to the Quality of Support, will give you a clear insight into what your customers think about you and your ability to support them with their needs. Despite the fact that your day-to-day operation could be efficient enough, there might be some problems that have escaped your notice - repetitive issues that can prove detrimental to the perception and future of your organization.
If your customers are facing the same issues over and over again, it will reflect poorly on your service levels. And, based on the fact that a happy customer will recommend you to an average of three friends, ironing out any perpetual kinks must be at the top of your priority list.
The better your Customer Satisfaction score, the more successful you will ultimately become. Should your service levels dip, you will be able to take appropriate action by rolling out digital customer feedback surveys and integrating a writing-box into your customer service journey so that customers can leave detailed feedback.

** click to enlarge **
In today's world, Net Promoter Scores count for a lot. By monitoring your satisfaction levels, you will be able to take measures to improve your NPS scores exponentially. Moreover, it's possible to measure your NPS scores as a call center KPI in its own right. By tracking and quantifying your NPS levels regularly, you can gain the ability to evaluate the power of your referrals.
On a scale of one to 10, how likely are you to recommend us? That's the burning question you need to ask your customers. If the score falls between 0-6, your customer is a detractor. If it sits in the region of 7-8, your customer is passive. You are lucky if it lands on 9 or 10; your customer is a definite promoter. Deduce the detractors to the promoters, and you get your Net Promoter Score.
Like satisfaction levels, NPS scores are a priceless loyalty metric. If measured correctly, they can help you scale and grow your business by using your customer service efforts as a key driving force. You can find more information in our article specifically dedicated to the customer satisfaction metrics, including the effort score and the NPS.
Explore our 14-days free trial & get the best out of your call center data!
7) Top Support Agents
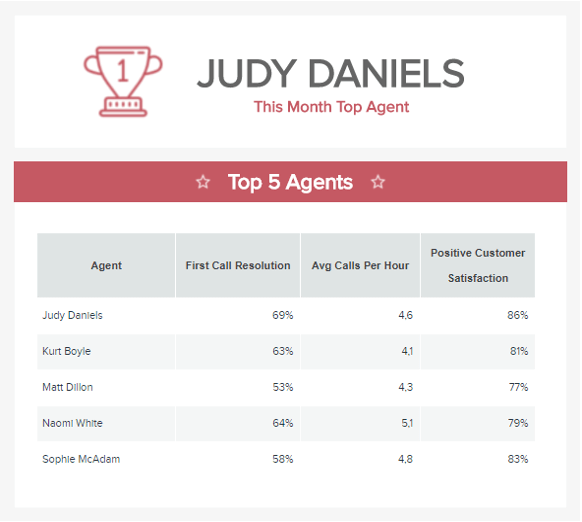
** click to enlarge **
A happy, motivated, engaged call center employee will not only remain productive, but will also provide your clients and customers with exemplary support on a consistent basis. That said, Top Agent Support is one of the most valuable call center metrics you can track.
In fact, highly engaged businesses benefit from a 10% increase in customer ratings.
By analyzing a host of customer service metrics such as First Call Resolution Rate and the number of calls handled per hour, you will be able to create a Top Rated Agent dashboard to monitor the success of each of your agents.
Using productivity metrics like this one will also help you understand which of your agents might need training or support and which one might be better suited to a more senior role. In addition to this, the Top Rated Agent metric will also help you when it comes to incentivizing, rewarding, and recognizing your team, thereby boosting staff morale and engagement.
While this particular call center metric is invaluable to any customer-facing organization, for the best results, you should track your Top Performing Agents dashboard over several months before taking any important action. That way, you'll be able to account for any minor inconsistencies you might encounter - we are all human after all.
8) Customer Retention

** click to enlarge **
One of the most valuable components of any successful business is customer loyalty. Retaining consumers is of vital importance, because it costs a business more to acquire new customers than to retain already existing ones.
This is a typical customer KPI that you can use for your call center. This metric is measured by dividing the number of customers making repeated business or purchases by the total number of active customers. Keeping a happy customer costs less than inciting a new prospect to your business and by being able to view your retention levels, you can ensure that your call center helps the business to become as efficient, economical, and profitable as possible.
The exact specific value varies depending on the nature of your business. For example, a car dealership has the potential for growth despite having a poor level of customer retention. An online retailer store, on the other hand, needs to maintain a high retention rate to secure sustainable commercial success.
A thriving retention rate is the main aim for most businesses, and as such, it should be one of your primary call center metrics. An exceptional brand image coupled with a superior satisfaction score will serve to boost your customer retention rates, in turn, boosting the overall success of your business.
9) Support Costs Vs Revenue
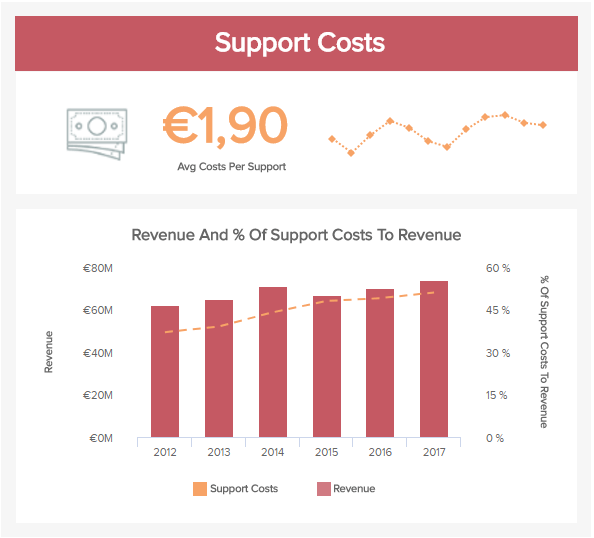
** click to enlarge **
Gaining a deeper understanding of how much your customer support costs (in terms of percentage) compared to your overall revenue will help you to streamline the running of your call center, making it all the more economical.
A common goal of businesses is offering the exceptional standards of customer service for the lowest possible costs. Keeping that in mind, this call center KPI is an absolute must on your list.
With the support costs versus the revenue metric, it's also possible to divide the total support costs by the number of issues incurred and to understand how much a single act of support costs your business. Call center support will also need investment but by gaining a panoramic snapshot of the costs, you will be able to keep them low while maintaining superior levels of service to your consumers.
Two effective ways to manage your support costs is by training your staff on a consistent basis and ensuring that your staff schedule meets the needs of your call center, crafting it so that your workforce is able to deal with unforeseen issues and busy periods.
It is best to measure call center metrics like this one over time, keeping a keen eye on your trend line. Should it peak at an unusually high percentage, you will be able to investigate the reason and take the required action to resolve the issue without losing a great deal of time or money.
Explore our 14-days free trial & get the best out of your call center data!
"Customers may forget what you said, but they'll never forget how you made them feel." - Anon
Running a call center is no easy feat. Even with the rise of social media, live messaging, and chat bots, people still like to use the phone to ask questions, request support, make purchases, and resolve issues. With so much activity and such little time, keeping tabs on support levels and running efficiency might seem impossible. By tracking the right call center KPIs and metrics, you will be able to grow, develop, and fortify your call center on a consistent basis, helping you to gain an all-important edge on the competition.
To start measuring the success of your call center, take a look at our online reporting software and if you have questions, please don’t hesitate to get in touch with us. We also offer a 14-day free trial!