Learn About The Power Of Big Data In American Football
 You guessed it right: today we'll talk about the exciting topic of the moment, the LI (51st) edition of the Super Bowl! On Sunday, February 5th, Houston will see the New England Patriots challenging the Atlanta Falcons, in a final always highly followed by millions of Americans. We at datapine took the opportunity to have a closer look at the role of analytics in American football, how the IoT and predictive analytics are changing the game, and what Big Data brings to that sport industry. Don't forget to check out our charts and tables at the end of the article to have a feeling of the hugeness of the Super Bowl and its evolution!
From The Origins Till Today: A Monumental Growth
On January 15, 1967 the Green Bay Packers took on the Kansas City Chiefs at the Los Angeles Memorial Coliseum in what is now deemed Super Bowl I. The Green Bay Packers beat the Kansas City Chiefs, 35-10. While the end goal of pummeling each other while attempting to score touchdowns hasn’t changed much, the NFL has evolved greatly since that warm LA day.
Since the first final played in 1967, popularity has grown: in the past 51 years Super Bowl viewership has grown from 60 million to upwards of 115 million. Even more shocking, the cost of a 30-second commercial has skyrocketed from $42K to over $5 million. Not to mention that even if the basic tickets can range from $800 to $2500, the average resale/second market price is beyond imagination: this year's current average resale price is $5,216, while the most expensive currently on the market sold as a "package" (with pre-parties, transportation and other perks) is close to $12,750. In parallel, include the growth of the league and all the rules, equipment, and style of play changes and you have a much different game. For football fans, none of this may be news. What may be surprising is that one of the biggest recent changes and possible disrupter is the role of big data in American football.
Sports statistics in Football isn’t new. Player and team stats were collected and analyzed during that first Super Bowl game in LA. But the big data and data visualization revolution is shaking things up as usual. The past couple years have seen a vast improvement in data collection techniques and abilities across industries and sports. American Football is not different. A little late to the game compared to Moneyball inspired baseball, over the last few years the NFL has released the power of big data.
Football And The Internet of Things
The Internet of Things is bringing big changes to american football as well. In 2014 the NFL partnered with Zebra Technologies to place RFID chip in the left and right shoulder pads of the NFL players. Each stadium then has 20 radio receivers which are strategically installed in the lower and upper levels of the stadiums to pick up player frequencies and collect the data.
The patented RFID player-tracking technology system, The Zebra Sports Solution, provides real-time metrics on players’ speed, acceleration, deceleration, distance traveled and alignment, which is part of the NFL’s “Next Gen Stats.” Additionally, the data captures where players are on the gridiron, their direction and how their speed or acceleration impacts their on-field performance.
In the partnership’s first year, 17 stadiums installed the technology. Now as the partnership rolls into its third season all 31 stadiums are on board. The NFL will now offer each team the data generated by the Zebra Sports Solution in order to better evaluate athlete performance, as it sees the vast potential of big data in American football. In a 2016 press release Vishal Shah, NFL’s Vice President of Digital Media stated: “we are excited for the 2016 season and for the tracking technology to help teams evolve training, scouting and evaluation through increased knowledge of player performance as well as to provide ways for our teams and partners to enhance the fan experience.”
Michael King, Zebra’s director of sports products, asserted: “Football is more of a chess match. This technology is huge for that.” For football coaches and staff that spend hundreds of hours pouring over stats and tape, powerful analytics run on big data can help save time and power effective decision making. Zebra is also providing data visualization to help drive insights. But all this data isn’t just for NFL staff. The NFL sees a possible business in the data as well. “The best fans are the most engaged fans,” King said before shifting to the potential financial windfall. “They will pay for subscription plans to get this data.” Fan engagement is already starting. Microsoft Xbox One can access the collected data through NFL’s Next Gen Stats features.
Data tracking doesn’t stop with the players. Zebra has partnered with Wilson Sporting Goods to install RFID sensors in the footballs as well. These sensors enabled footballs were used in the 2016 preseason. As of now, the sensors do not measure pressure (cf. Deflategate), but the the data would be used for research that could spark significant changes in officiating, kicking and other areas as soon as the 2017 season.
Protecting The Players With Big Data
It is no secret that the safety of the game can be improved, specifically by preventing, diagnosing and treating head injuries. In this vein 20 college football programs have installed helmet sensors to monitor concussions and collect data. As usual with the NFL and concussions there is controversy and as of now helmet sensors won’t be used to monitor concussions. But as the technology improves and the landscape changes there is hope that big data will be used to protect NFL players when it comes to head injuries.
Luckily data is already helping with other injuries. Darryl Lewis, Chief Technology Officer at optical tracking systems company STATS LLC was at Microsoft running the Xbox game division when the company’s software noted a slight movement bobble with an NBA player during a motion-capture session. “We noticed he was favoring his left side and pointed it out, and when he got checked out by a doctor they noticed a very slight hairline fracture in a foot bone,” says Lewis. Had the injury gone unchecked, it might have become much more complicated and career impacting.
Real-Time Data On The Sidelines
Microsoft and NFL partnered in 2013 to make the Microsoft Surface the official tablet of the NFL. It has been a bit of a PR nightmare. After various connectivity issues New England Patriots coach Bill Belichick Microsoft Surfaces has declared he is done with the technology. That said the tablets allow coaches to demonstrate and review plays on the sidelines, as well as access real-time data from the NFL’s databanks. If some of the sideline technology could be fine-tuned the access to big data could positively impact the game.
Gaming, Big Data, And Football
Injury prevention isn’t the only real life intersection of the gaming world and an actual football game. The football video game “Madden NFL” uses more than 60 data points on each individual player to power its game simulations, including information about injuries. At the end of the regular season, the engineers input the new data about the competing teams and run a final simulation. All this data led to Madden NFL correctly predicting 2015’s Super Bowl XLIX. It predicted the New England Patriots would beat the Seattle Seahawks 28-24 and that Patriots quarterback Tom Brady would throw four touchdown passes and be chosen the game's most valuable player. And that the game-winning touchdown catch would be made by Julian Edelman. The game has correctly predicted the winner in 9 out of the last 12 Super Bowls. And it is getting better. As its data increases, its accuracy will as well.
Predictive Analytics And Football
Madden NFL isn’t the only software tapping into big data to predict NFL game outcomes. Prediction Machine was created by Varick Media Management to predict how a game will end. As its data increases so does its insights, and is currently boasting a 48-20 (70.6%) ATS in the NFL postseason all-time. Then there is the tech startup Unanimous A.I. with their swarm artificial intelligence platform known as UNU. UNU correctly predicted the entire outcome of the last Kentucky Derby, down to each horse. However, for some of the swarm real-time questions asked over the past few months, UNU predicted the Green Bay Packers would take home this year’s Super Bowl trophy. Unfortunately for the Packers, as we know that is not going to happen since the two finalists for this LI edition are the New England Patriots and the Atlanta Falcons.
In spite of few mistakes and rare errors, all of this data stays on course. Big Data also helps to fuel predictions in the $70 billion dollar fantasy football industry.
One Decade of Super Bowl
Let us have a closer look now to the various statistics we can gather around that annual monumental event and how some of its data evolved over time. All charts are created with datapine's data visualization software.
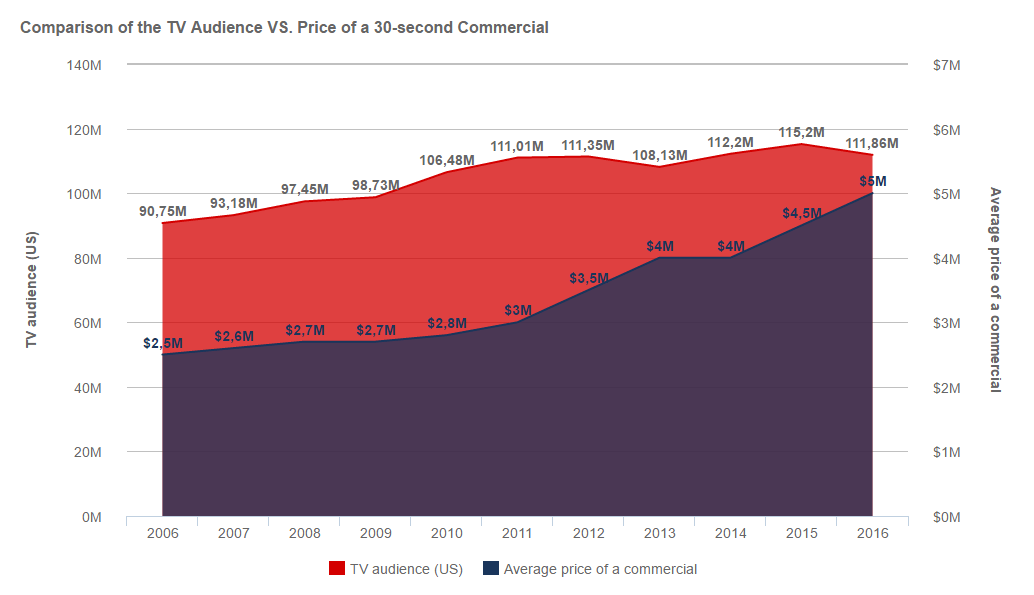
TV audience VS. price of a commercial
The number of americans turning on their TV rose by 20% over the past eleven years, to reach almost 112 millions viewers for the last edition. In comparison, the price of a commercial doubled, going from $2,5 millions to $5 millions for 30 seconds of the audience's attention (click to enlarge the charts).
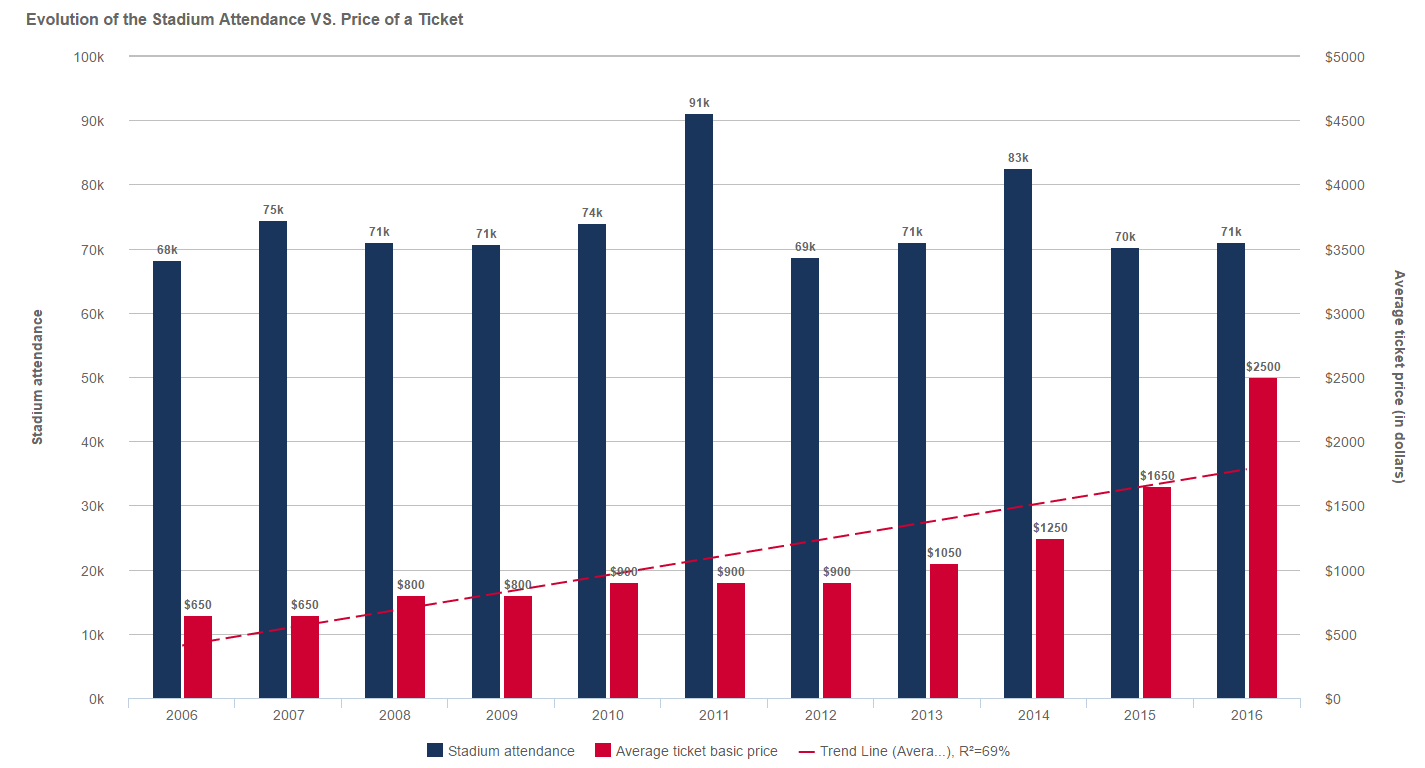
Stadium attendance VS. price of a ticket
The stadium attendance is annually stable, since most of the football stadiums accross the US has a similar size and is every year full-packed. The only slight difference occurred in 2011 when Dallas's Jerry Jones wanted to break the attendance record but fell short by almost nothing. The tickets price however, have been multiplied by 4 in only 10 years!
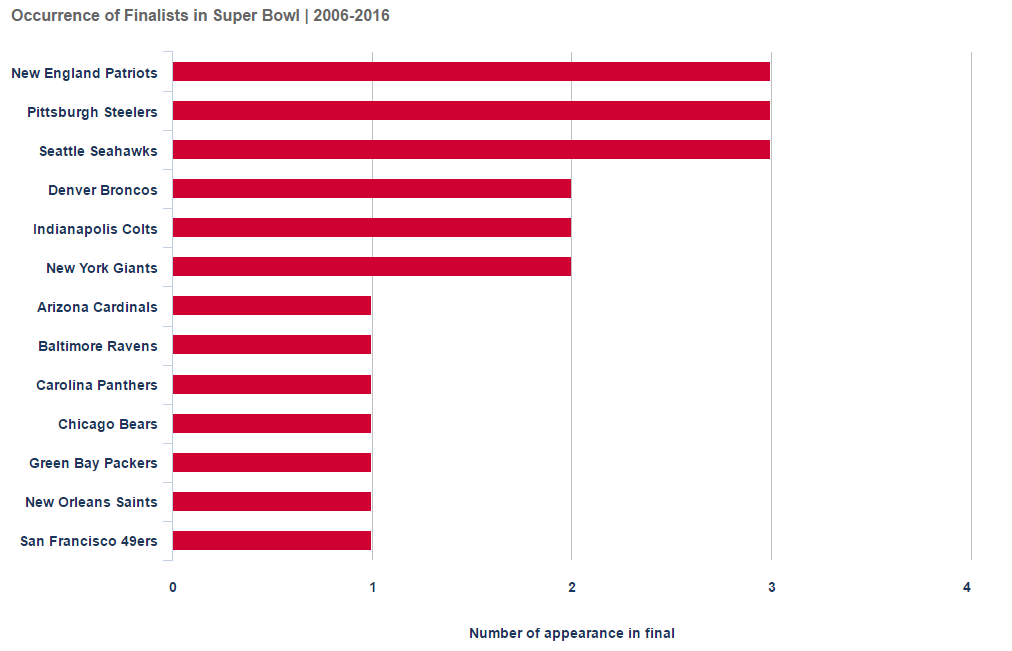
Finalists of the Super Bowl
Three teams appeared three times since 2006, three others twice while the seven left only once.
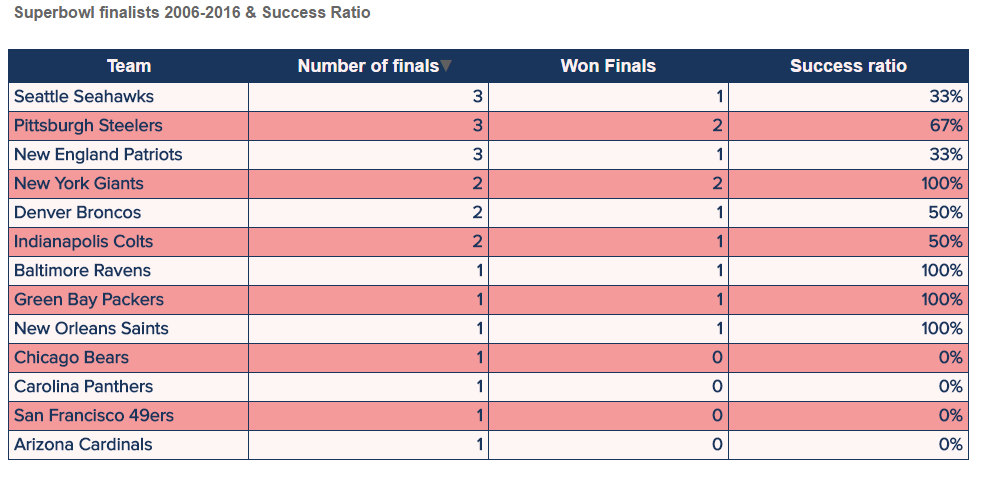
Super Bowl winners
To nuance a bit the previous chart, the following table provides the success rate of each team who managed to make it to the final. The best success rate since 2006 goes to the New York Giants, who won the two finals they played.
Big Data and American Football
On Sunday February 5 in Houston, Texas the National Football League (NFL) season reaches its pinnacle: Superbowl LI. Over 100 million people will tune in over greasy food and maybe a beer or two to watch the best team in the National Football Conference (NFC) and the best in the American Football Conference (AFC) face off for fame, glory, and a lot of money. Or they may be tuning in to watch Lady Gaga perform or see which 5-million-dollar commercial is the best this year. Either way at the same time real-time and historical data will be driving every aspect of the football game, advertisements, predictions and gambling. It’s official, the era of big data and American football is here.