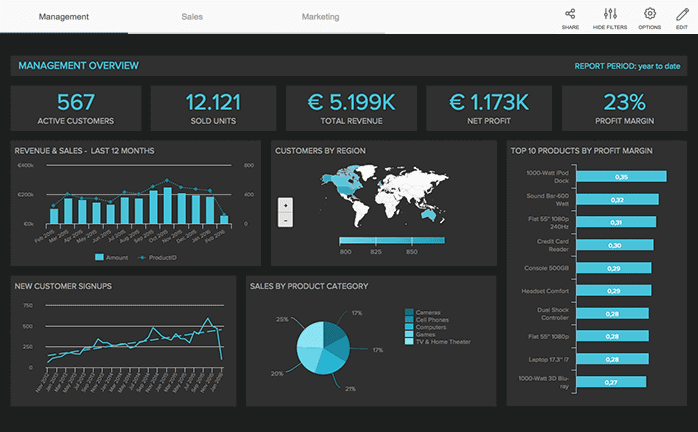
BI DASHBOARD TOOLS - EASILY VISUALIZE YOUR DATA WITH STUNNING DASHBOARDS
- Build meaningful tables and charts without any SQL skills
- Access your interactive dashboards from any device, at any time
- Share your insights among your business or with external parties
DATAPINE – A SMART BUSINESS INTELLIGENCE DASHBOARD SOFTWARE
Make faster decisions with BI dashboard tools
BI dashboard software is a term used to describe the visualization of methodologies and technologies to collect, analyze, present, and efficiently share data. BI dashboard tools help businesses to gain new actionable insights to improve their performance.
We live in a digital age where knowledge is power, and data is the new oil. Accessing that data, sharing, and generating fast insights has become one of the most important motor engines of any business that thrives to survive in this competitive market. IT departments no longer hold exclusive access to data, and with BI dashboard tools, the knowledge is spread across the company, empowering every business user to create their own interactive reports utilizing data visualization and spreading the knowledge with internal and external stakeholders. This is where a dashboard software creates the most out of any business, and here we will explain how in more detail.
Fast data analysis: In our cutthroat information age, speed is crucial. Gathering information, analyzing, processing, and evaluating are laborious tasks that take the time, resources, and energy of each stakeholder involved. Often, those in charge of decision-making don’t have time to conduct large research or substantial industry development projects. Small businesses don’t have the capacity to analyze so much data without losing invaluable information which can differentiate them from the competition and provide building blocks for increasing revenue. That’s where the speed of BI reporting tools comes in: by enabling business users to generate their own reports, it is no longer necessary to wait days, or even weeks, to obtain an answer for specific business-related questions.
Competitive advantage: With increased competition, tighter budgets, and bigger expectations, businesses large and small need a reliable, intuitive, and accessible business intelligence dashboard to achieve successful analysis and decision-making. In industries that grow bigger and profit margins get smaller, where resources are stretched further than ever and unprecedented volumes of data are collected, it is crucial that decision-makers, management, and stakeholders can access, analyze, and interpret every facet of their business and its performance on-demand. A responsive business intelligence dashboard software handles these demands with panache, combining a supremely user-friendly interface and impeccable performance with cutting-edge business intelligence resources that will take your business one step further from its competitors by leveraging the power of data analysis.
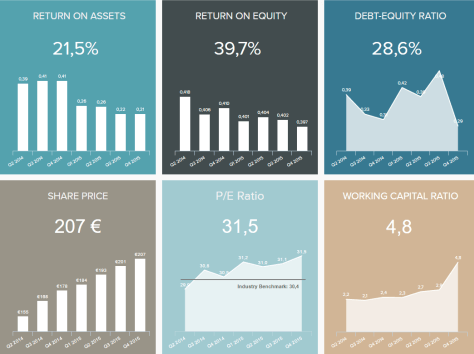
Data visualization: As more data sources emerge, there is a strong need to compile a centralized point of access where data can be presented in a clean way, with instant insight. Traditional spreadsheets have become so crammed that making a business decision can end up in indefinite scrolling and searching for the right information. Since humans process visual data much faster than written, graphics are becoming the business standard for presenting information with professional business intelligence dashboard tools. And not just ordinary graphs and charts, but interactive, visualizing every information a business possesses, predicting outcomes, and providing business users with instant, actionable insights. There are many business dashboard examples that do just that offer a wide range of possibilities to empower small business owners and enterprises alike.
Performance management: Tracking progress and performance of business goals requires moment-to-moment access to data, and if that data is disorganized, spread across multiple sources, and spreadsheets, tracking down and organizing could affect the decision-making time for gaining valuable business information, as mentioned. If the performance management is carried out during real-time tracking by choosing the right KPI templates, whether is a sales goal such as sales cycle length, or retail order overview, the overall performance becomes much more effective, and the business mechanisms increasingly productive. This allows business owners, managers, and employees to sustainably develop their functions while spotting problems immediately and, thus, giving the advantage of acting promptly and efficiently.
Customers’ behavior analysis: Customers are the beating heart of every organization and business, be it a big enterprise or small local store. Therefore, knowing your customers is a crucial part of every considerable business success and sustainable development. Understanding their behavior, utilizing all the data available to focus on their interactions with your business creates a powerful mechanism to predict outcomes and adjust the business strategy accordingly. A clear roadmap to customers’ intentions and new selling opportunities will emerge, providing fresh revenue and increased customer satisfaction, attuned to every niche and nuance of business operations.
That being said, online BI tools are becoming the business standard to collect data, analyze and provide real-time insights. Sitting on a meeting with a PowerPoint presentation, or searching for the right answer through never-ending spreadsheets no longer requires so much time or effort. With the power of artificial intelligence and intelligent data alarms, the possibility to integrate all your different data sources, and utilization of online data analysis, a working environment free of clutter and data right at your fingertips create the most powerful business strategy that improves efficiency and reduces costs.


Become a data wizard in less than 1 hour!


Utilize the benefits of modern business intelligence dashboard software
Dashboard tools in BI are cutting-edge solutions that fuse the essential aspects of traditional business intelligence with its signature commitment to the user experience. Gone is pre-requisite SQL knowledge, absent are the myriad complex equations and language that make sense to only the most experienced and qualified IT specialists. In its place, a business intelligence dashboard designed for use from the ground up is robust, accessible enough for an intern with no prior training, powerful enough for a CEO with years of frontline experience under their belt.
Centralized access to data: As mentioned, one of the prime benefits of investing in a business intelligence dashboard software is the fact that it provides a centralized point of access for all your data sources. Our professional data connectors allow you to connect all your most relevant internal and external data sources from MySQL, Oracle, Amazon, CRM systems, third-party data providers, to simple flat files with just a few clicks. Once your sources are connected you are all set to start creating stunning dashboards thanks to an intuitive drag-and-drop interface.
Access to real-time data: To take advantage of your competition, it is also important to have accurate data in planning, analysis, and reporting. For this purpose, is that our BI dashboard tool provides you with real-time data, so you can generate instant insights on how your business performs on an operational or strategic level. Like this, you no longer need to go through the pains of manually updating your data sources as the tool will automatically display the new data as soon as it is available. If all employees are informed at the right time and the right moment, guesswork is completely eliminated, thus creating substance for making informed decisions.
Generate predictions: Thanks to advanced technologies such as predictive analytics, a BI dashboard tool studies your current and historical data to find relationships, trends, and patterns to generate predictions about your future performance. This way, you can stay one step ahead of your data at all times and plan your strategies, resources, and budgets based on accurate outcomes.
Automated reports: With datapine’s professional dashboard business intelligence software performing online data analysis has never been easier. Save countless hours on manual reporting while significantly mitigating the risk of human errors since the tool will auto-generate reports and send them to specific recipients on a pre-defined time.
Customize your dashboards: A white-labeling feature allows you to customize your dashboards according to your business color scheme, font, and logo for an extra professional look. Choose from 25+ charts and graphs options to tell your data story in the most efficient and accessible way and benefit from advanced charting options to take your data one step further and successfully deliver the data message you want to convey.
24/7 access: Thanks to the SaaS environment of these business intelligence solutions, you can access your data from anywhere on any device that has an internet connection. Rather you want to display your dashboards in an external meeting or want to access your data on your phone while being outside of the office, you just need to log into your datapine account, and you will immediately have full access to all your data.
Secure your data: Sharing your reports in a secure way is a guarantee you get from BI dashboard software. Your online dashboards can be shared via a password-protected URL and you can define viewing and editing rights to specific recipients so that they will only see or manipulate the data you want them to have. Additionally, dashboards can be exported and shared in several formats (pdf, png, xls, or csv).
Why our BI dashboard software is special?
Where some traditional business intelligence tools can only be fully utilized in the hands of the IT department, our BI dashboarding software is transformative. Where other solutions require IT input, datapine’s utterly seamless tool empowers each department and department head to access the data they need, when they need it.
Freeing teams from IT bottlenecks, our SQL report builder requires no SQL knowledge. Built around an easy-to-use drag-and-drop interface, users can simply select the report elements they require and then leave the complex equations to our tool.
datapine’s BI dashboard software has been developed and refined with the help of SMEs from around the globe. Its function is based on real-life needs and wants, which means it understands the complex and myriad requirements of business function from the operational to the strategic, managerial to marketing, and offers support accordingly. It’s this real-world application that gives rise to datapine’s signature ease of use from innovative data visualizations through to advanced data analysis tasks that were once complex are now as easy and pointing and clicking a mouse. And not just that, our team can create a POC to show you the power of customized dashboards with your own data and KPIs.
Databases can be integrated within minutes and with no software to download, any employee, in any location can begin to utilize dynamic real-time business intelligence dashboards, automated reporting, and data visualization instantly, including mobile, on-the-go solutions. With no prior training required, the barriers to wielding business analysis tools requirements such as formal IT training and previous BI experience disappear. This ease of access means reports can be created and generated on-demand, allowing every business unit to respond to day-to-day and even hour-to-hour changes; workflows become more efficient, communication is improved, decisions are more informed.
With personal access, a cloud-based structure that guarantees 24/7 access from any location and enterprise-level security layers, see what datapine’s BI dashboard software can do for your business with a free 14-day trial.


We were amazed how easy it was to use datapine and get the first KPIs within a couple of minutes. datapine is definitively a game changer for us as now all decision makers have quick, easy access to ad hoc analysis, KPI dashboards and reports.Sebastian Diemer, Founder at KreditechGO TO PRODUCT OVERVIEW
Become a data wizard in less than 1 hour!