
HR Analytics Guide How do you take advantage of modern HR analytics solutions?
LEARN ABOUT THE BENEFITS OF HR ANALYTICS
Table of Content
1) What Is HR Analytics?
2) How Is HR Analytics Important To An Organization?
3) HR Analytics Examples Through Different Applications
4) How To Get Started With HR Data Analytics
5) Challenges Of HR Analytics To Overcome
6) Conclusion & Key Takeaways
In recent years, the human resources department has undergone immense changes. Traditionally, HR has been one of the most human-centric parts of a company, and it's been hard for professionals to clearly quantify and measure success as in the sales department, for example. HR business analytics has changed that perspective and introduced a data-driven approach to managers, VPs, and HR professionals that focus on modern people management processes in order to create a sustainable business development through interactive HR KPIs. By calculating hiring costs, identifying patterns in employee turnover, discovering educational opportunities to improve employees’ performance, and answering many more data-enabled questions, professionals can improve their results and deliver critical insights and, consequently, reduce HR-related costs.
That said, in this article we will explore the main pillars of HR by answering what is people analytics, explaining why adopt HR analytics within your organization and provide a list of the most prominent benefits. Afterwards, we will give you details and real-world talent management, employee performance, and workforce analytics examples in order to paint a full picture of HR. Finally, our conclusion and key takeaways will enable you to generate ideas on the next steps and your own HR improvement. Without further ado, let’s get started.
1) What Is HR Analytics?
HR analytics is a data-driven process used by the human resources (HR) department to optimize workforce management. By collecting and analyzing critical HR data, companies can generate actionable insights and improve workforce, people, and talent management performance.
Oftentimes, terms such as people analytics, HR, and workforce analytics are used interchangeably, but we will set a clear differentiation based on different application possibilities. At this point we will elaborate more in our section where we explain real business scenarios, opportunities, and various types of data collected by HR. For now, we will briefly define each.
What is people analytics?
People analytics, also known as talent analytics, allows HR managers to make informed data-based decisions about their talent management processes. It can include data about performance and productivity as well as other aspects such as work life balance and well-being.
Organizations use it to make strategic, and better talent decisions, including monitoring employee satisfaction, rating systems, enrollment stats, etc. by using modern technologies and tools such as professional HR analytics software.
What is workforce analytics?
Workforce analytics is not focused on HR department activities such as recruiting or retention, but on worker-related processes that might or might not involve people. This includes areas such as internal mobility, part-time employees, gender ratio, automation, etc.
The differences between the 3 terms can be seen also through our selection of HR dashboards that provide details about each but we will go through examples also later in this article.
Now that we have defined these terms, we will focus on how analytics transforms HR and the boosting benefits that organizations can reap when using data to make faster and effective decisions.
2) Why and How is HR Analytics important?
The importance of HR analytics starts with data. As with any analytical process, it can become complex but, as mentioned, modern tools and software certainly help and ease the process so that professionals can focus on what truly matters: the human aspect of HR. Here we take a look at the most noticeable benefits of HR analytics:
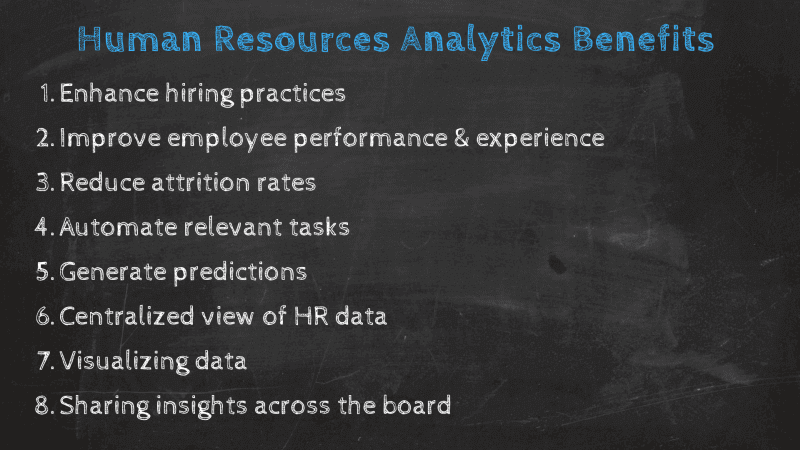
1. Enhancing hiring practices: Searching and employing the right candidate/s can be a tough job but improving this process can be done with the help of human resource analytics. You can simply collect data from previous hiring sessions and take these insights for future ones. This will help you determine how successful your company is at acquiring “ideal” employees with the help of monitoring metrics such as time to fill, costs in the hiring process, etc. Additionally, you can identify if candidates would be the right fit for the company by comparing features from their profiles. If, for example, 6 out of 10 candidates show features that are not a cultural fit, you can easily use this knowledge to save time and focus on other potential employees in your talent pool.
2. Improving employee experience and performance: Creating a better working environment, ensuring employees have the right resources to perform their job in the most productive way, offering flexible schedules and work-life balance can be identified with the help of human resources analytics. By analyzing metrics such as the absenteeism rate, overtime hours, training costs, and employee productivity, companies have the chance to improve the overall employee experience, stimulate productivity, and, ultimately, reduce business costs. By keeping workers engaged, satisfied, and encouraging the feeling of belonging, organizations can profit from it, create better working environment, and improve the company’s culture. Even in the hiring process, if you can save time and become more swift, future potential hires will appreciate this since they don’t have to wait for weeks or months to know whether they’re hired. Ultimately, it will increase the value of your brand image and give you a competitive advantage.
3. Reduce Attrition: Expanding on the point above, using HR data analytics to keep your employees satisfied can also significantly reduce your attrition rates. Employee retention is becoming harder every day, especially due to the fact that younger generations are inclined to switch jobs more regularly. By using human resources data to your advantage, you can take a deeper look into common attrition reasons and find appropriate solutions to lower these numbers. By looking into individual employee performance, you can also ensure you keep them happy and encourage them to stay in the company. For instance, by providing opportunities to grow or deepen some skills with training instances such as courses or workshops.
4. Automating tasks: With so much data at hand, it’s of utmost importance to automate as much as possible and focus on more human-centric tasks. With the help of modern technology, even HR departments have started to optimize their repetitive undertakings and eliminating workload that was done manually. You can see a practical example in the reporting processes. Traditionally, it was done by combining multiple spreadsheets, PowerPoint presentations, and text files but, in recent years, the development of modern, interactive HR reports has enabled automation through scheduling a time period where an up-to-date report will be sent to the desired recipients. This ensures that HR professionals don’t deal with manual calculations or exporting multiple files. On the contrary, the information is updated automatically and the only task that HR professionals need to optimize is the report schedule. Automation is a huge benefit and HR departments and organizations should adopt it as soon as possible in order to save countless working hours.
5. Generate predictions: In the last years, predictive technologies have become a critical element when it comes to extracting the maximum potential out of your analysis efforts, and the HR department is no exception. In a standard way, predictive methods use historical and current data to identify patterns and generate accurate forecasts about future developments. In HR, it can be used to forecast the performance of critical processes related to employee management. For example, by using this technology you can predict when a worker is likely to quit and step in with preventive measures to avoid losing time and productivity.
6. Centralized view of HR data: Another great benefit is the possibility to get a centralized view of all your HR performance. Traditional means of analysis required a lot of manual work, making the decision-making process less accurate and efficient. With modern tools, you can visualize all your relevant human resources information in one unique location thanks to modern technologies such as data connectors. Like this, you get a centralized view of all relevant areas of your HR department and are able to stay ahead of any new developments. All this without the need to perform heavy manual work or use various static reports.
7. Visualizing data: There is no longer a need for countless spreadsheets, numbers, rows, columns, and manual calculations. Most HR professionals do their work because of the human aspect of the industry, and they don’t want to focus on pure numbers. Thanks to data visualization, each variable in human resources analysis can be easily visualized and interacted with. A well-oiled HR department will focus on the data itself, asking additional questions as they arise and, at the same time, have clear visuals through powerful charts and graphs that will enable them to build a data story, uncover hidden patterns, and, consequently, help the company move forward. Moreover, online data visualization ensures access from anywhere, at any time, enabling professionals to access their data on-the-go.
8. Sharing insights across the board: While the usual latest information or insights sharing through regular exchange and direct communication offer immense value in an industry such as HR, sharing your insights digitally has never been so easy. With the introduction of automated reports (see the point above), embedding, sharing a simple URL that gives you access to the report or dashboard or assigning external viewers that will have access to the selected areas has enabled professionals to enhance their communication with real-time data, easily sharable across devices (mobile, tablet, desktop computer or laptop). Searching for the right information at the right time can be easily optimized by sharing visual examples and directly answering questions with the help of modern visualizations.
We have defined what is HR analytics and what is its importance, and now we will present to you 6 modern HR dashboard examples that illustrate the value of the benefits we have mentioned so far.
3) Professional HR Analytics Examples & Templates
Data analytics for HR doesn’t need to be hard. With the help of modern software and tools, every person in the industry can generate invaluable insights no matter the level of analytical or technical knowledge. With these examples, we will demonstrate how and start with people analytics that focuses on talent management.
1. People analytics example for talent management processes
People or talent analytics have gone through extreme changes, especially in industries such as tech where attracting and, more importantly, keeping the right employees has become extremely challenging. As HR professionals are at the forefront of these changes, tracking talent management processes through different data points and consolidating numbers to generate proper insights has become an indispensable tool and skill in the HR realm. It can become quite expensive for companies if they start to lose high-performing employees and experience high turnover rates or lower satisfaction levels. That’s why a comprehensive dashboard can ease the process and act as a data assistant that will enable you to keep a close eye on your talent management efforts.

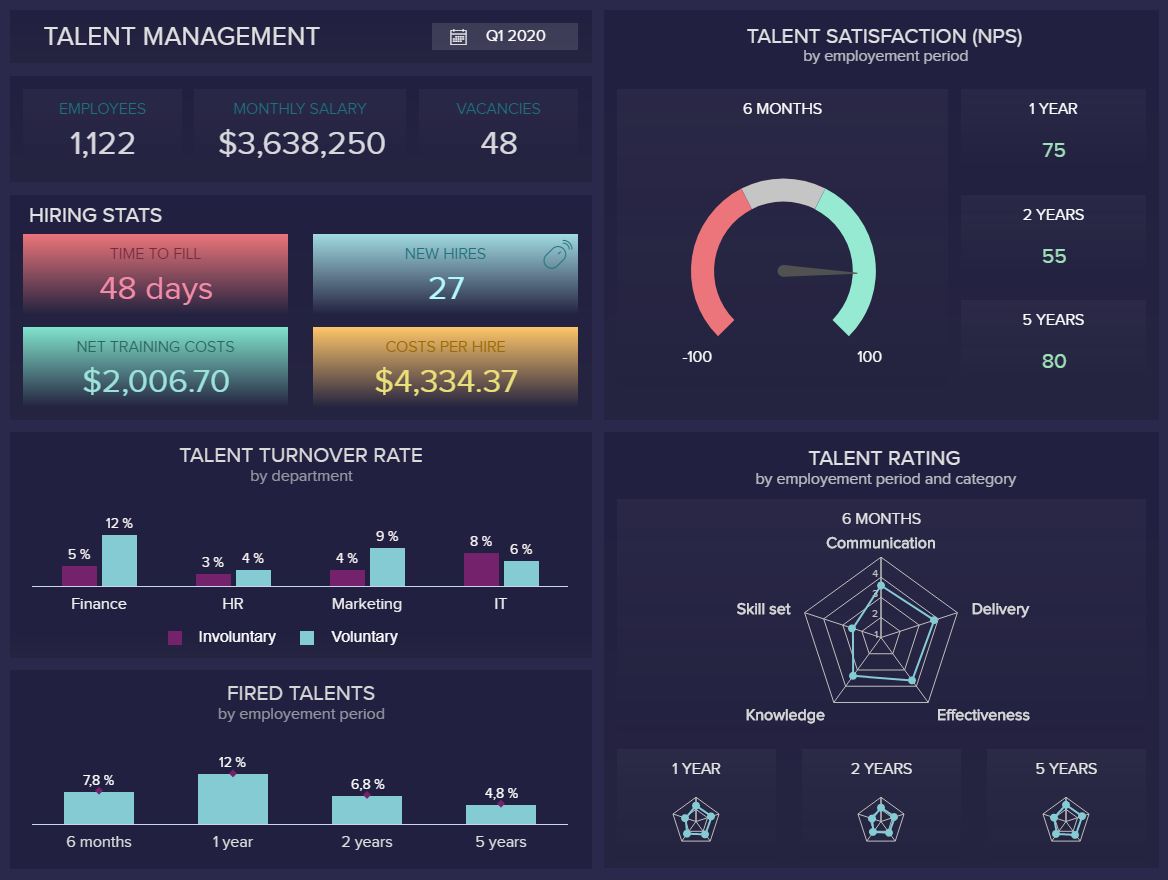
This human resource analysis was created with datapine’s professional dashboard software that enabled us to simply drag-and-drop values into the Analyzer area and choose the desired chart. In talent management, it’s important to track metrics such as talent turnover rate, dismissed employees, satisfaction levels, and rating. That way we can paint a complete picture of talent management stats and conduct necessary actions. In this example, we can see that the voluntary turnover rate is the highest in the finance department while the involuntary in the IT, therefore, every HR professional can easily start asking questions and examine why. Moreover, the talent satisfaction level needs to be high as possible so if you see any negative changes, act as soon as possible in order to avoid higher turnover rates.
2. Workforce analytics example for the overall company performance
Workforce analytics is another critical part of every successful HR department. Having a clear overview of the overall workforce of an entire company can be beneficial both for HR managers or professionals and c-level executives that need to deliver strategic value into their planning and HR efforts in order to ensure a healthy working environment, save time, and costs. These notions we have depicted in our dashboard example below.
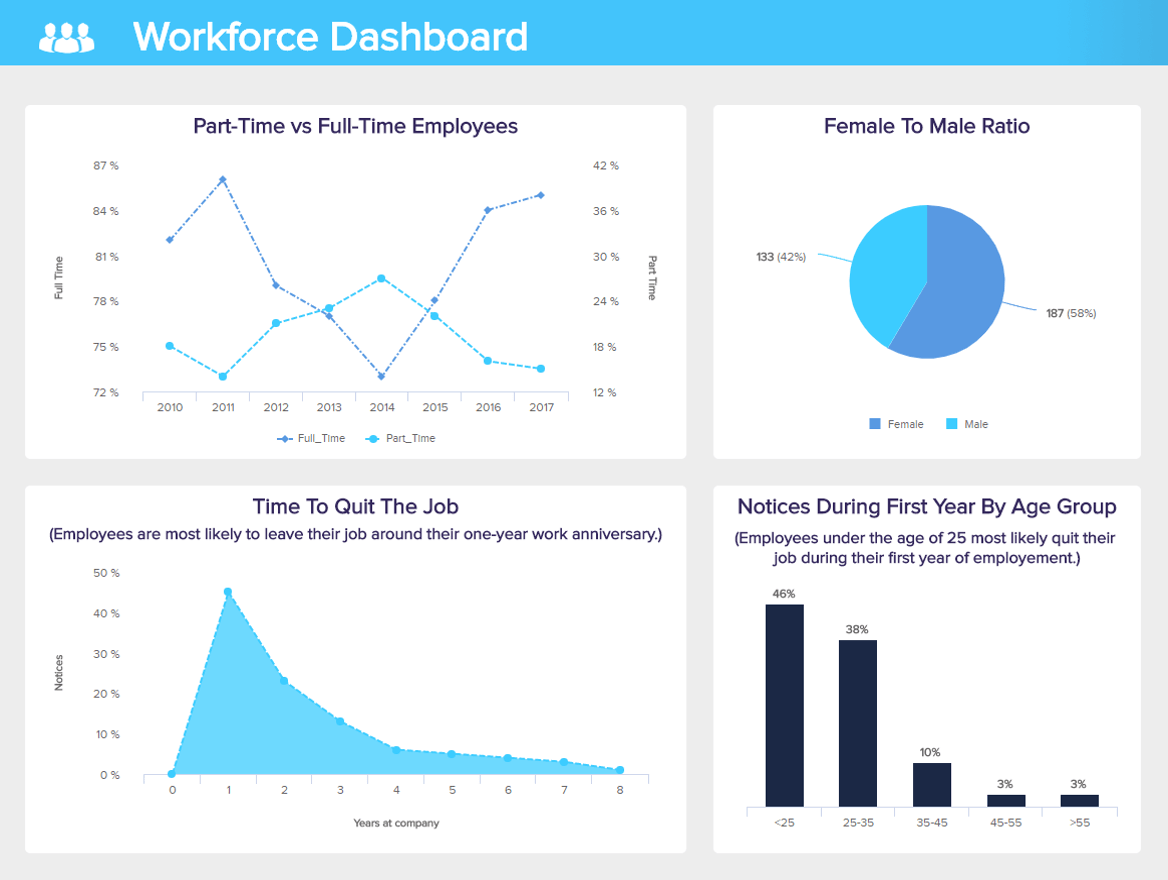
Seeing the main workforce stats can tell us generally where our employees stand in the whole organization. Tracking part-time and full-time employees may explain changes in employees’ costs as having more part-time employees in comparison to full-time can indicate financial difficulties, for example. The gender ratio will tell us if we hire all genders and if we see a rise in one or the other, it’s time to look for a more balanced approach when enrolling new candidates. We can also immediately spot how employees are most likely to leave their job after the first year of employment. The final part will tell us that employees under the age of 25 are most likely to leave, which is not surprising in today’s fast economy where it’s quite challenging to attract the right talent, but keeping it seems even harder. This dashboard showed us how HR metrics and workforce analytics support our findings of the company’s general workforce profile.
3. Employee analytics for performance monitoring
Tracking employees’ performance and analyzing their effectiveness will tell you if they’re motivated, under pressure, or need additional training to perform better, for example. Collecting relevant facts on employees’ performance is extremely important in HR. While comparing employees with each other has its roots in traditional HR performance monitoring, a general overview should be focused on the bigger picture as the performance changes over time and it depends on various factors. Our example shows an analytical approach to the overall performance of employees.
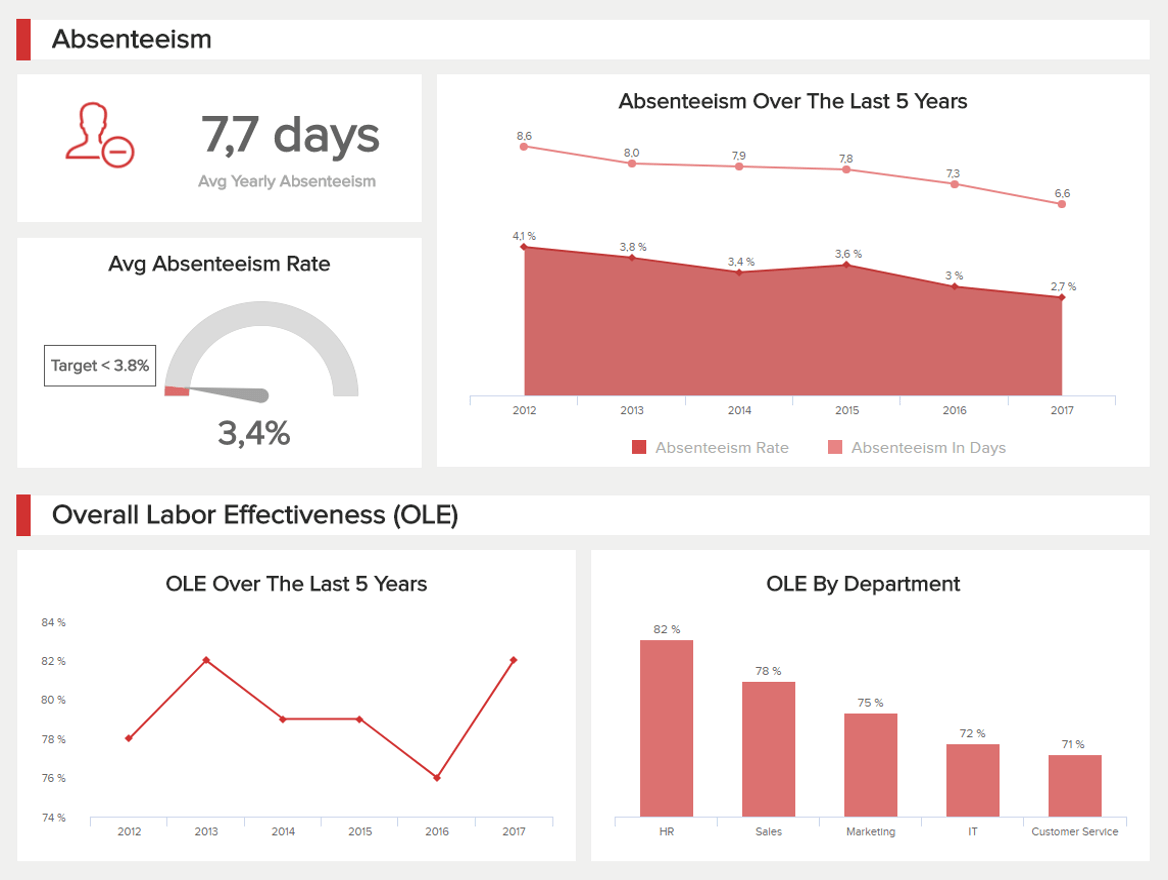
We can see, on the top of the dashboard, that the absenteeism dominates the visual, and it’s split into 3 main parts: the average yearly rate, a simple gauge chart that shows how well employees have performed against the target and the development over the past 5 years. Absenteeism is important to track as it shows you if employees have the tendency to call in sick or skip workdays. If the rate increases, then you should examine details and start asking questions. Is it because they have issues in motivation, have been overworked, stressed, under immense pressure, etc.? In the end, if employees start avoiding work, something is not working properly in the company and this can cause serious financial damages. The lower part is focused on the overall labor effectiveness (OLE) which basically tells you the productivity levels of employees. According to the specific criteria that you define, you can track if workers achieve desired targets or need additional help. In our example, we can see that the customer service department has the lowest effectiveness, which means that this department needs more attention to find out why.
4. Recruitment tracking for optimizing the recruiting funnel
Every step of the recruiting process can be tracked thanks to modern HR data analytics solutions. It’s one of the critical components in HR since employing the right candidates is becoming more challenging. Competition is fierce and companies need to keep up in order to attract and offer better working conditions in comparison to the competition. HR professionals, in this case, have a demanding task, and proper data management in HR can help immensely. Evaluating the recruitment funnel will ensure your hiring process evolves into the best possible you can offer on the market. We will go into details with the help of our dashboard example below.
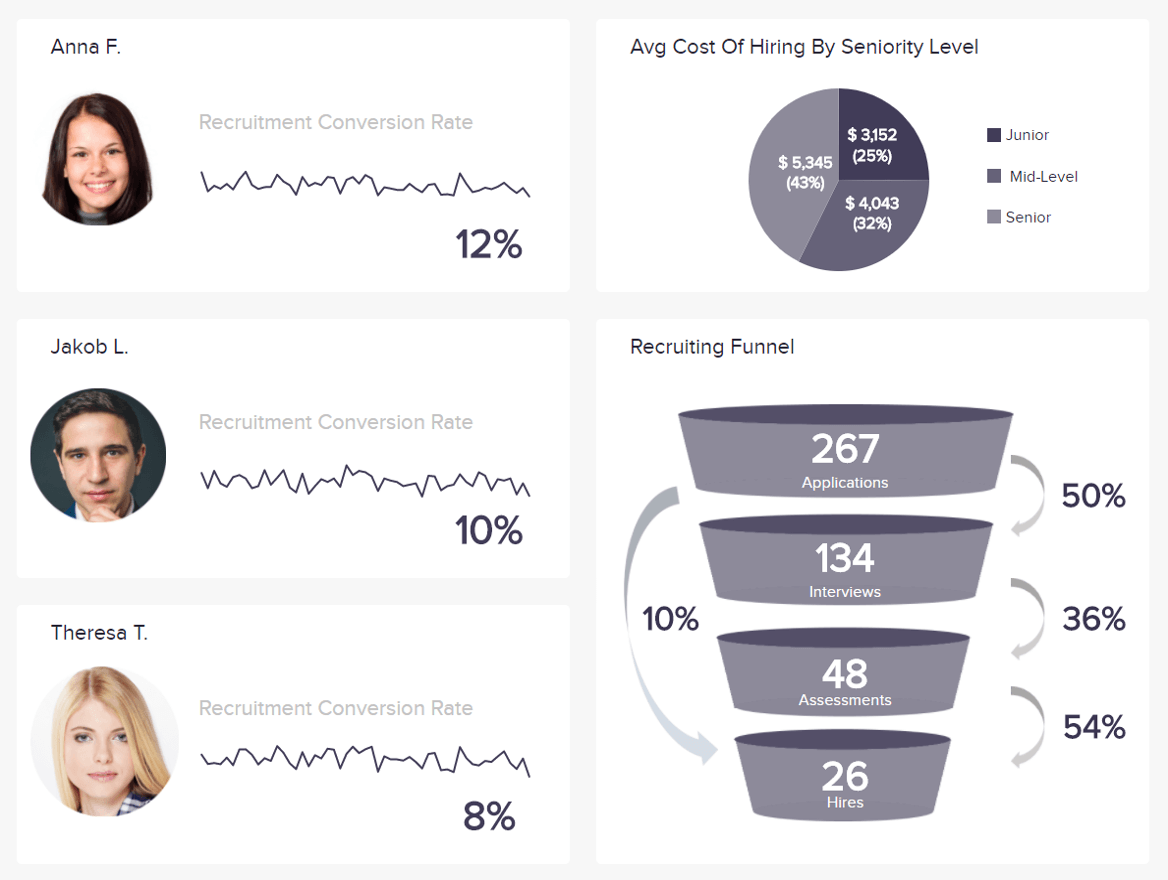
This straightforward dashboard expounds on HR analytics metrics critical for monitoring and analyzing the recruitment performance. The goal is to optimize the recruitment process by evaluating the efficiency of your enrollment processes and the recruiting funnel to get an overview of how many applicants you receive and, finally, how many of those candidates actually get hired. It would make sense to compare your data with other metrics such as the turnover rate in order to get a broader picture of how well your company retains (keeps) the best candidates. We can see in our example that Theresa has the lowest conversion rate but that doesn’t mean she doesn’t perform well. Maybe she hires fewer candidates but the costs of hires and the turnover rate are the lowest. That’s why it’s important to examine different touchpoints in order to generate quality insights.
5. Employee satisfaction and churn analytics for improving a candidate’s experiences
As mentioned, attracting and keeping the right candidates is a challenging task for any HR professional or manager. High churn rates and low satisfaction levels of employees clearly indicate that the company is not doing well in its general and departmental management but also risks financial bottlenecks that could cause serious damages. Uncompetitive salaries, unnecessary micromanagement, lack of recognition, being overworked, are just some of the reasons that can cause issues within the organization. That’s why it’s important to keep a close eye on the satisfaction levels and avoid unnecessary churn in order to keep the company stable and healthy.
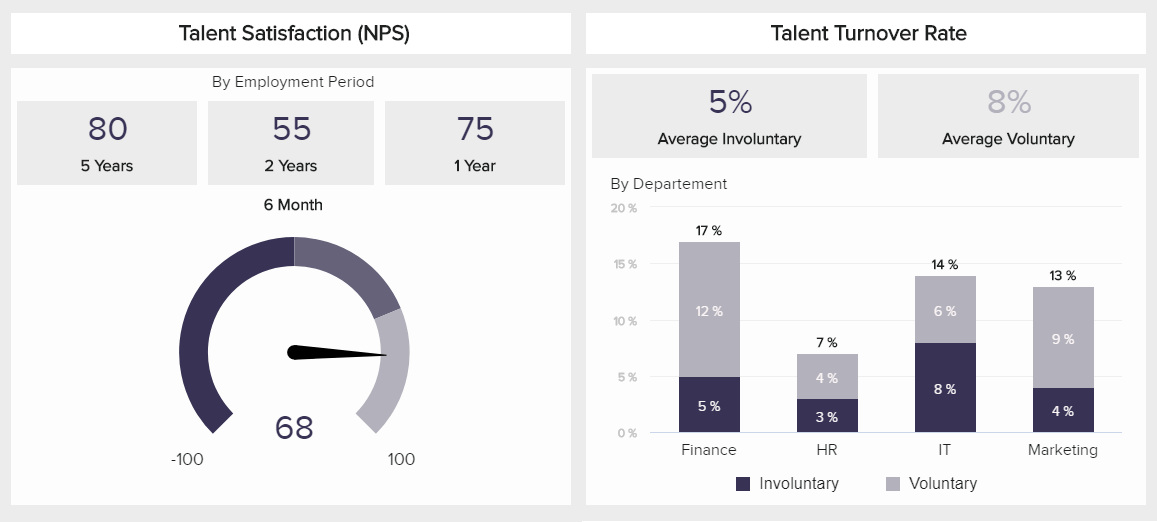
To put things into perspective, our examples above focus on talent satisfaction through the net promoter score and turnover rate, sometimes referred to as churn. By introducing data analytics in HR, companies can now derive insights that were hidden and create a working environment that will feed this information into positive developments. In our example above, you can see that the satisfaction levels are expressed positively and the highest is achieved after 5 years of employment. Here you can brainstorm ideas on how to increase those levels so that candidates experience more positive working days and increase their motivation. On the other hand, the talent turnover rate can tell you which employees or departments have difficulties in retaining employees so you don’t have to rely on “hunches,” but examine the causes based on unbiased information.
6. Diversity dashboard to ensure an inclusive and varied workforce
Diversity in workspaces has become a norm in the modern business context. Ensuring the company has employees from varying backgrounds, ethnicities, gender, abilities, and skills can contribute to workforce retention as well as overall productivity. And not just that, by bringing together a group of people with different experiences or cultures, the creative process becomes much more effective and the company more able to resonate with the needs of an increasingly diverse world of customers. Paired to all of this, ensuring a varied workforce also helps organizations stay compliant with discrimination legislation. Our next example covers all the aforementioned points with relevant diversity metrics. Let’s see it more in detail!
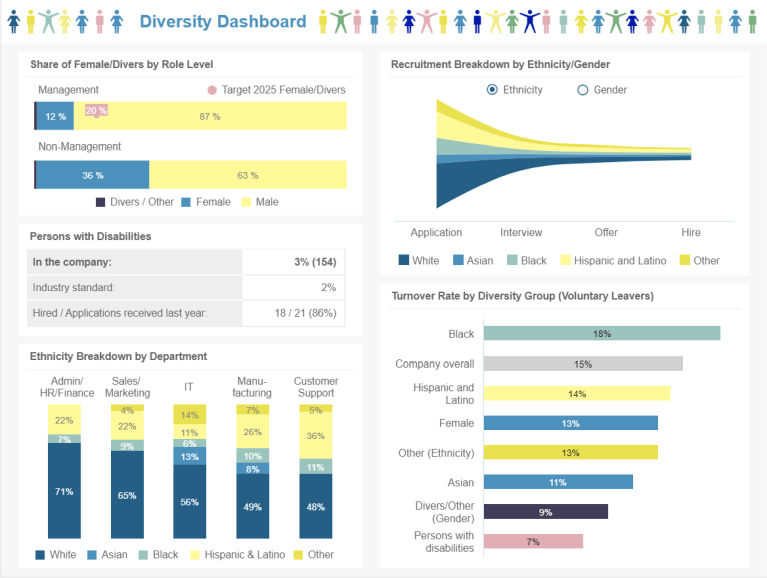
The dashboard above covers a set of metrics that allow HR professionals to closely monitor the diversity of the company in areas such as gender, ethnicity, and disabilities. On the top portion of the example, we have a graph showing the share of gender within the company. Here we can see that managerial positions are occupied in a large majority by men. However, it is expected that by 2025, 20% of these positions will be filled by women or employees of other gender diversity. Paired to this, we get a breakdown of recruitment by ethnicity or gender. Here you can easily visualize how diverse the organization is and can go even further by looking at the breakdown by department. Like this, you can understand at a glance if an area is not diverse enough.
Lastly, we get the turnover rate by diversity group. This graph tells you relevant information about the satisfaction levels of your employees. For instance, here we see that there is an 18% of black employees with voluntary leaves. This is something you need to look into in order to find the reasons and provide smart solutions.
These examples can provide you with building blocks for your own HR strategy that you can adjust to your own company’s specific requirements and capacities. To keep putting its value into perspective, let’s look at a few critical steps you need to follow to get started.
4) How To Get Started With HR Data Analytics
1) Define your HR goals: The first step to implementing a successful HR analytical process into your company is to think about your main goals and general needs. Successful HR departments align their strategies and goals towards those of the organization. For this reason, you need to formulate questions about how enhanced workforce administration could correlate to general company outcomes. Becoming data-driven will not only help you ensure you are extracting the maximum potential out of your human resources process, but also that the organization is moving forward. By thinking about specific goals, your process will be focused, and you’ll extract better insights.
2) Collect data: The HR department can collect a lot of knowledge coming from recruitment processes, talent management, and general employee performance. Once you have defined your general goals, it is time to collect the figures you will need to perform your analysis. This can be done with the help of a modern BI reporting tool that will help you easily merge data from several sources and put it together in an intuitive report. Common information collected in this process includes employee profiles, high-performers, salary history, demographics, training, engagement, retention, turnover, and much more.
3) Identify KPIs and metrics: Once you have defined your general goals, you need to choose a set of KPIs and metrics to measure them. Here you need to make sure you are choosing indicators that will allow you to monitor the performance of your goals over time instead of providing one single snapshot. Some common metrics to track in HR include the time to hire, recruitment costs, turnover rates, absenteeism, employee satisfaction, among others. If you want to learn how to choose the right indicators for your HR department, take a look at our complete guide on KPIs vs metrics.
4) Visualize your insights: Collecting relevant HR data and setting goals is nothing if you can’t extract conclusions from it. To make the information understandable for everyone, you need to rely on modern visualizations. We already showed you a list of HR dashboard examples to put into perspective the power of visualizing your human resources data. This will help you resonate with non-technical users as it makes the information clearer and more understandable.
5) Share and apply your findings: Successful HR data analytics processes save companies money and time. Once you have visualized your data and extracted relevant conclusions, it is time to share your findings and put them into practice. For example, if you found out that creative teams have a high turnover rate, you can implement retention programs to prevent any more of them from leaving. An important note here is to never stop evolving, there is a wide range of opportunities that come with data-driven decisions, and HR departments who stay on top of them will set themselves to succeed. However, this doesn’t come without challenges, and we will look at some of them in the next portion of the article.
5) Challenges Of HR Analytics To Overcome
When it comes to challenges, traditionally speaking, HR wasn’t that much data-driven. In recent years, predictive analytics, multiple data sources, deriving insights from relevant data have been introduced to HR and will keep growing in importance. That’s why HR managers, professionals, and VPs need to get to know the most common challenges to be able to tackle them effectively. Here we’ve gathered the most prominent ones and offered suggestions on how to approach them:
1) Lack of analytical skills: Many professionals have difficulties in managing HR data due to a lack of analytical skills. Combining HR and data analytics can be challenging for people that don’t have enough background and knowledge to comfortably manage larger or smaller sets of data as well as technical skills. Thankfully, educational opportunities and intuitive self-service BI software solutions that don’t require strong technical or IT knowledge have enabled professionals to evolve into analysts and use tools that will take care of heavy data processing while ensuring they focus on HR and human aspects of work.
2) Managing multiple data sources and touchpoints at once: HR needs to consolidate information from various sources and business lines such as sales, marketing, product, IT, etc. They need to acquire data from different departments and perform basic and advanced analysis to derive actionable insights. To effectively organize and cumulate the data from many operations, modern tools will serve as an effective solution since they can handle large (or small) datasets, connect any data source you might have, and leave you to focus on HR management.
3) Concerns about privacy and compliance: Collecting insights on a potential hire during the recruitment process, managing and organizing information gathered outside of a company can be quite challenging when it comes to the evolution of HR analytics. Many laws such as the GDPR in EU and CCPA in the US have emerged in recent years, and tightened the regulations that concern HR data collection as well. That’s why most companies need to adjust (if they already haven’t) their businesses, and ensure all the tools they use and information they collect are compliant with privacy in order to avoid a number of law-related issues.
4) Eliminating the human factor: Analytics for HR were introduced to make professionals’ lives easier and decision-making processes more effective to decrease companies’ costs. Letting the software, computer, spreadsheet or a pure number to decide who to hire is never the optimal solution. The point of utilizing analytics in HR is to empower professionals and create an environment that will ensure they make better decisions, but the final word should always include the human aspect as well. Data is there not to replace humans but to deliver additional value.
These challenges need to be taken into account when implementing analytics for human resources as they will serve as a good preparation process for companies that want to become more data-driven.
6) Conclusion & Key Takeaways
We have explained the HR analytics definition, guided you through the main benefits and real-world examples to deliver invaluable new information regarding this broad topic. Finally, our list of challenges can prepare you better in incorporating an analytical mindset and calculating external and internal requirements such as the usage of the right tools and respecting legal aspects.
HR professionals and managers need to transform their roles into a data-driven ones in order to become more competitive in attracting the right candidates and providing additional value to the company as a whole. This task is not easy but professional tools such as datapine can certainly help. With the power of consolidating as many data sources you might need, an intuitive interface that doesn’t require advanced analytical or technical knowledge, datapine can help you to become more data-driven and base your decisions on unbiased information as well as ensuring all your data is up-to-date with the help of powerful automation. But you don’t have to trust our word, we offer a completely free, 14-day trial, where you can explore your own data and generate insights immediately.
Take advantage of modern dashboard software features today!