
Reporting Software 2023 Discover The 10 Best Reporting Tools For Better Decision Making
Top Reporting Tools, Software & Applications Reviewed
Table of Content
1) What are reporting tools?
2) Why do you need reporting software?
3) What are the best reporting tools on the market?
4) Key takeaways & summary
Organizations of all sizes have relied on reporting techniques and tools to make sense of their data for countless years now. Traditionally, these reports were static and most likely generated by the IT department using tools like Excel or PowerPoint. That said, with the rise of the digital age and the amount of data being generated becoming bigger by the day, businesses have faced the need to make smarter decisions at a faster pace, making static reports less useful than they once were. Consequently, the reporting process has mutated into a more interactive and friendlier practice that enables everyone to generate and work with KPI reports and collaborate to guarantee data driven decision making that will boost business performance across the board.
This new way of reporting has paved the way for the rise of multiple report generation tools that aim at helping organizations make the process more efficient. Some of these tools are self-service while others require more technical knowledge, some focus on smaller businesses while others focus on larger enterprises, some offer online reporting while others are desktop-based, and the list can go on and on.
With all that in mind, choosing the right tool for your business can become a hard and overwhelming task. But do not fear, we’ve put together a list of the top reporting tools in the market to help you choose the one that fits your needs best. Before we dive into the list, let’s explore the definition of reporting software and why you need it to ensure your company is successful.
1) What Are Reporting Tools?
Reporting tools also known as reporting software, are applications that give businesses of all sizes a complete view of their performance. Through the use of KPIs, metrics, and visuals, organizations use these reports to make better, informed strategic decisions.
As mentioned, these solutions come in different versions and formats. Offering live reports, static reports, reports for specific industries, and much more. That said, no matter the targeted audience or the type of reports on offer, all these solutions have a common end goal: helping organizations manage their information in the most efficient way possible. They do this by providing the necessary functionalities for users to be able to explore the data and find trends, patterns, and opportunities to improve their performance and set themselves apart from competitors.
2) Why Do You Need Reporting Software?
Before we dive into our list of the best reporting tools, we will go through some key benefits of using these solutions to drive business success. Once you understand how they can boost your productivity and improve your business’ performance, you will be equipped to choose the best tool for your specific needs based on the categories and solutions that we will present below. But first, let’s go through some key benefits.
Informed decision-making: Being able to make informed decisions is arguably the most important benefit organizations can reap from using these solutions. They provide easy integration for multiple internal and external data sources including HR, customer service, finances, marketing, and sales, just to name a few, providing organizations with a 360-degree view of every important aspect of their performance from one centralized location. Plus, they offer dashboard reporting capabilities on visually interactive formats that make the data in them easier to understand and digest for any user without the need for technical knowledge. Through this, everyone in the organization is empowered to use data to make decisions, making the entire company more successful in the long run.
Save time and money: As you will learn from this post, most business reporting tools in the market offer report automation as one of their key features. Being able to automate the generation process saves businesses countless hours of manual work which can be dedicated to other tasks. Plus, automation ensures no human errors are committed while generating a report. For instance, when manually selecting the data, a mistake can be made that can affect the accuracy of the entire decision-making process, costing the business a lot of money. Hence, performance reporting tools save businesses time and money while boosting efficiency.
Improved collaboration: Another important benefit of these solutions is that they can significantly boost collaboration. The best reporting tools offer users multiple options to collaborate through the use of reports. For instance, BI reporting tools such as datapine offer online reports that can be accessed by any user from any device with an internet connection. This enables team members to stay connected through reporting without the need to be in the same physical place, making collaboration easier and more productive.
Without further ado, let’s dive into our list of reporting tools comparison!
3) The Top 10 Reporting Tools – A Detailed Review
To build our review list in the most accurate way possible, we’ve divided it into 10 common reporting categories from business intelligence to financial to IT reporting. We took into consideration reviews from two of the most prominent websites for software comparisons and user reviews: Capterra and G2. For our investigation, we considered highly rated tools for each category that had a minimum of 50 reviews between both platforms until January 2023. The only exception is our example of a free reporting software, as these usually have less reviews.
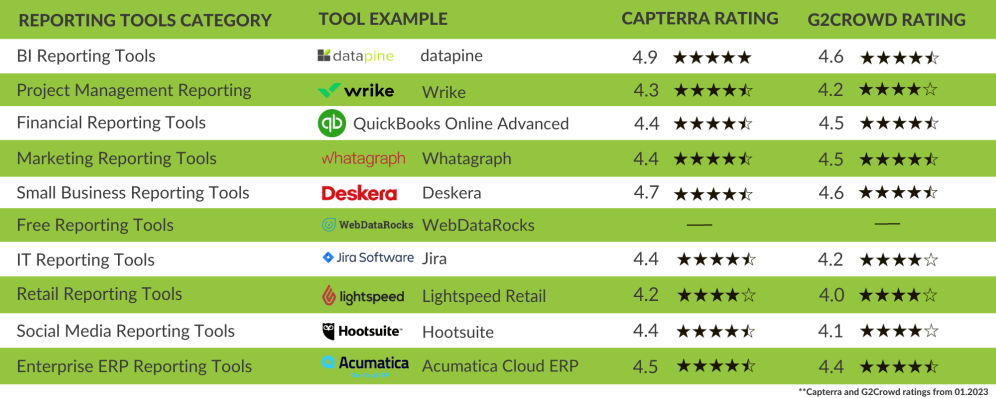
- Review summary of the best reporting tools for 2023 with customer ratings -
1) Business Intelligence Reporting Tools
BI reporting tools help collect, monitor, and analyze business data from various sources with just a few clicks. The data is later displayed in real-time using various types of data visualizations to generate interactive reports full of hidden insights waiting to be untapped. These solutions have opened the analytical doors to a wider audience due to their self-service nature which allows any user, without the need for technical knowledge, to generate advanced reports and use them to optimize their daily operations. Gaining this level of insight gives businesses a big competitive advantage with the necessary knowledge to ensure continuous growth.
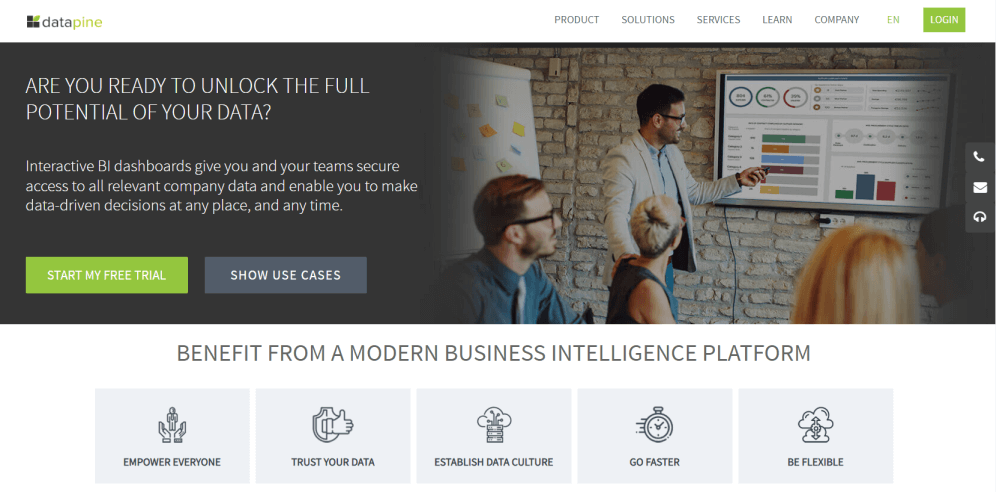
1. datapine
KEY FEATURES:
24/7 access to dashboard reports with real-time data through any device with an internet connection
Access to over 80+ report templates for different departments, industries & platforms
Multiple sharing options including automated email reports, live dashboards & embedded analytics
datapine is a business intelligence reporting tool built with a user-friendly interface that enables users of all company departments to easily connect their data and generate real-time reports in the shape of interactive business dashboards with just a few clicks. This is possible thanks to datapine’s drag-and-drop interface that allows anyone to generate reports using stunning data visualizations without writing a single line of code.
The affordable reporting tool also offers multiple ways to explore the data in the reports through the use of interactive filters that let you go into granular levels of data and answer any questions that might arise during the analysis process. Plus, report generation can be automated and easily shared in multiple formats such as email, PDF, password-protected URL, and more, to boost team collaboration. Managers can also set viewer rights to ensure that only the right people have access to the reports and information in them. Reviewers of datapine have rated the tool with an almost perfect score of 4,9 stars in Capterra and 4,6 stars in G2.
2. Project Management Reporting Applications
No matter the nature or size of a project, it is very likely that unexpected issues or situations will arise. Being able to stay on top of these situations and tackle them as soon as they occur is the key to successful project completion. This is where project management reporting software comes into the picture. These solutions offer project managers and teams the 360-view they need to carry out the project and meet their goals in the most efficient, productive, and collaborative way possible. These tools provide insights into project status, task completion, time management, and much more to ensure every stage is carried out at an optimal level. Let’s put this into perspective with an example.
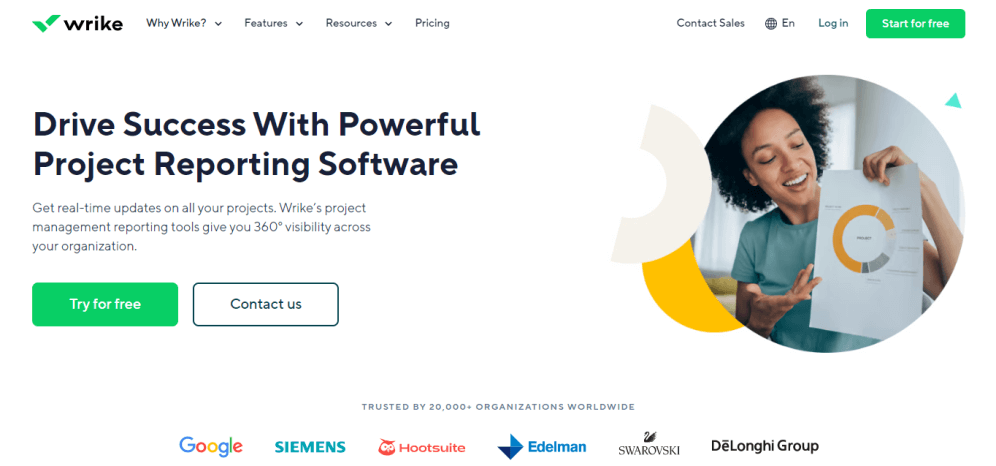
Wrike
KEY FEATURES:
360-view of project development with real-time updates
Integration with over 400 tools to keep all your teams’ needs in one single interface
Advanced report filters to customize the data being analyzed
Wrike is an easy-to-use project management reporting tool that enables users to generate visual reports to keep track of every relevant development regarding project completion including general time management, project progress, task completion by each team member, budget use, and much more. Each report can be either generated from scratch and customized according to individual users’ needs, or out of pre-built templates for specific industries and functions.
Wrike is available for teams starting with 5 members up to an unlimited number, and it offers over 400+ pre-built integrations with other relevant tools such as Salesforce, Google, Dropbox, and many more. Through this, users are expected to gain a complete view of their performance and use it to make informed decisions as well as minimize potential risks. All of this earns Wrike a positive rating of 4,3 stars on Capterra and 4,2 on G2.
3. Financial Reporting Tools
Finances are at the top of the list when we think of a business area that can truly benefit from high-quality reporting. This is because it is one of the only departments that is obligated to generate reports for legal purposes, such as complying with tax regulations. But not just that, good finance reporting tools provide organizations with the necessary features to extract the maximum potential out of their financial data through interactive reports for internal and external purposes. For instance, a company might generate an external financial report to show to potential investors who are considering buying stock, or senior management might generate an internal one to assess profitability, manage cash flow, build budgets, and other important internal tasks. Let’s dive into our example for this category.
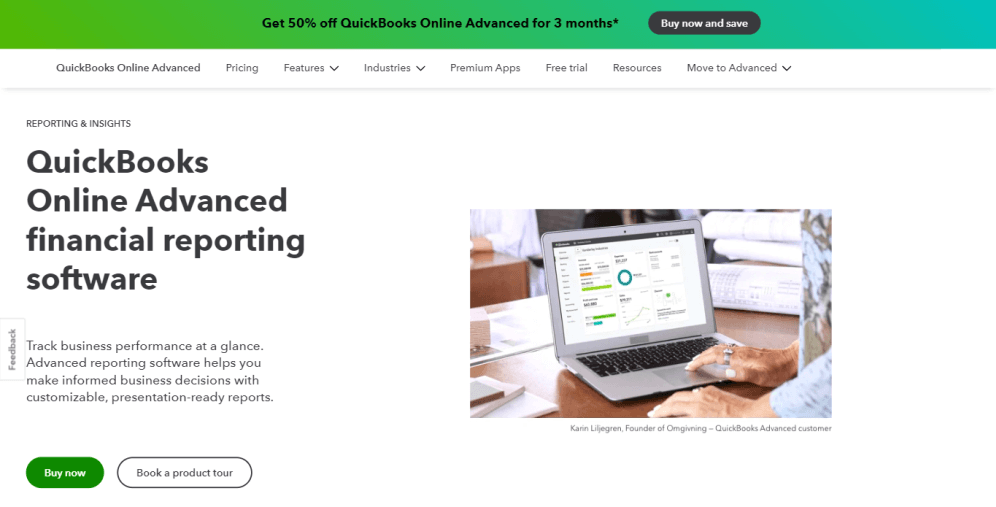
QuickBooks Online Advanced
KEY FEATURES:
Customizable financial reports that can be sent to anyone via email
Spreadsheet Sync feature to upload and download data from Excel
Real-time reporting for financial statements such as income statements and balance sheet
QuickBooks Online Advanced is a financial reporting software that offers advanced reporting features for businesses that want to assess their performance and make better financial decisions. The tool enables users to generate real-time financial statements such as income statements and balance sheets as well as tailored reports to meet specific company requirements.
The reports can be easily shared with your accountant or any other relevant person within the company via scheduled emails, making it possible to collaborate. QuickBooks Online Advanced also offers a feature called “Spreadsheet Sync” that allows you to upload and download data from Excel to generate up-to-date reports. This highly praised financial software has 4,4 stars rating on Capterra and 4,5 on G2.
4. Marketing Reporting Platforms
When we talk about performance tracking, marketing immediately comes to mind. Rather it’s an in-house marketing team analyzing their results or an agency having to report to clients about the progress of their campaigns, agile reporting is an integral part of a successful marketing strategy. With that in mind, marketing reporting software is designed to help marketers generate customizable live reports that can be easily shared with clients to prove the value of their campaigns and optimize when necessary. Let’s dive into our example.
Whatagraph
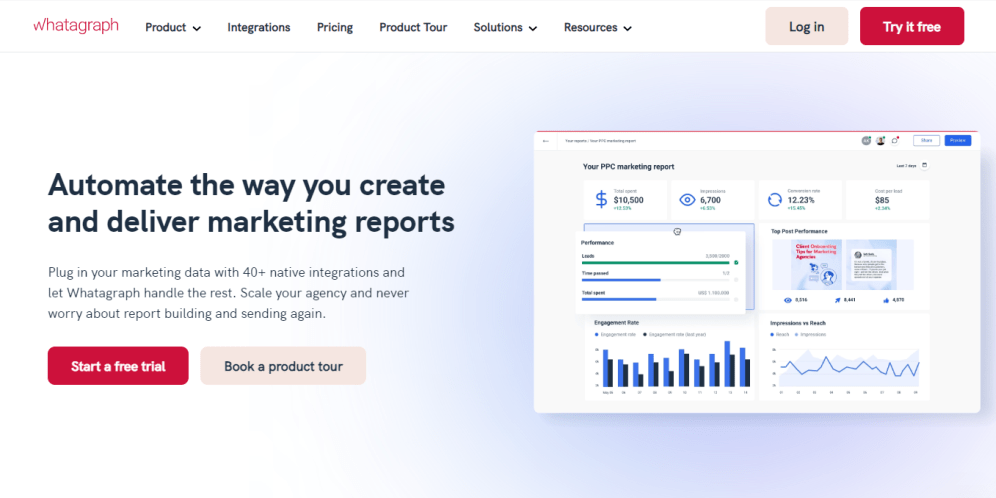
KEY FEATURES:
Automatically extract live marketing data from over 40+ native integrations
Automated report generation to be sent to clients on a predefined schedule
Easy report generation through visually appealing templates and widgets
Whatagraph is a marketing reporting platform for agencies and in-house marketing teams looking to build efficient and visually appealing reports to show the performance of their campaigns to clients and other stakeholders. The tool, which was “built by marketers for marketers”, can be connected with over 40+ sources that automatically update to get the latest data available and generate live reports.
Additionally, Whatagraph offers users the possibility to generate custom reports tailored to clients’ branding or through pre-built templates for a faster design process. Reports can also be automated based on pre-defined criteria and sent to recipients via email, for instance, to send clients’ weekly performance updates. All of these valuable features earn Whatagraph a positive rating of 4,4 stars on Capterra and 4,5 on G2.
5. Small Business Reporting Tools
For many years, analytics and reporting solutions were only thought of for larger corporations that could afford an in-house analytics team to develop reports. However, with the business landscape becoming more and more competitive by the day, small companies have also started to rely on analytics to extract actionable insights from their data and stay ahead of competitors. With that in mind, small business reporting tools offer the necessary functions to help smaller companies leverage professional reports in a clear and not complex way. Unlike other solutions that are more focused on offering advanced functionalities, small business reporting software is focused on making the lives of these companies easier and more efficient through the use of interactive reports that can be easily generated.
Deskera
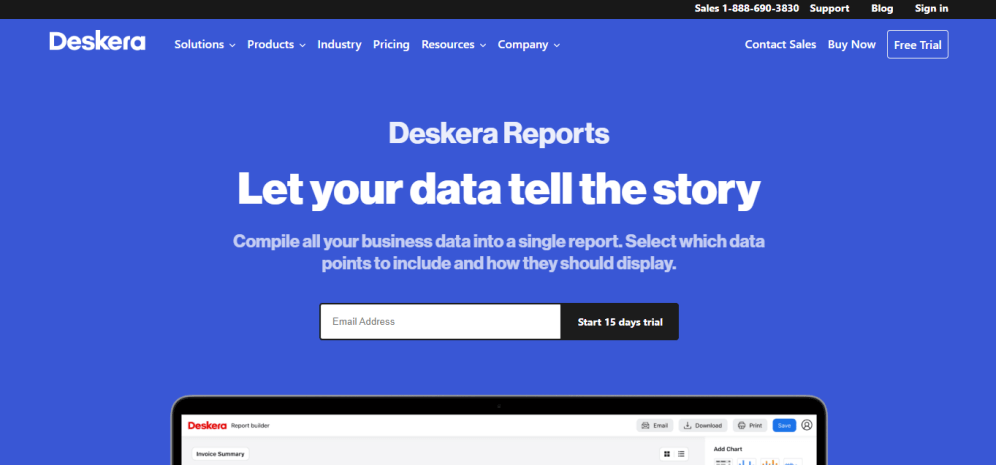
KEY FEATURES:
Multiple graphs and charts options to visualize your data in the most accurate way
Share reports in multiple formats such as print, download, email, or a live URL
Automated reporting with real-time updates
Deskera is an all-in-one cloud-based business software that offers reporting features for small and mid-sized businesses that want to boost their productivity and performance using professional reports. Without the need for complex IT infrastructure, Deskera users can connect multiple data sources and easily generate reports in the shape of visual dashboards using templates or customizing them according to their specific needs.
Additionally, the tool offers the possibility to automate regular reports containing the latest developments and share them in various formats such as print, email, and others. All-in-all Deskera promises to offer enterprise-level capabilities at small business pricing, gaining it popular recognition and positive ratings of 4,7 stars on Capterra and 4,6 on G2.
6. Free Reporting Tools
As its name suggests, a free reporting tool offers a set of report-generation functionalities without cost. These solutions are often used by independent workers or really small businesses that are just getting started with analytics and don’t feel comfortable with investing in a tool just yet. That said, there are two different types of free reporting software, paid ones that offer free limited versions, and completely free ones. For our example, we will focus on one that is completely free but is not lacking in any of the key functionalities. For this specific case, we will not mention Capterra or G2 ratings as free tools often don’t have the resources to gather or encourage reviews.
WebDataRocks
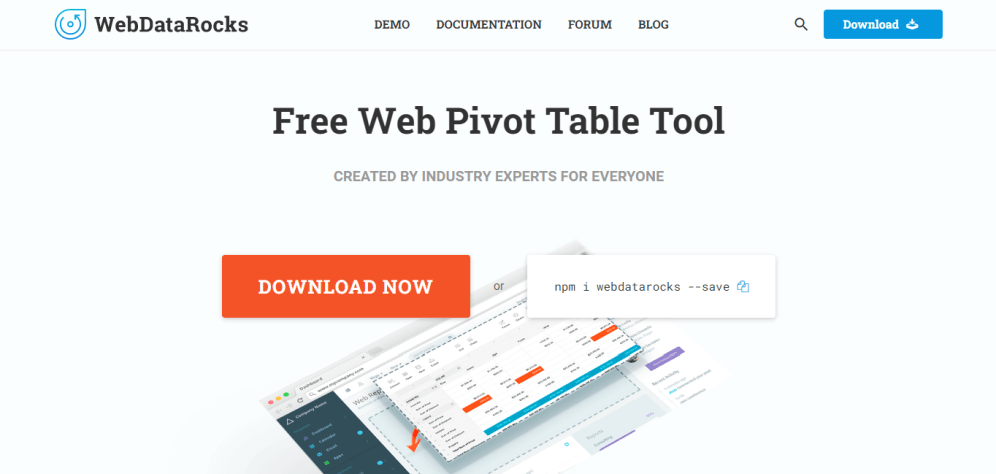
KEY FEATURES:
Easy integration in less than 5 minutes with no need for technical knowledge
Excel-like features like filtering, sorting, grouping, conditional and number formatting, among others
Real-time data reporting from multiple devices including PC, mobile, and tablet
WebDataRocks is a free web reporting tool that offers real-time data analysis through interactive visualizations. The software which is “created by industry experts for everyone” is written in JavaScript and can be easily embedded into any website, application, or project web with just a few lines of code.
The tool has an Excel-like interface that enables users to explore their reports using filters, drill-downs, calculated fields, conditional formatting, and much more. Even though it is free, WebDataRocks was designed to fit the needs of businesses of all sizes. Reports can be exported into PDF, Excel or HTML pages to be shared with any relevant stakeholder. Plus, they can be displayed on various devices to meet the user’s needs. Definitely, a complete solution that is deserving of the position of best free reporting software on our list.
7. IT Reporting Tools
In addition to carrying out day-to-day tasks such as solving helpdesk tickets or working on web-related projects, the IT department needs to tirelessly work towards ensuring that the company’s system is working at an optimal level. This means identifying bugs, potential cybersecurity threats, or bandwidth issues and being aware of anything happening within the system to tackle it immediately and avoid downtime. For this purpose, they rely on IT reporting tools to keep track of all activities in real time through interactive KPIs.
Jira
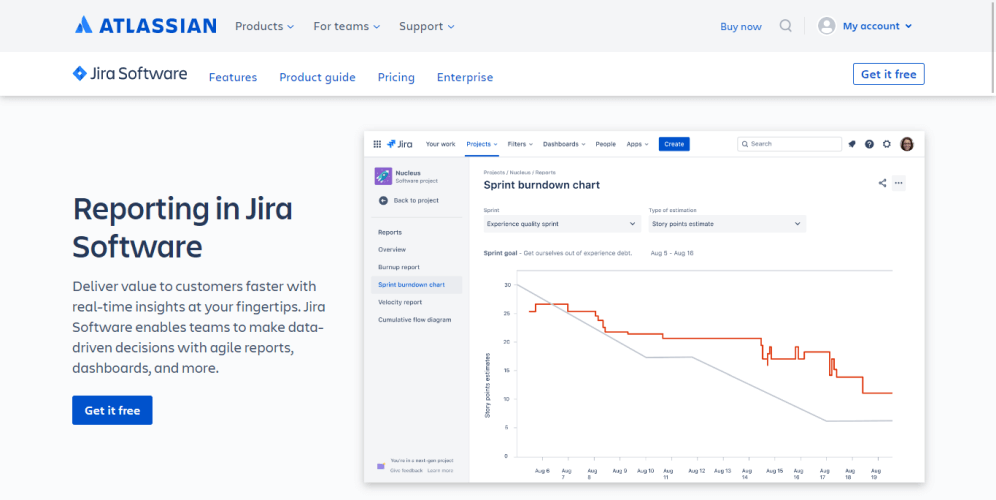
KEY FEATURES:
Real-time reporting with insights for agile decision-making
Special reporting capabilities for scrum teams including sprint reports and burndown charts
Agile reporting for kanban teams including cumulative flow diagrams and control charts
Jira is a software that has reporting features at its core. The tool offers a wide range of real-time reporting capabilities to cover many IT-related tasks including monitoring project development toward goals, issue tracking, backlog assessment, time tracking, sprint management, and others.
That said, there are three key types of reports offered by the software. Issues report, to monitor and solve any type of issues that arise, agile reports, to show the planning and progress of individual and team projects, and lastly, forecast and management reports, which are used for time tracking, forecasting, and workload management. These reports can be turned into visual dashboards with multiple graphs and charts options to visualize the data in the most accurate way possible. Jira has a positive rating of 4,4 stars on Capterra and 4,2 on G2.
8. Retail Reporting Solutions
Retail reporting solutions are industry-specific solutions that assist retail businesses in tracking every aspect related to their operations and performance, including inventory and stock management, product development, sales on different channels, customers, employees, and more. Through this, retailers can spot trends and patterns in their data and inform their most important strategic decision to ensure that every aspect of the supply chain is running at an optimal level, boosting profitability in the process.
Lightspeed Retail
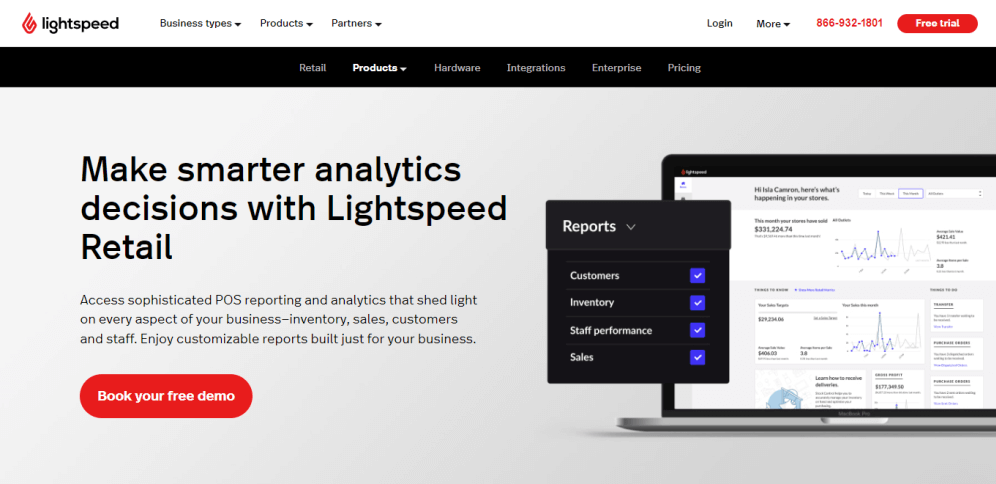
KEY FEATURES:
Specific reports to boost customers, inventory, staff performance, and sales
Mobile access to check on your stores from any location
Customizable reports to cover specific company needs
Lightspeed Retail is one of the most popular reporting tools in the retail industry. It provides reporting capabilities to cover every key aspect of a retailer’s performance including inventory, customers, staff performance, and sales.
Powered by features such as demand forecasting, product performance analytics, customer behaviors analysis, staff productivity reports, and POS reporting, users can get a 360-view of their performance and spot any issues as soon as they occur. Plus, reports are customizable to meet the company’s specific needs and requirements. Users of Lightspeed Retail have rated the tool with 4,2 stars in Capterra and 4,0 stars in G2.
9. Social Media Reporting Tools
A report building tool for social media proves to be highly beneficial in many aspects. For instance, by looking at a performance report for your latest Facebook posts you can extract conclusions about which type of content your audience likes the most, which platform they prefer to use to interact with your brand, at which times of the day they are most active, and much more. Armed with those insights, marketers can build informed strategies based on audience preferences which will most likely be successful. But not just that, these solutions often offer real-time reporting which means campaigns don’t need to stay online for 30 days before you can assess their success. Let’s put this into perspective with a very popular example.
Hootsuite
KEY FEATURES:
Custom reports for all social media platforms with the KPIs that matter the most to the organization
“Hootsuite Impact” feature to understand what drives your social media ROI
Free weekly analytics report containing clicks, popular links, and other relevant user data
If you ever worked with social media or marketing before, then you’ve probably already heard of Hootsuite at some point. Arguably one of the best reporting software for social media, Hootsuite offers professional analytics and reporting capabilities to help its users get a 360-degree view of their performance across all relevant social media platforms.
The tool, enables users to generate custom reports with performance benchmarks to make sure goals are being met while boosting engagement and driving traffic at the same time. Additionally, the “Hootsuite Impact” feature enables users to calculate social media ROI to understand how their social media efforts are driving business growth. Reviewers have rated the tool with 4,4 stars on Capterra and 4,1 stars on G2.
10. Enterprise ERP Reporting Tools
Enterprises and big corporations gather massive amounts of data from multiple internal and external sources every second of every day. To efficiently manage all of this valuable information, they need to rely on the right tools and technologies to turn huge amounts of raw data into actionable insights. That is where Enterprise ERP reporting tools come into the picture. These solutions offer analytics and reporting technologies to help enterprises make sense of their data and use it to make smarter, informed decisions. Unlike other categories on this list, enterprise reporting tools tend to be more complex and difficult to use as they cover a wider scope. That said, as technology advances, these solutions become more intuitive and easy to use.
Acumatica Cloud ERP
KEY FEATURES:
Report generation in multiple formats including HTML, PDF, Excel, or Word
Multidimensional reporting to breakdown key data into smaller dimensions
Role-based reporting go securely share sensitive data based on users’ roles and needs
Acumatica Cloud ERP delivers reporting solutions in an intuitive format to help enterprises manage their data and accelerate their decision-making process to promptly react to market changes and ensure sustainable growth. Reports containing real-time data can be generated via pre-built templates or be customized to meet specific user requirements as well as your company’s branding and image.
Whichever option you choose, you can use ad hoc filters to find the data you need in the report which can later be exported in various formats and shared securely thanks to a security rights feature. Users of the tool rated Acumatica with 4,5 stars on Capterra and 4,4 on G2.
4) Key Takeaways & Summary
As you learned through our data reporting tools list, these solutions are designed to make businesses’ lives easier and much more efficient by providing the necessary means to manage vast amounts of raw data, and turn it into actionable performance insights.
If you want to start your analytics journey and generate stunning reports to skyrocket your performance, try datapine’s modern business reporting software which covers nearly all of the discussed product functions in this article. Test datapine for 14 days free of charge and with full functionality!
Take advantage of datapine's modern BI reporting solution today!