The Top 5 SaaS KPIs Every Successful SaaS Company Needs to Track
There’s so much data out there. This is especially the case if you work in a SaaS startup, and our goal here at datapine is to help you understand all of your data sources. For this reason, this post is dedicated to helping data-driven people lead their business. For the sake of clarity there’s a lot that might sound redundant to readers well versed in SaaS metrics, but we’ve done our best to create value for everyone in this spectrum.
To start, Software-as-a-Service, or SaaS, is a popular way of accessing and paying for software. Instead of installing software on your own servers, SaaS companies enable you to rent software that’s hosted, this is typically the case for a monthly or yearly subscription fee. Like a gym membership, instead of spending a lump sum on buying a treadmill and a set of weights for your home, you could pay a much smaller fee to use the equipment at your local gym.
More and more CRM, marketing, finance, and business intelligence tools use SaaS technology, and even Adobe’s Creative Suite has adopted the model. All things considered, the concept is relatively new.
The first mention of this software distribution model was in an internal document in 2000, and by now the size of the SaaS market is estimated to grow to more than $21 billion. As opposed to the application service providers of the 1990’s, it’s become extremely popular because it keeps operating costs down and improvements can be pushed out all at once. The risks are much more limited for users because of low implementation costs and for the provider due to the scalability of the business model.
SaaS companies are quite different than traditional businesses, especially when it comes to the metrics that matter. Mostly they must invest heavily upfront to acquire the customer, but recover the profits from that investment over a long period of time. There are a few key SaaS KPIs, like CAC, churn rate, and MRR, that will make or break your company.
In this post we will look at the top five KPIs every SaaS company needs to track. These metrics are crucial to the success of your business, and can easily be monitored with our data analysis software. All the charts used in the post are based off of sample data that mirrors the numbers of a successful, early stage SaaS startup.
1) Visitors and Signups (Free Trials)
Typically, SaaS companies offer a free trial period which serves as the first step of the sales cycle. That's why you need to utilize a conversion funnel that tracks how many people convert into trial users and paying customers. The first part of that acquisition funnel is how many people visit your site, and the second part is how many sign up for a free trial.
The goal should be to increase the number of free trials, which will in turn lead to paying customers (step two). This goal can be met by increasing the total number of visitors leading to more trials or by increasing the conversion rate by presenting your product in the best way possible and offering a clear unique selling proposition (USP).
Visitors & Signups (Free Trials)
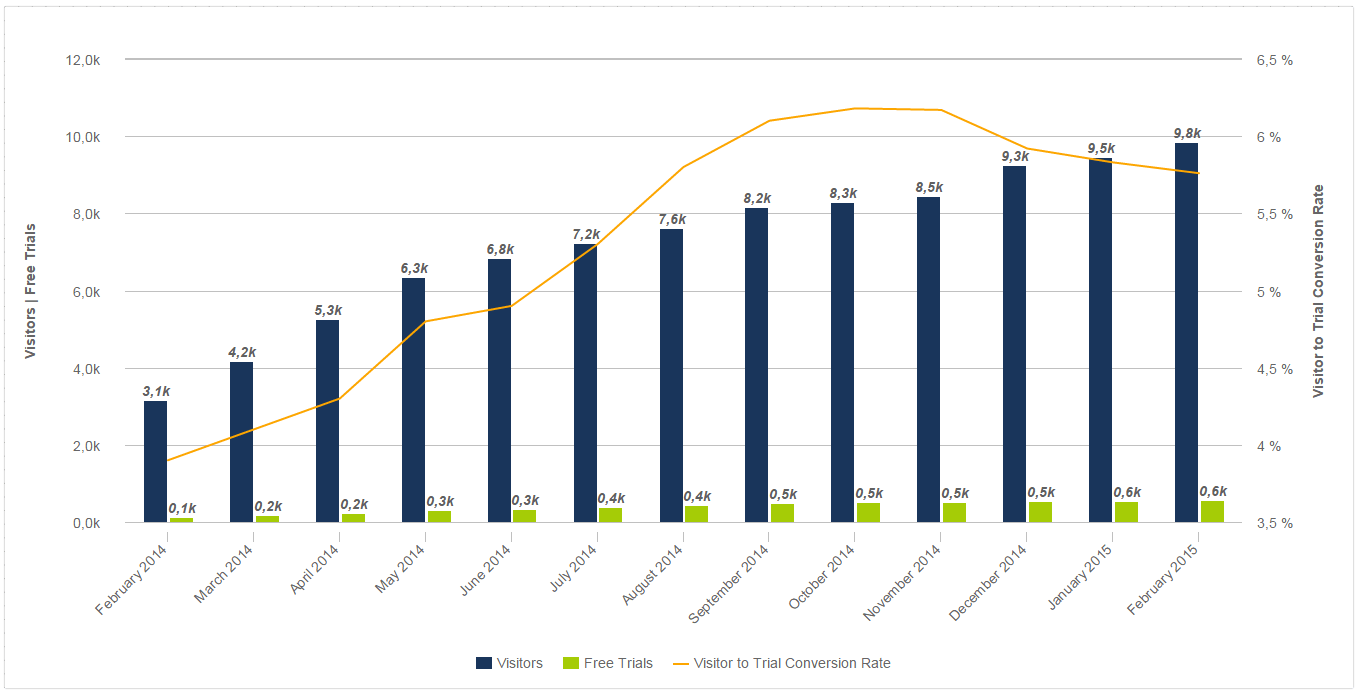
In the chart above you can see steady growth in both visitors, free trials, and most importantly the visitor to trial conversion rate. A company with these kind of numbers is targeting the right audience through an effective online marketing strategy. Learn more about the most important website KPIs in one of our recent blog posts.
2) Paying Customers and Churn Rate
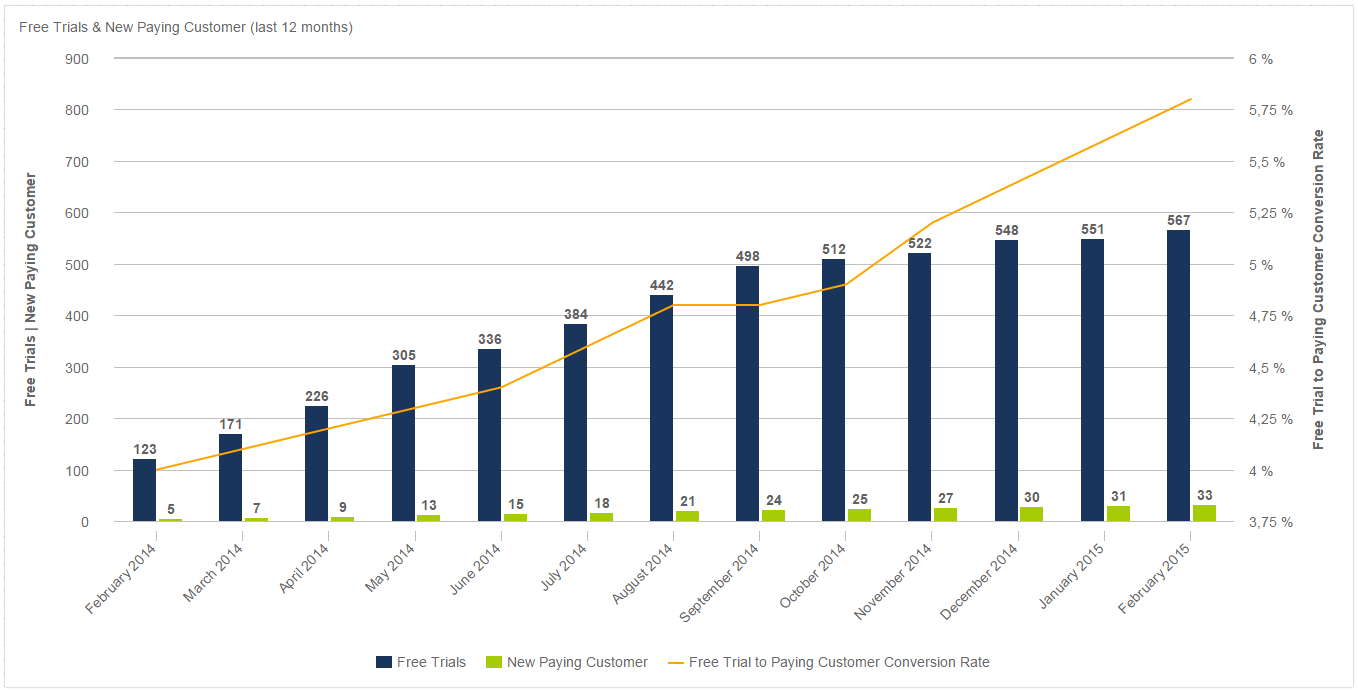
Ideally you want your number of free trials, paying customers, and conversion rate to steadily increase like in the example chart below. How do you get there? Enter the second part of the acquisition funnel. For the most part, this part of the funnel falls in the hands of the sales team, and of course the product itself (does the value really live up to the promised USP?). This can be a tricky part of the funnel. People love signing up for free stuff, but do they use your product enough to actually pay for it?
Free Trials & New Paying Customers
It’s common knowledge that an active free trial user is much more likely to close. So the focus should be on the steps you need to take to make sure your trial users get to that active category. Use tutorials, Q&A’s, live demos and webinars to strengthen your onboarding process.
First you must figure out what SaaS guru, Lincoln Murphy calls Common Conversion Activities – or CCA – that he defines as “The things that all or most paying customers do during their trial.” If you look at everyone who goes from trial user to paying customer what exactly did they do before they converted?
Twitter serves as a great example of how CCA changed their onboarding process. Twitter discovered that “once a user follows 30 people, they’re more or less active forever.” With this knowledge they changed their onboarding process so that now, when you sign up for an account, you must follow a certain number of people before the signup process is complete.
Total Paying Customer | New Paying Customer | Lost Paying Customer & Churn Rate
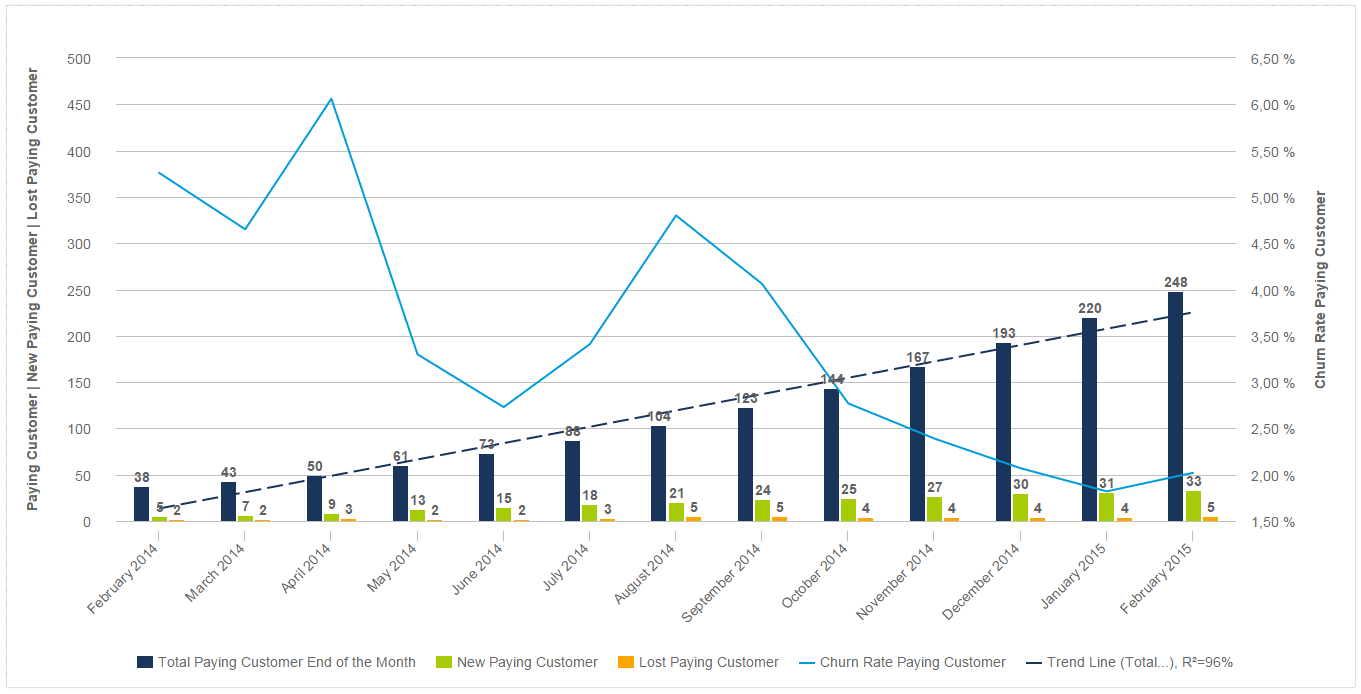
This chart goes another step further by detailing new customers, customers lost, and churn rate. Your churn rate refers to the rate at which your customers are canceling their subscriptions.
In this sample chart, everything is going well. Paying customers are significantly increasing, with a trend fit of 0.96 (which is highly statistically significant), new paying customer are increasing as well and churn rate is dropping. A healthy churn rate to benchmark is 5-7% annually which translates to 0.42 – 0.58% monthly churn, but in the beginning, a monthly churn rate of even 7-10% is not uncommon. In the example above you can see that churn was steadily decreasing and then spiked in July in August. This could have been a new release which dissatisfied many customers, which would signal that a correction would be needed.
3) Monthly Recurring Revenue (MRR)
Monthly Recurring Revenue (MRR) is a calculation of your monthly subscription revenue. If your customers are paying annually, you simply divide the annual revenue amount by twelve. This is perhaps the most critical SaaS KPI. There are many key metrics to monitor when building your company, but before you can focus on churn rates or lifetime value of customers, you first need monthly income.
Net MRR | MRR from New Customers & Account Expansions | Lost MRR
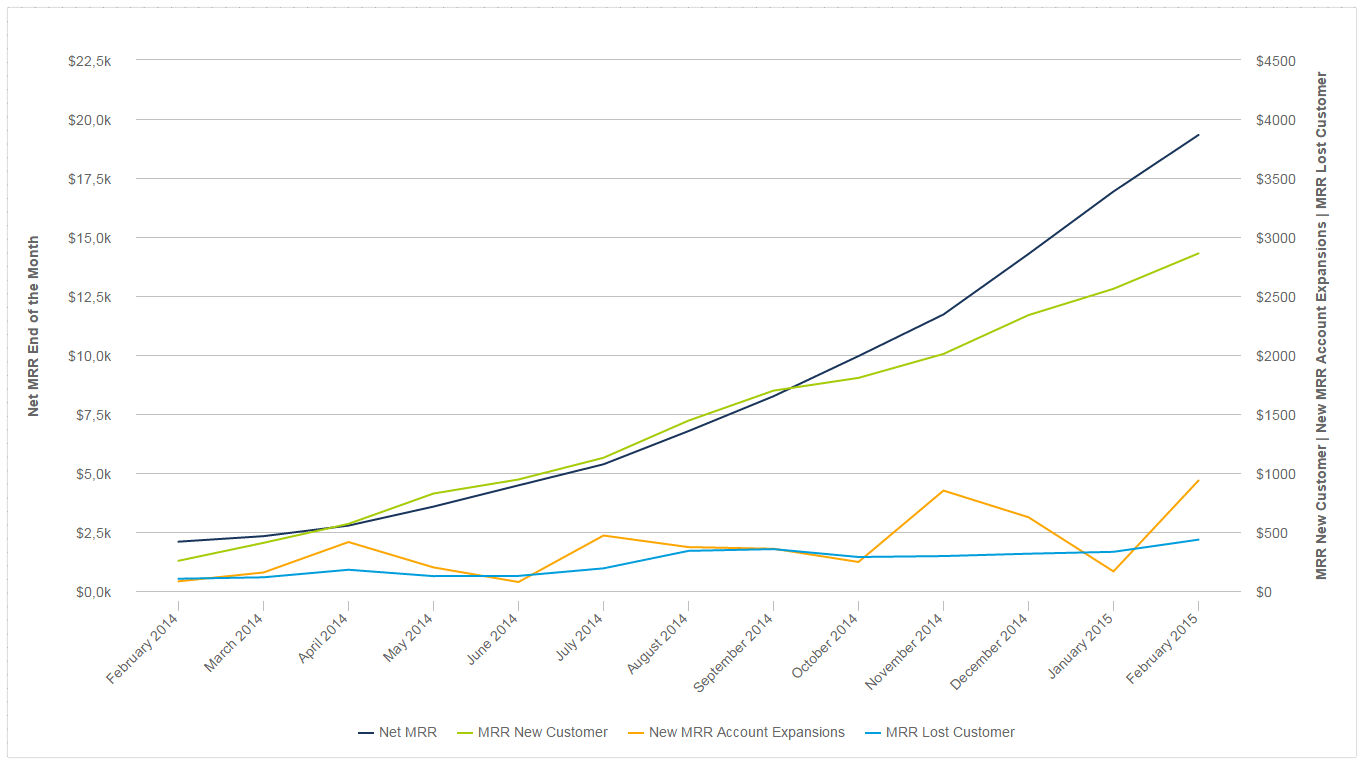
The chart above takes a deeper look into MRR by splitting it off into MRR through new customers and through account expansions. Account expansions, are always a great avenue of growth and can mean that your customers' needs are growing (for example they need to add more users) or you have new additional features as a way to upsell. The chart also looks at lost MRR. The goal is to have lost MRR be as small as possible, or even have a negative MRR churn rate. If your lost MRR is high, it signals that is might be time to look at your product and your original USP.
4) CAC and ARPU
CAC stands for customer acquisition cost. CAC is calculated by looking at all costs allocated to the acquisition of new customers including marketing and sales expenses, and dividing that number by the total number of customers you acquired during the same period.
ARPU is an acronym for Average Revenue Per User. To calculate this KPI you simply take the average MRR of all your paying customers. ARPU enables you to calculate the time it will take to recover your CAC. It makes sense to track this on a monthly basis.
CAC & ARPU for New Customers + Time to Recover CAC in Months
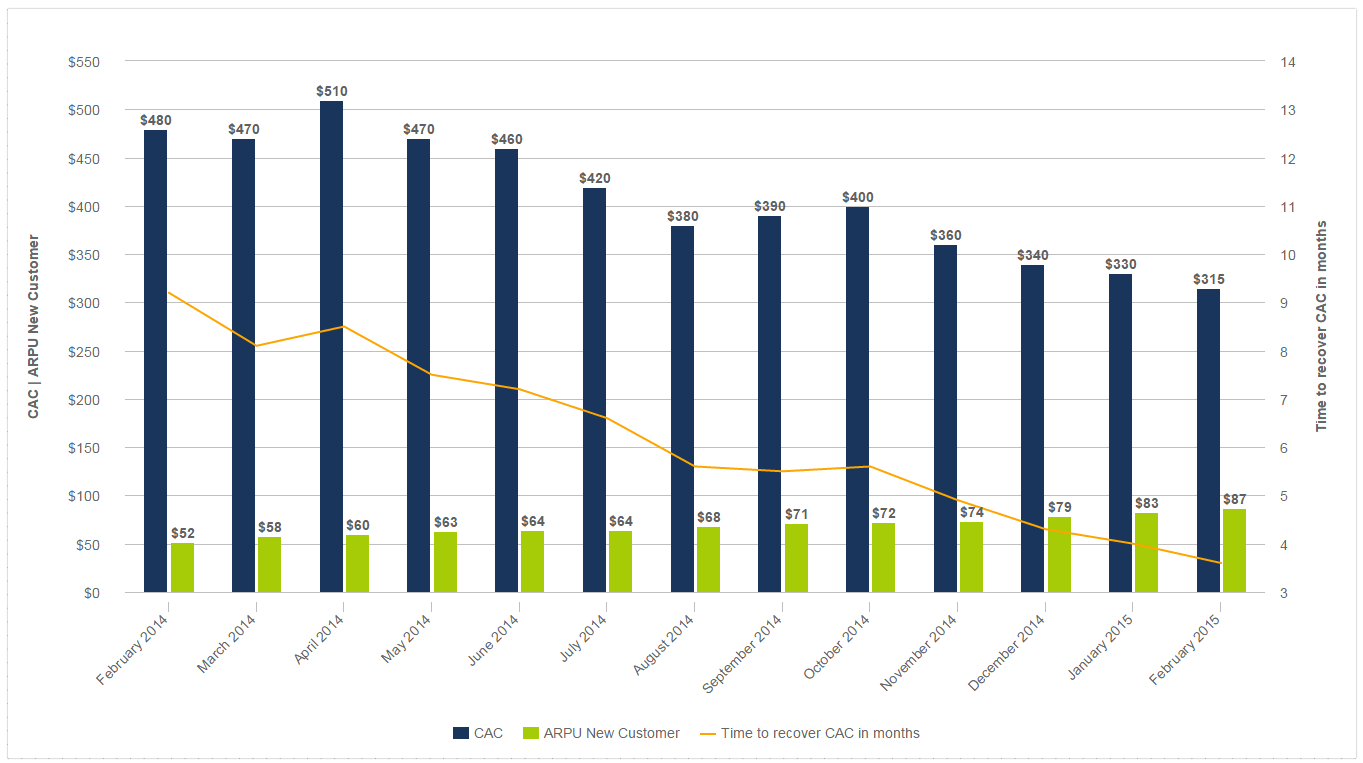
Often SaaS companies have to invest heavily upfront to acquire the customer and recover the profits over a long period of time. The chart above is an idealistic representation of the amount of time it would take to recover CAC - it falls from nine months to under four. Realistically, younger companies often have high CACs due to aggressive outreach during the first few years. The goal, however, should be to increase ARPU by signing bigger deals and upselling features.
Development of CAC and CLTV on a Monthly Basis
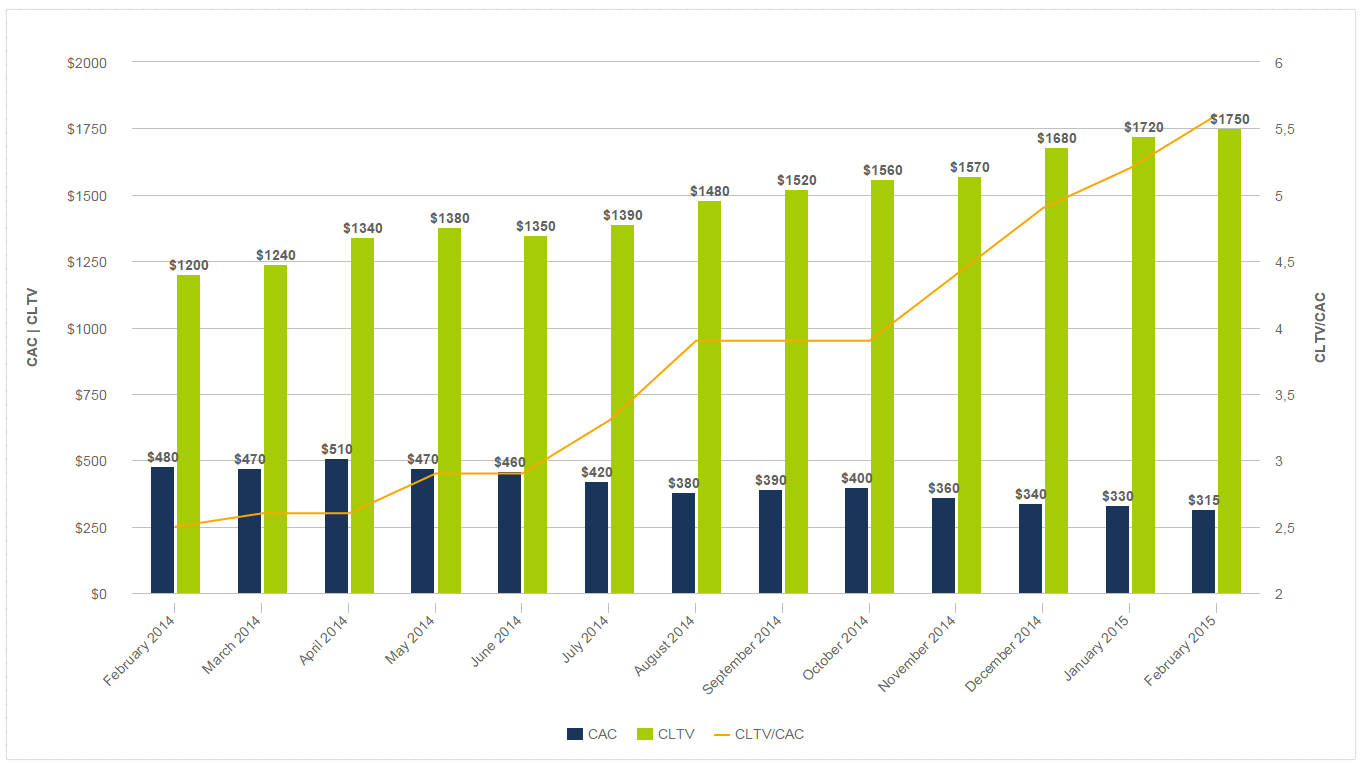
Customer Lifetime Value (CLV) is the amount of money you’d expect to make from a customer over the lifetime of your relationship, minus your CAC. The higher the ratio of LTV to CAC the better, but in most successful SaaS business the ratio should be higher than three. The chart above is an ideal example with CLTV increasing and CAC decreasing as time goes on.
5) Cash Status and Runway
This last set of SaaS KPIs is especially useful for externally funded young startups, which often have negative cash flows. With these KPIs you can track your overall cash flow, how long you will survive with the current available money at your current burn rate, and how the relationship between total expenses and MRR is developing.
Bank Account Balance and Runway in Months
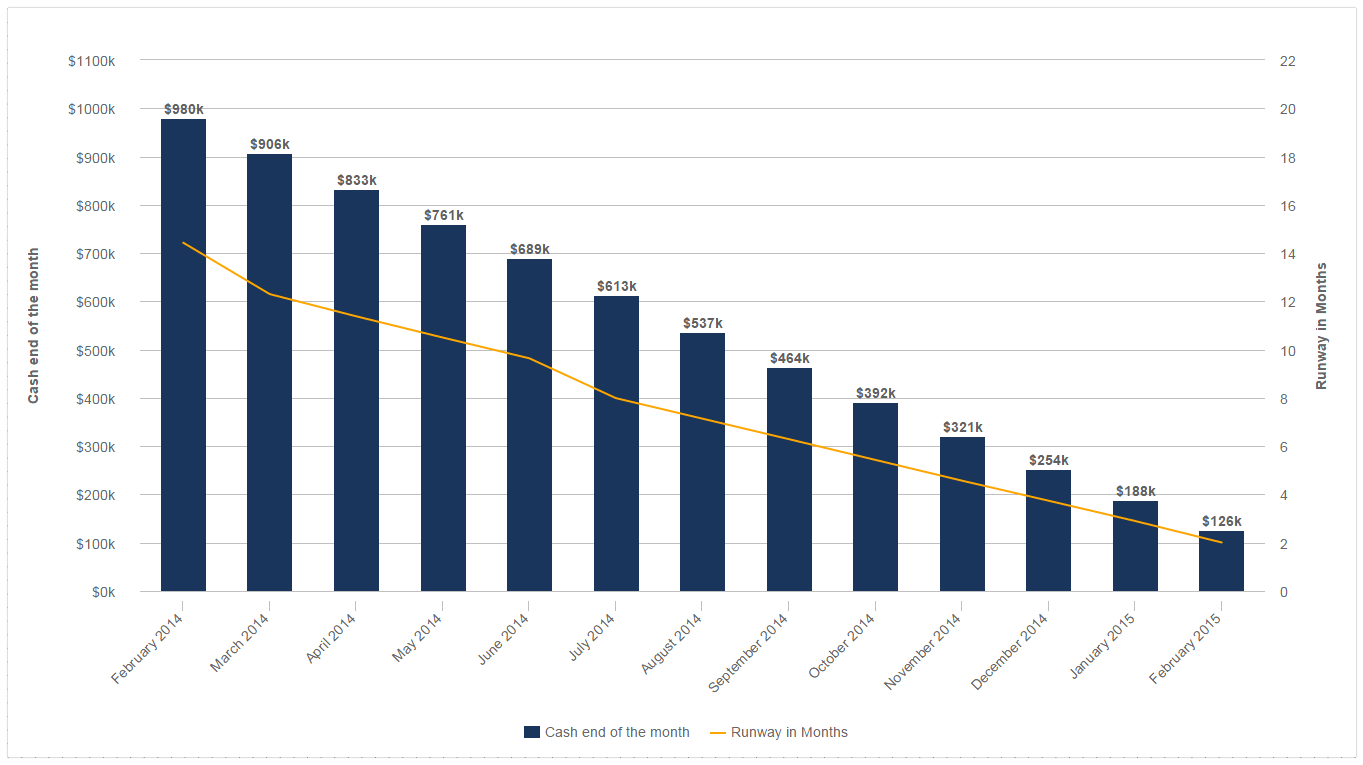
This Cash Overview & Runway in Months chart example shows the bank account balance at the end of the month, calculated from the current total cash difference (here negative cash flow) by month in order to see your runway (how long you will survive at the current burn in months). In this example, this chart is alarming as the company will run out of money within two months. Now let’s look at their chances of future investment.
Development of (Negative) Cash flow and Net MRR
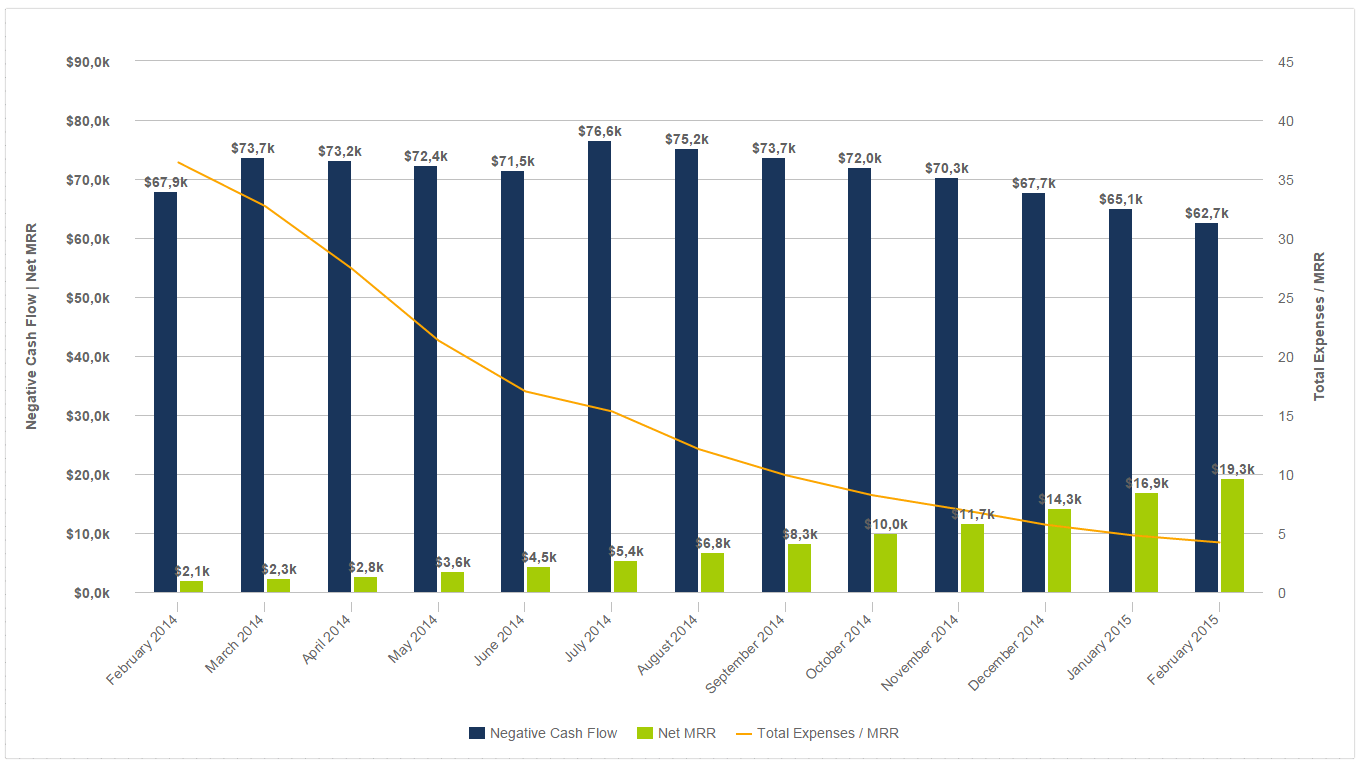
This chart would be interesting for potential investors as it compares Total Expenses, Net MRR and tracks how the cash flow develops over months. By showing the narrowing gap between Negative Cash flow and Net MRR, and the falling Total Expenses/MRR trend line, odds of investment is quite good. You can also use these KPIs to make a prediction that estimates when you will enter a positive cash flow phase, based on the development of the last twelve months.
Are you interested in improving your company’s performance by tracking these critical SaaS KPIs? Sign up for our 14-day free trial, and within minutes you’ll build meaningful charts just like the ones in this post.