SQL JOINS: A Beginner Guide to Data Analysis using SQL
 Nowadays companies often produce a tremendous amount of data and mashing up this data to get a clear picture of the business is a fundamental part of the whole data analysis process. To be able to compare and combine data from different tables or data sources like databases, CSV Files, CRM systems or Web Analytics we need to JOIN these tables. SQL Joins are an instruction to a database to combine data from more than one table. As different SQL JOIN types are an integral part to perform useful and meaningful SQL data analysis we want take a closer look at the commonly used types and provide some practical tips for you.
 Why use SQL JOIN?
You’re in a business that accumulates data, and to get a clear view, you need to understand what this data means. There are often duplicate entries in your data, and SQL JOIN clauses will help you find the relevant data you need. Using SQL JOIN clauses is perfect for combining rows from two or more tables and the common fields behind them.How do SQL joins work?
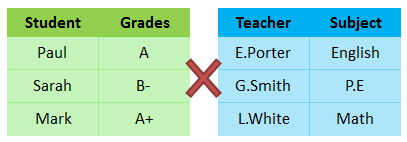 It’s easy, you just need tables with common fields. In short, SQL JOIN is to join entries from different tables, to see if they match or mismatch. In the example below, you’ll find it’s not possible to join or link these tables because they have no field in common.
What are the common SQL JOIN types?
1. INNER JOIN
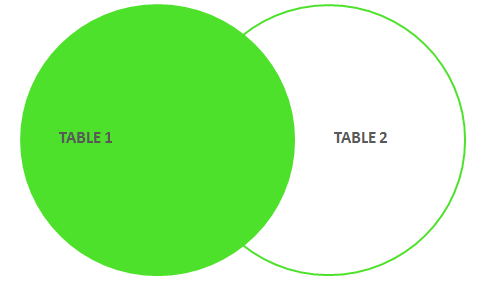
 INNER JOIN, in the most commonly used SQL JOIN clause, it matches the set of records that appear in both tables. Using the example data on beer below, we’ve made it so that table 1 has the rows on Beers and Type. Whereas table 2 has matching entries on Beers and has entries on Alcohol Content but not on Type. Since the entries on Beers match, we can display a correlation on both Beers, Type and Alcohol Content.
 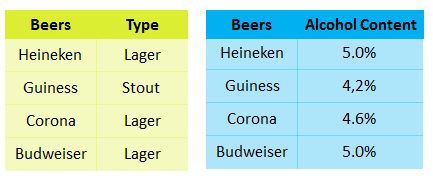 We can join these two tables by their common field: Beer Brands, here labelled in the row Beers. The result is one table that has all the information and fields from the previous two tables. The general idea behind INNER JOIN is to display just the rows that appear on both tables.
 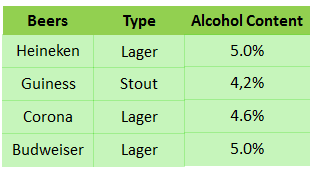 SQL Query Example: SELECT Table1.Beers, Type, Alcohol Content
FROM Table1
INNER JOIN Table2
ON Table1.Beers = Table2.Beers Beware of: If the table1 would have another row (different beer brand not existing in the table 2), then this record would not appear after the join.
SQL Query Example: SELECT Table1.Beers, Type, Alcohol Content
FROM Table1
INNER JOIN Table2
ON Table1.Beers = Table2.Beers Beware of: If the table1 would have another row (different beer brand not existing in the table 2), then this record would not appear after the join.2. LEFT JOIN
 A LEFT JOIN will display every record from table 1 and the matching records from table 2. For every record that doesn’t match, it will be displayed as NULL. Fields from table 2 that aren’t matching table 1 simply won’t be displayed.
 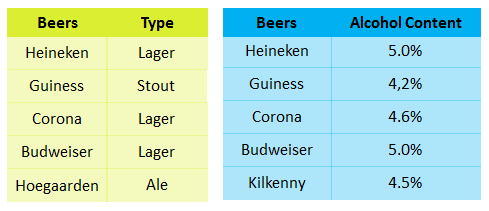 In our example, table 1 contains one record that does not match with table 2. Since the entry Hoegaarden appears in rows Beers and Type in the LEFT JOIN, and because there is no entry for Alcohol Content for Hoegaarden, it displays as NULL. You’ll notice this result in the green table below. Incidentally, records in table 2 that do not match in table 1 will not appear in the table at all.
 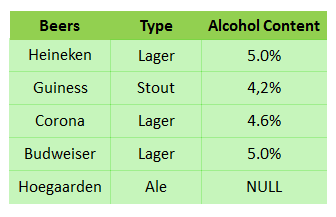 SQL Query example: SELECT Table1.Beers, Type, Alcohol Content
FROM Table1
LEFT JOIN Table2
ON Table1.Beers = Table2.Beers Beware of: Be mindful that the table that is considered as the “left table” depends on the syntax of your query. The first table mentioned in the query is automatically considered as the left table, while the second table in the query is by default labelled as the right table.
SQL Query example: SELECT Table1.Beers, Type, Alcohol Content
FROM Table1
LEFT JOIN Table2
ON Table1.Beers = Table2.Beers Beware of: Be mindful that the table that is considered as the “left table” depends on the syntax of your query. The first table mentioned in the query is automatically considered as the left table, while the second table in the query is by default labelled as the right table.3. RIGHT JOIN
 A RIGHT JOIN is similar to the Left Join only the roles are reversed. Basically you return all rows from the right table and the matched rows from the left table. The result would be the green table below.
 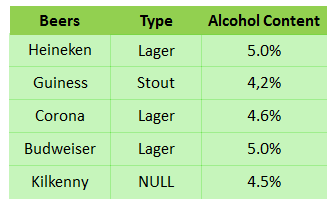 SQL Query example: SELECT Table1.Beers, Type, Alcohol Content
FROM Table1
RIGHT JOIN Table2
ON Table1.Beers = Table2.Beers Beware of: In this specific case, since in the row Type of the Kilkenny entry isn’t available in table 1, it displays it as NULL. However, as we want to display all information available from the right table, Alcohol Content is displayed for Kilkenny.
SQL Query example: SELECT Table1.Beers, Type, Alcohol Content
FROM Table1
RIGHT JOIN Table2
ON Table1.Beers = Table2.Beers Beware of: In this specific case, since in the row Type of the Kilkenny entry isn’t available in table 1, it displays it as NULL. However, as we want to display all information available from the right table, Alcohol Content is displayed for Kilkenny.4. FULL OUTER JOIN
 An OUTER JOIN, also known as a FULL JOIN, as set to return all rows when there is a match in one of the tables. This SQL JOIN type is used to join both the left and right tables simultaneously. Basically it is a LEFT and RIGHT JOIN at the same time. Again, the result is shown in the green table below.
 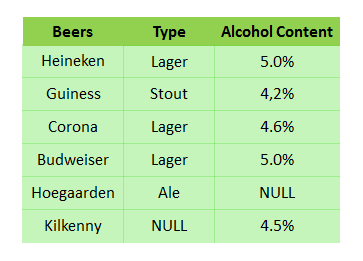 SQL Query example: SELECT Table1.Beers, Type, Alcohol Content
FROM Table1
FULL OUTER JOIN Table2
ON Table1.Beers = Table2.Beers Beware of: Although both Hoegaarden and Kilkenny have missing entries in two rows, from two different tables, the Full Outer Join query allows you to see any and all other entries that do match.
SQL Query example: SELECT Table1.Beers, Type, Alcohol Content
FROM Table1
FULL OUTER JOIN Table2
ON Table1.Beers = Table2.Beers Beware of: Although both Hoegaarden and Kilkenny have missing entries in two rows, from two different tables, the Full Outer Join query allows you to see any and all other entries that do match.Summary
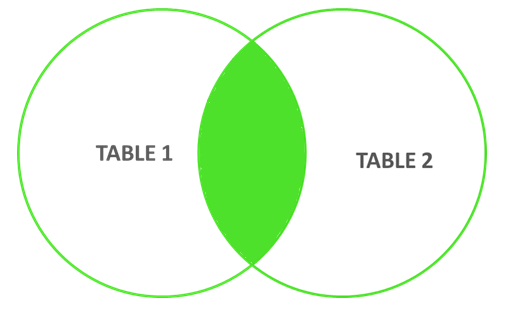
These are the most common SQL JOIN types you’ll likely encounter and need. Before making a query, think about your data, the different scenarios and results you’d like to have and which SQL JOIN clause you should use. As short summary the chart below visualizes the different joins.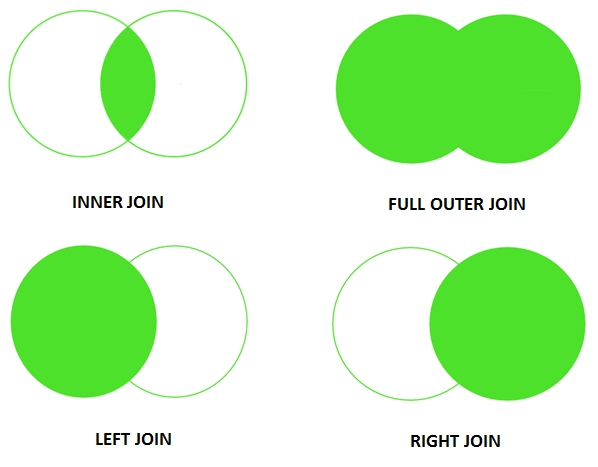 Now that we’ve overviewed SQL JOIN principles, a good question to ask is what kind of tool do you need for these types of queries?