The Top 5 ecommerce KPIs & Metrics You Need To Know To Boost Your Business

“What you measure usually gets paid attention to, and what you pay attention to, usually gets better.” — Seth Godin
We couldn’t put it any better than the Godfather of independent marketing - if you want certain aspects of your business to get better, you need to measure those aspects. On the surface, this seems like common sense. You might even roll your eyes a bit - of course you are measuring things in your business. You have metrics, you know how many email subscribers your ecommerce business has, and you know your revenue numbers…. Isn’t that enough? Well, the answer depends. We don’t want to preach to you - after all, you’re the one building your business, not us. And you're the one who lives with the consequences of your decisions. All that we are suggesting is that if you have a few ecommerce Key Performance Indicators (KPIs) that you pay a lot of attention to, you’re going to have an easier (and more likely) chance of fulfilling your business goals. While all companies share an overarching goal of increasing revenue and profits, there are many, many ways to accomplish these bottom line driven targets.
Explore our 14-days free trial and grow your ecommerce using data.
The Difference Between a Metric And a KPI
A metric is any aspect of your business that you can measure. Some metrics are important, others aren’t. A KPI is a metric that accurately gauges how successful you are at executing a key component of your business plan. There are a lot of different KPIs, but you shouldn’t track more than a few that reflect the unique traits of your ecommerce business. Compiling them in real-time business dashboards will help you greatly in your work.
For example, if you primarily use Facebook ads to acquire new customers, your KPIs will look a lot different than if you were using content marketing to make sales. And if you heavily rely on email marketing to make ecommerce sales over time, there’s a few KPIs that would accompany that business model. However, right here we’re going to focus on the ecommerce metrics that matter once customers are already on your website. That way, regardless of your acquisition channel for your ecommerce business, you can get a lot of value out of this post.
In this article, we’ll be going over 5 ecommerce metrics that measure crucial aspects of your business. We’ll also give you some targeted advice on how to improve each of these KPIs over time. Here are the 5 KPIs we’ll be discussing:
- Average Order Value (AOV)
- Customer Lifetime Value (CLV)
- Shopping Cart Abandonment Rate
- Returns As % of Sales
- Top Products By Contribution Margin Ratio
Our Top 5 ecommerce KPIs And Metrics
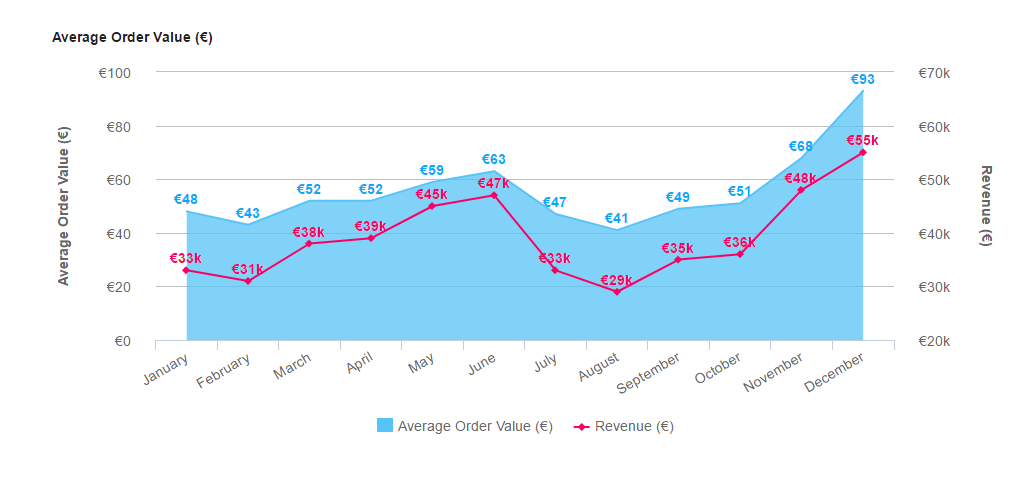
1) Average Order Value (AOV)
** click to enlarge **
What AOV shows you:
How large your average finished transaction is.
How to calculate AOV:
Average Order Value = (Sum of Revenue Generated In A Time Period) / (# of Orders In That Time Period)
Average Order Value is pretty straightforward - the higher this KPI is, the better. With that being said, there are some situations where it’ll actually make more sense to stress other KPIs (such as shopping cart abandonment rate) at the expense of AOV.
How to increase AOV:
Increasing your AOV is easier said than done, but one of the best ways to do so is to offer free shipping on orders that are slightly more expensive than your current AOV. Let’s break that down a bit.
Let’s say your AOV right now is $23 dollars. If you offer your customers free shipping if they spend $25 dollars or more, there’s a good chance you’ll increase your AOV without any negative repercussions in other metrics, since people love free shipping and will often spend more to get it.
Psychology writer Dan Ariely talks about this phenomenon in his book “Predictably Irrational”: the price tag of “free” has a very powerful and unique effect on consumer behavior. However, you’ll want to A/B test your free shipping at a certain price point model with free shipping regardless of the price, because of one other crucial metric: shopping cart abandonment rate. If a customer sees that they have to pay for shipping unless they spend 3 more dollars, they may just decide to not order at all. This effect goes up as you increase the “cutoff” for free shipping. And that’s fine, up to a certain point. But by A/B testing, you’ll be able to tell what strategy leads you to the ultimate, granddaddy KPIs - revenue and profit.
Here are some other ways to increase your AOV ecommerce metric:
- Offer a bulk discount for items that make sense to receive them.
- Offer package deals.
- Copy Amazon’s strategy of cross-selling by displaying items that make sense to be bought with the product your customer is currently doing. For example, look at all the cross sells Amazon displays when you are looking at a piece of cat furniture.
- Offer upsells, aka slightly more expensive versions / upgrades of the item your customer is viewing on the same page - and make it easy for customers to switch.
2) Customer Lifetime Value (CLTV)
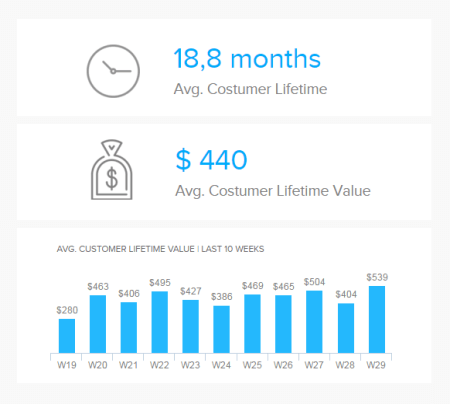
What CLTV represents:
How much you make from each customer over the course of their relationship with you.
How to calculate CLTV:
CLTV = [(Average Order Value) x (# of Repeat Sales) x (Average Retention Time)] - CAC
The CAC represent the Customer Acquisition Costs, that have to be taken into account as it is money invested to turn a prospect into a customer. Let's illustrate that formula. We imagine that your compagny had last year 50 customers that made repeated purchases - 3 times a year. These purchases were on average of $42. You expect these customers to have the same behaviour at least this year again - so we calculate with a retention time of 2 years. To get these customers however, you had to invest on average $28 for each of them.
Your CLTV = (42$ x 3 x 2)-28$= $224
If you could only use one ecommerce KPI (other than sales or revenue) for your business, we would recommend that you use CLTV. Why? Because if you do well on your CLTV, you’re virtually guaranteed to bring in substantial amounts of revenue and profit. Think about it: it’s much easier (and cheaper) to sell to old customers than new ones. And if you have a high CLTV, that means you can afford to spend more on customer acquisition, helping to ensure that you get the right kind of customers (the ones who will stick with you).
Finally, you can use your Customer Lifetime Value as a great way to segment your current customers and focus your efforts. If you segment your customers by LTV and you also have data on where you acquired each of those customers, you can use that information to double down on the acquisition channels that are giving you the highest LTV customers.
How to increase CLTV:
The best way to increase your CLTV is to give amazing customer service. Two Harvard Business School MBAs explain why in an article summarized as “The Economics of E-Loyalty”. The HBS grads found in a 1990 paper that increasing customer retention rates by 5% increased profits by 25% to 95%, in many different industries. They also found that many businesses followed the pattern of struggling early on due to high customer acquisition costs, and the businesses that survived did so because of repeated business.
In a follow-up study, they found that these patterns were only magnified on the web. As the article states: “In apparel e-tailing, repeat customers spend more than twice as much in months 24-30 of their relationships than they do in the first six months.” The take home point: amazing customer service is the secret to long term business success.
Explore our 14-days free trial and grow your ecommerce using data.
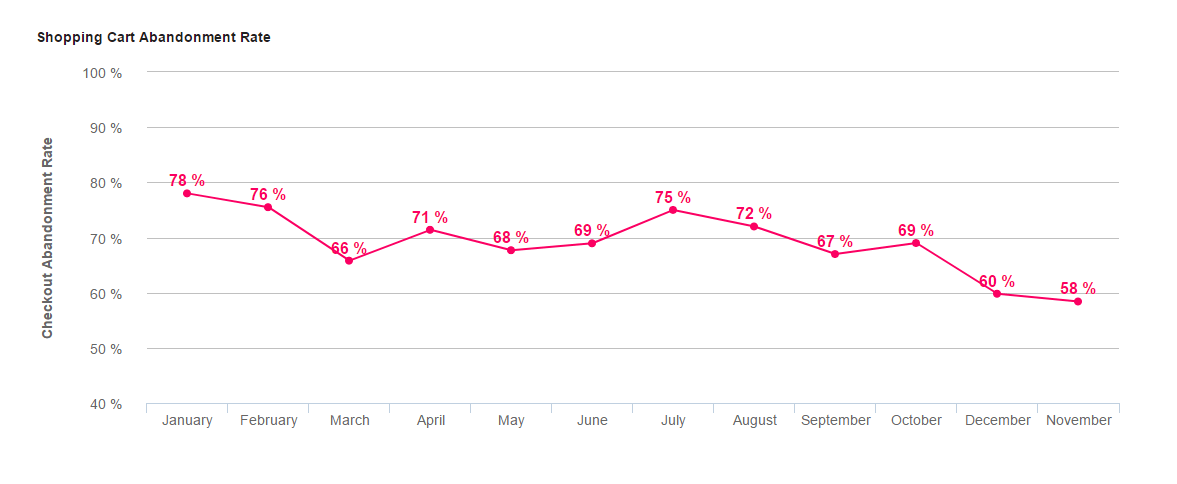
3) Shopping Cart Abandonment Rate
** click to enlarge **
What the shopping cart abandonment rate ecommerce metrics represent:
Of the people who put an item into your shopping cart, how many of them leave your website without completing the transaction?
How to calculate shopping cart abandonment rate:
Shopping Cart Abandonment Rate (%) = (# of people who don’t complete checkout / # of people who start checkout) * 100
For example, if 1000 people add items to carts, but only 200 actually end up buying, then you have a Shopping Cart Abandonment Rate of 80%. This is a crucial ecommerce KPI to focus on, because in all likelihood you’ve already spent quite a bit of money to get the customer to your shopping cart. There’s potential for a large ROI here that will more than recoup those acquisition costs if you can just nudge them a little further.
How to reduce shopping cart abandonment rate ecommerce metrics:
First off, you have to understand that people are ALWAYS going to abandon shopping carts, for reasons entirely beyond your control. That’s just a fact of life. That would represent at least 37% of people in the following data from Statista:
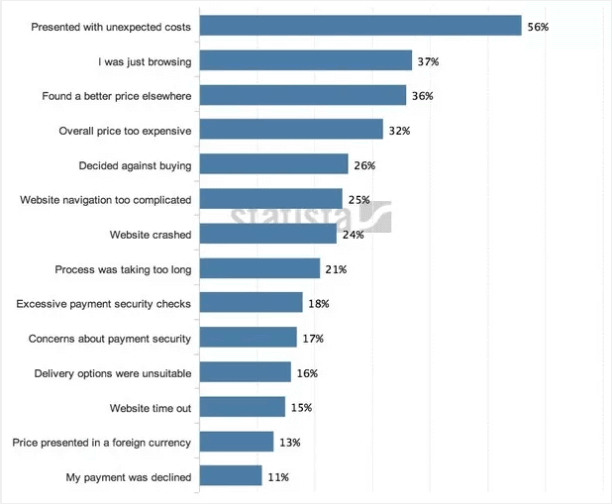
However, there are many things within your control that will lower your abandonment rate:
- Make your checkout process as easy and simple as possible
- Have email funnels designed specifically for abandoned carts, “holding” their contents and waiting for the customer to complete them
- Add money back guarantees to your pages, and seals of trust (a copywriting tactic to boost conversions)
- Make shipping costs really transparent, as customers hate hidden fees
4) Returns as Percentage of Sales

** click to enlarge **
What Returns as Percentage of Sales represents:
How often customers are returning your products.
How to calculate Returns as Percentage of Sales:
Returns as Percentage of Sales = (Amount of Products Returned In A Time Period) / (Amount of Products Ordered In A Time Period) x 100
Obviously when it comes to returns, the lower, the better. This ecommerce KPI - also useful for the retail industry - serves as a "warning sign" first and foremost, letting you know if your returns jump. If they do, there are a few possible reasons:
- You’re getting bad traffic. For example, if your returns jump up after you start a new ad campaign or a new channel, that could mean that you’re attracting the wrong kinds of traffic/buyers.
- A new product is a low quality. So if you introduce a new product and this metric jumps, that's a bad sign.
- The marketing for a certain new product doesn’t accurately describe what that product does.
How to reduce Returns as Percentage of Sales:
You’re always going to get some returns, just as you’re always going to have some “window shoppers” who abandon your cart due to no fault of your own. So this metric isn’t necessarily one that you should worry about getting as low as possible. However, you can and should use this ecommerce KPI as a warning signal when you make a change in your business. If your returns spike, that’s a sign that something is going awry - and you need to put in further effort to see what the cause is.
5) Top Products By Contribution Margin Ratio
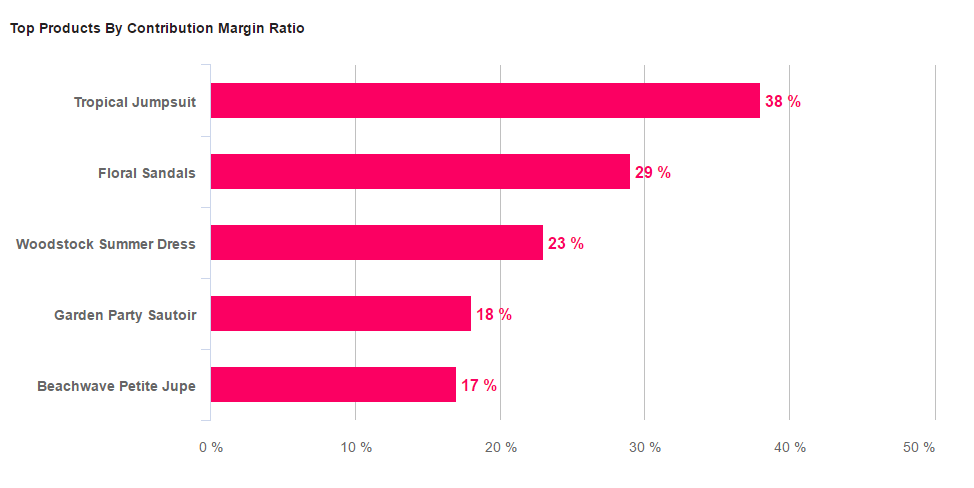
What Top products by Contribution Margin Ratio represents:
Which of your products are contributing the most to your profits.
How to calculate Top Products By Contribution Margin Ratio:
Contribution Margin Ratio = [(Sales price – Variable costs) / Sales Price] x 100
The variable costs can be labor, overhead, or materials. To have the ratio per unit, you must divide the Contribution Margin per unit by the unit sale price. That way, you will know what percentage of each dollar of revenue is generated to cover your fixed costs. For instance, your company sells phones for $100. Per unit, the labor expenses are of $28, the materials cost $34 and variable overheads of $5. The Contribution Margin Ratio will be: [(100$-28$-34$-5$) / 100$] x 100 = 33%.
How to use Top Products By Contribution Margin Ratio:
This ecommerce KPI shows you which products are doing the best for you in terms of profit, and therefore gives you an idea of what products you should be focusing on marketing and/or feature on your home page. And it’s much more useful than looking at your top selling products alone, because of the profit margins involved. For example, if your top selling item has a really low profit margin, then maybe you don’t want to be pointing people to that product!
This KPI is also is a form of customer research, as it shows you where some potential new revenue/profit opportunities are to be had. If you find that a certain product is bringing in way more than its fair share of profit, you can capitalize on that info by launching products in a similar vein for cross sales or offering upgraded versions for upsells.
Explore our 14-days free trial and grow your ecommerce using data.
KPIs allow you to quantify the most crucial aspects of your business that you need to perform well. You don’t have to immediately start tracking all of the 5 ecommerce KPIs we listed in this guide, but we recommend that you pick at least 1-2 to use immediately. Over time, the insights you get will be more than worth the time and effort you put into it. To bring out the best from your KPIs, you can use real-time dashboards that will let you track and visualize the ecommerce metrics that are the most valuable for your business: dashboard software are a good help in the matter. Try datapine’s free trial as a first step!